bookmark_borderIntegrating Chaos: New Climate Models Project Up to 9°C Warming This Century

by Daniel Brouse
April 6, 2025

How can the climate breakdown and collapse of the climate system be explained through chaos theory?

Great question — this is one of those rare cases where chaos theory isn’t just useful — it’s necessary to understand what’s happening with the climate system.

In a nutshell:

The climate system is a non-linear, complex, feedback-driven system — exactly the kind of system chaos theory was developed to describe.

Chaos Theory Basics (quick refresher)

Chaos theory studies how small changes in initial conditions can lead to wildly different outcomes in complex systems. This is often called sensitive dependence on initial conditions — or famously, the butterfly effect.

In chaotic systems:

  • Behavior looks random, but is deterministic underneath.

  • Predictability breaks down over time.

  • Feedback loops accelerate instability.

  • Thresholds or tipping points matter more than averages.

The Climate System is a Classic Chaotic System

Climate Feature Chaos Theory Concept Example in Climate Breakdown
Feedback Loops Positive/Negative Feedback Melting ice reduces reflectivity → warms faster. Dying forests release CO₂ → warms faster.
Sensitive Dependence Butterfly Effect Tiny changes in Arctic ice cover alter the jet stream → extreme weather thousands of miles away.
Non-linearity Disproportionate Outcomes +1°C doesn’t mean “a little worse” → it can mean entirely new weather patterns, droughts, floods, collapse.
Tipping Points Critical Thresholds Collapse of Greenland Ice Sheet or Amazon rainforest sets off irreversible global changes.
Attractors Shifting Stability Zones The climate might “prefer” certain stable states (ice age vs warm period) — human forcing could push us into a new, hostile attractor.

Chaos Theory Explains Why Climate Collapse Feels Sudden

  1.  Long period of relative stability (homeostasis in chaos theory terms).

  2.  Hidden stresses build slowly (greenhouse gases, deforestation, pollution).

  3.  System nears a critical threshold (edge of chaos).

  4.  Seemingly small trigger (like a bad El Niño year) causes cascading failures:

    • ocean currents stall

    • food systems fail

    • regional collapses emerge

    • global feedbacks accelerate

The Frightening Part (but also the scientific truth)

Climate breakdown isn’t a slow, smooth, linear decline.
It’s a chaotic, non-linear system heading for phase shifts, tipping points, and potential collapse.

That’s why decades of “x degrees = y impacts” models are failing.
Real-world climate disruption is jumping ahead faster than expected — because the system is moving into a chaotic regime.

A Final Visual Metaphor (from chaos theory)

Imagine Earth’s climate as a ball rolling in a valley:

  • Stable = ball stays in the valley bottom.

  • We’ve pushed the ball up the slope (burning fossil fuels).

  • The higher it goes, the more unstable.

  • At some point the ball tips over into another valley — a new stable state (but maybe hostile to life as we know it).

 This is what collapse looks like in chaos theory.

Bottom Line

Climate change isn’t just “getting hotter.”
It’s a chaotic transition, where:

  • Local events become global.

  • Predictability evaporates.

  • System stability breaks.

  • Collapse happens not slowly — but in lurches, jumps, and phase changes.

Our updated climate model, which integrates complex social-ecological dynamics with the non-linear, feedback-driven behavior of physical systems, indicates global temperatures could rise by as much as 9°C this century.
bookmark_borderThe Silencing of America: Journalism, Protest, and the Rise of Fear

by Anonymous
April 6, 2025, updated July 2025

It is terrifying to watch American journalism go silent — not because reporters don’t care, but because many of us know exactly what happens when we speak the truth now.

I know. I’ve been an investigative journalist for over 45 years, filming police corruption, government lies, and abuse of power across this country. I have faced threats before. But this — this is something darker.

On election day, I realized I could no longer safely use my real name. The night before, I dreamed I was arrested at a protest. That is not paranoia. That is preparation in Trump’s America.

Since returning to power, Trump has wasted no time weaponizing the legal system against his perceived enemies — especially the press. Major networks like ABC and independent journalists face a relentless barrage of lawsuits, not because Trump expects to win, but because he wants to bleed them dry and silence them. Under a Justice Department now resembling a political death squad, who will stop him?

And it’s not just lawsuits. State and federal crackdowns on peaceful protests are increasing, targeting Americans exercising their constitutional rights. Their crime? Daring to oppose genocide, war, or environmental destruction. At the Hands Off! protests, the loudest chants weren’t just against war — they demanded the release of political prisoners held in America today.

This is no longer creeping fascism. It is marching down Main Street with impunity.

Anyone who knows history sees the signs. This is how it starts: with fear. With silence. With people convincing themselves, “It can’t happen here.”

But it is happening here.

A Coordinated Assault on Truth

Trump is not alone. In Israel, Netanyahu’s far-right government has banned journalists from reporting in Gaza and outlawed Al Jazeera, the region’s most reliable independent outlet. Reporters who attempt to document atrocities face arrest or worse.

Both leaders understand that silencing truth is essential to maintaining authoritarian power. Their tactics are deliberate: demonize the press, weaponize courts, spread disinformation, and make public dissent a punishable offense.

Meanwhile, as these leaders dismantle democratic institutions, they fuel crises that demand accountability: genocide in Gaza, escalating wars, environmental collapse, and economic ruin. Silencing journalists silences the evidence.

Why This Moment Matters

We have entered a dangerous feedback loop: authoritarian regimes suppress dissent, allowing them to escalate violence and repression, which in turn demands more suppression to avoid accountability.

Independent journalism is the last line of defense. Without it, people will not know the full extent of the atrocities being committed in their name, the corruption draining their futures, or the environmental collapse accelerating under deregulation.

We, as journalists, continue to report — even if anonymously — because silence is complicity.

And we, as citizens, must decide if we will let fear dictate our future.

Citizen, beware.

Journalist, beware.

Truth is now treason in Trump’s America, and in Netanyahu’s Israel.

If we allow the silencing of journalism, the silencing of democracy will follow.


Silencing Truth: The War on Journalism by Netanyahu and Trump

Trumpenomics: The Decline of the US

bookmark_borderTrump, Debt, and the Art of Losing Other People’s Money

Company Profile

Donald J. Trump (DJT) Hotels & Casinos was an entertainment company that owned and operated the Trump Plaza Hotel and Casino, Trump Taj Mahal Casino Resort, Trump’s Castle Casino Resort and Trump Indiana.

Besides revenues from gambling, the properties offered other forms of entertainment. The Taj Mahal was an experience unto itself. Just the entrance had $1 million in 24-karat gold leaf… and, millions of dollars worth of German crystal chandeliers sparkled over the lobby’s Carrera marble-floor.

I’m an economist. In the 1990s, I conducted a moral and ethics experiment involving the stock DJT for a widows and orphans fund, during which Trump misappropriated the funds. A business bankruptcy impacts more people than a personal bankruptcy and is seen as a more significant violation of business ethics and morals.

The original stock with the ticker symbol DJT belonged to Trump Hotels & Casino Resorts (THCR), a company founded by Donald Trump in the 1990s. It operated various casinos and resorts, including Trump Plaza, Trump Taj Mahal, and Trump Marina in Atlantic City. THCR faced ongoing financial difficulties, which eventually led to four major bankruptcies. In 1995, the company went public under the ticker DJT, aiming to raise funds to refinance debts and expand its casino ventures. However, the company quickly became over-leveraged with high-interest debt, which plagued its operations.

The first bankruptcy in the timeline occurred in 1991, before DJT went public, when Trump’s Taj Mahal casino filed for Chapter 11 bankruptcy after failing to generate enough revenue to service its over $1 billion debt from junk bonds. Trump had to give up half of his ownership in the Taj Mahal but retained control of the casino. In 2004, Trump Hotels & Casino Resorts (by then public under DJT) filed for bankruptcy a second time due to its massive debt load and struggling casino operations. During this bankruptcy, Trump gave up more control of the company to creditors, though he stayed on as chairman.

In 2009, the company, rebranded as Trump Entertainment Resorts, filed for Chapter 11 again, marking the third bankruptcy. Trump resigned as chairman and left the board of directors, maintaining only a small ownership stake. Despite these efforts, the financial situation worsened, and in 2014, the company filed for bankruptcy a fourth time, leading to the closure of the Trump Plaza and Trump Taj Mahal casinos. This final bankruptcy signaled the end of Trump’s casino ventures, though his name remained on some properties through branding agreements.

The successive bankruptcies decimated the value of DJT stock, and Trump’s stake in the company dwindled over time. By the time of the 2014 bankruptcy, Trump had little control over the company. Eventually, DJT stock ceased to exist as the company’s assets were sold off. The bankruptcies are often cited as part of Trump’s controversial financial history, where he used bankruptcy laws to restructure debts, often at the cost of shareholders and creditors.

Conclusion

It’s difficult to determine the exact number of corporate bankruptcies associated with Donald Trump’s business ventures, in part because of how some analysts count them. In this particular case, there were four separate bankruptcy filings, though many analysts count them collectively as a single event. Broadly, most sources agree that Trump’s companies have filed for bankruptcy at least six times, with some estimates — depending on how repeat filings by the same entity are treated — placing the total closer to 12 to 14.

In each instance, critics have argued that Trump personally profited despite the financial losses borne by shareholders, lenders, and employees. These allegations typically focus on patterns of aggressive debt use, questionable fiscal management, and the transfer of risk from Trump to investors and creditors.

Now, he is doing it worldwide.

As one economist put it:

“Trump didn’t just pick a trade war — he picked one with the entire planet.”

A Crisis of This Magnitude Has Not Been Seen in Nearly 100 Years

While past recessions were driven by financial collapses (such as 2008’s mortgage crisis or the dot-com bubble in 2000), this economic crisis is entirely policy-driven. The sheer scale of the tariffs, combined with global retaliation and the isolation of the U.S., has created a trade collapse not seen since the 1930s. If history is any guide, the consequences could be severe, with prolonged economic hardship, market instability, and lasting damage to U.S. credibility in global trade.

Capital Preservation During Trumpenomics

Trumpenomics: The Decline of the US

bookmark_borderHow Tariffs on Guitars and Pianos Could Impact the Next Generation of Musicians

by Daniel Brouse
April 3, 2025

An economist just referenced Little Richard to illustrate how tariffs might impact young musicians. Little Richard, known for his energetic vocals and piano playing, also had a band called “The Upsetters,” and while he wasn’t primarily a guitarist, he had notable guitarists in his band, including Jimi Hendrix. Due to tariffs on guitars, the next “Little Richard Band” may not be able to afford a starter instrument, potentially depriving future generations of groundbreaking artists.

The new tariffs will significantly impact the price of pianos, depending on their country of origin and the materials used in their construction. Many pianos, especially more affordable models, are imported from China, and if tariffs are imposed on Chinese-made pianos or parts, the price for consumers could rise. With the proposed tariffs on China totaling up to 114%, the cost of Chinese-made pianos could increase substantially. Additionally, pianos from countries like Japan, South Korea, and Indonesia face substantial tariff increases. Additionally, labor shortages and increased shipping costs resulting from tariffs on freight could further drive up piano prices. Retaliatory tariffs from other countries could disrupt the supply chain for piano parts or finished products, potentially making American-made pianos more expensive. It’s likely that both imported and domestically produced pianos could become much more expensive due to these tariffs.

The imposition of tariffs on countries that supply musical instruments and their components—particularly China, Canada, Mexico, and the EU—along with tariffs on wood, metal, and electronics, raises production costs for manufacturers, resulting in higher retail prices for consumers, including for starter guitars and other musical instruments. The combined taxes could exceed 100%, potentially leading to a halt in imports of more affordable instruments. This, in turn, would make it harder for young musicians to access the tools they need to start their musical journey, potentially limiting the next generation of groundbreaking artists.


Trump’s Sector-Specific Tariffs

Trumpenomics: The Decline of the US

bookmark_borderUnderestimation of Climate Sensitivity and Feedback Processes

by Daniel Brouse
April 2, 2025

In the 1990s, we first hypothesized the non-linear acceleration of climate change. By the early 2000s, this hypothesis had evolved into established climate theory, now widely recognized as scientific fact. My lab partner, a Doctor of Physics from Ohio State, and I collaborated to provide key evidence supporting this theory. Over the years, we have observed a dramatic reduction in the doubling time of climate change impacts — the rate at which these effects intensify. Initially, the doubling time was approximately 100 years, but it has since decreased to 10 years and, more recently, to just 2 years. This trend implies that the damage caused by climate change today is double what it was two years ago. In two years, it could be four times worse; in four years, eight times worse; and within a decade, potentially 64 times worse. These projections are conservative, assuming the doubling period does not continue to shrink further. Alarmingly, this rapid acceleration does not appear to be an anomaly. If this trajectory persists, the consequences will likely be far more catastrophic than previously anticipated.

Dr. James E. Hansen’s paper Global Warming Acceleration: Impact on Sea Ice confirms our theory with an analysis of the acceleration of global warming and its impact on sea ice, ice sheets, and ocean circulation, with a particular focus on the Atlantic Meridional Overturning Circulation (AMOC). Climate sensitivity is higher than previously estimated (ECS = 4.5 ± 0.5°C for doubled CO₂), which fundamentally alters expectations for future climate change. IPCC models fail to account for freshwater effects on sea ice cover, leading to an underestimation of climate sensitivity and feedback processes.

AMOC Shutdown Risk: Hanson emphasizes that accelerated warming increases the likelihood of AMOC shutdown by reducing surface water density in deepwater formation regions. A shutdown would trigger severe long-term consequences, including rapid sea level rise.

An AMOC shutdown would have severe and far-reaching impacts worldwide. For instance, on the U.S. East Coast it would lead to rapid sea level rise, stronger storms, and extreme weather shifts. As the AMOC slows or stops, warm water would no longer be transported northward, causing ocean water to pile up along the East Coast, which could raise sea levels by 1-3 feet (30-90 cm) almost immediately, on top of global sea level rise. This would have particularly devastating effects on the Northeast U.S. (New York, Boston, DC, Miami), where flooding would be most severe.

The weakening or shutdown of the AMOC would also impact hurricane formation. With warmer waters off the East Coast, hurricanes would become more intense and slower-moving, leading to longer-lasting and more destructive storms, like Hurricane Sandy. As the Gulf Stream weakens, hurricanes could linger longer over coastal cities, causing catastrophic flooding. Additionally, the disruption of weather patterns would lead to a stark contrast: the Northeast and Europe could experience much colder winters while the Southeast U.S. (Florida, Georgia, Carolinas) would face more extreme heat and droughts.

Increased rainfall and flooding would also become more common. With the Gulf Stream weakened, storms could stall over cities, dumping massive amounts of rainfall, similar to what occurred during Hurricane Harvey in Texas but along the East Coast. Nor’easters and stronger winter storms would become more frequent, particularly in New England. The disruption of the AMOC would also have catastrophic consequences for marine ecosystems. The circulation helps distribute nutrients in the ocean, and its shutdown could disrupt fish migration patterns and collapse major fisheries, especially in the Northeast U.S., where industries like cod fishing and lobster harvesting would be devastated.

In a Climate Crisis

Since the Earth’s equilibrium climate sensitivity (ECS) is 4.5 ± 0.5°C for a doubling of CO₂, the likely temperature rise this century under current emission levels will be significantly higher than IPCC estimates. Here’s a breakdown of how that translates into global warming:

1. CO₂ Projections & Radiative Forcing

  • Pre-industrial CO₂ (~280 ppm) to Present (~420 ppm): We’ve already experienced a ~1.2°C rise in global temperature.

  • Business-as-Usual Scenario (High Emissions, ~800-1000 ppm CO₂ by 2100): If emissions continue at current levels, CO₂ could more than double from pre-industrial levels, reaching or exceeding 560 ppm (the doubling threshold for ECS calculations).

  • Additional non-CO₂ greenhouse gases (methane, nitrous oxide, etc.) also contribute to warming.

2. Temperature Increase by 2100

Using ECS = 4.5 ± 0.5°C, and considering:

  • Climate sensitivity refers to long-term equilibrium response (centuries), but transient warming occurs within this century.

  • The Transient Climate Response (TCR), which is lower than ECS, typically ranges ~60-70% of ECS, meaning near-term warming may be slightly less than equilibrium projections.

Projected Warming by 2100 Based on ECS = 4.5°C

  1. Lower-End Case (~550-600 ppm CO₂, with significant mitigation efforts)

    • Optimistic warming: ~3.5–4.5°C

    • Comparable to IPCC’s worst-case scenarios (RCP 6.0–7.0 range)

  2. High-Emissions Case (~800-1000 ppm CO₂, with some mitigation)

    • Potential warming: ~5–7°C

    • This is significantly worse than IPCC’s RCP 8.5 projection, which assumes ECS = 3°C.

  3. Business as Usual Case (Feedbacks Accelerate Warming: AMOC Shutdown, Ice-Albedo, Methane Releases, etc.)

    • Expected warming: 7-9°C or more

    • This would resemble past hyperthermal events like the Paleocene-Eocene Thermal Maximum (PETM).

3. Policy & Adaptation Implications

  • If ECS is higher than IPCC estimates, it means current climate policies are underestimating risk.

  • The IPCC’s mid-range scenarios (projecting ~3°C by 2100) may be too optimistic if ECS is truly ~4.5°C.

  • Higher ECS implies faster and more extreme tipping points, including AMOC collapse, rapid sea level rise, and uninhabitable regions.

4. Urgency for Rapid Emission Cuts

  • Even immediate aggressive action (net-zero by mid-century) would still result in ~2.5-3°C warming due to existing CO₂ levels and slow response time.

  • Avoiding catastrophic warming (>4°C) requires drastic reductions in fossil fuel use this decade.

Bottom Line: At Current Emissions, Warming by 2100 is Likely 6°C or Higher

This level of warming would lead to massive global disruptions, including widespread droughts, stronger hurricanes, agricultural collapse, and displacement of hundreds of millions due to rising sea levels. If ECS is truly 4.5°C, the window to prevent catastrophic warming is far smaller than most policymakers assume.

* Our climate model employs chaos theory to comprehensively consider human impacts and projects a potential global average temperature increase of 9℃ above pre-industrial levels.

bookmark_borderTrump Economic Facts

Amazingly, some still suffer from Trump Delusionment Syndrome, defending his economic policies while claiming Biden ‘destroyed the economy’ or insisting that Trump needs to ‘break some eggs’ to bake a cake—meaning we need to endure pain. No, we don’t need pain. The economy performed the best in history during Biden’s term, in sharp contrast to both Trump 1.0 and the early signs of Trump 2.0.

Let’s look at the numbers: During Trump’s first term (2017–2021), the national debt increased by about $7.8 trillion, mainly due to tax cuts that didn’t pay for themselves and pandemic-related spending. Under Biden (2021–2025), the debt rose by about $6.3 trillion—but a significant portion of that came from legislation and tax policies enacted under Trump.

Now, three months into Trump’s second term (2025–2029), debt projections are looking even worse. Estimates suggest Trump 2.0 will add an additional $10 trillion, driven by an extension of his tax cuts and increasing deficits. By the end of Trump 2.0, Trump will have added more to the national debt than all Democratic presidents combined.

So if debt is your concern, you might want to rethink which administration is actually running up the tab. On the other hand, if you’re talking about GDP, we are currently experiencing the sharpest decline since Trump’s last term—when he oversaw the fastest economic contraction in U.S. history.

Protectionism is one of the worst economic policies. Tariffs are regressive taxes that disproportionately harm marginalized communities while failing to boost the economy or reduce the deficit. The last time a president imposed broad tariffs, it contributed to the Great Depression—a global economic catastrophe that took decades to recover from and provided no lasting benefits to society.

Trumpenomics: The Decline of the US

bookmark_borderGold: A Growing Influence in Today’s Market

by Daniel Brouse
March 28, 2025

Gold: A Growing Influence in Today’s Market

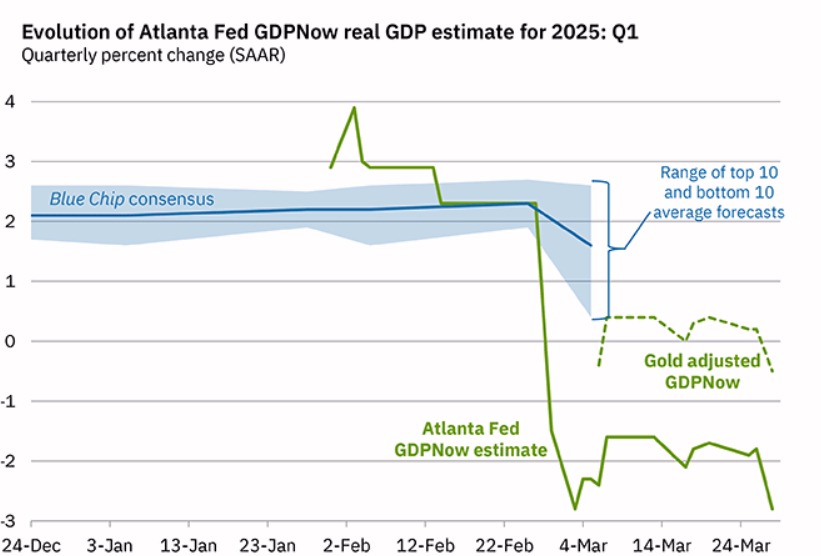
Gold has always been a significant asset in the global financial landscape, but recently, its influence has grown in ways not seen for quite some time. One key reason for this increased attention is its impact on the Atlanta Federal Reserve’s GDPNow tracker. In fact, the Fed had to add a special line in its graph to account for the significant influence of net gold imports on U.S. GDP. This is not a typical occurrence and signals that gold is playing a more prominent role in the economy than it has in recent decades.

Why is Gold Significant?

Gold is generally considered in two primary ways: as a store of wealth and as a commodity used in products such as jewelry and electronics. Traditionally, gold flows have been relatively stable. That means the Fed typically does not focus much on gold as it doesn’t typically cause significant economic disruption or fluctuation. However, recent trends have shown an increase in gold imports that is disproportionate to other sectors of the economy. This surge has been so large that it has skewed GDP calculations, prompting the Fed to specifically acknowledge it.

The challenge with accurately tracking gold’s economic impact stems from how it is measured and classified. Imports and exports of gold can be difficult to track, especially considering the different forms in which gold is used. It is not always clear whether gold is entering the country for industrial use or simply as a hedge against economic uncertainty, making it harder for analysts to determine its full economic impact.

The Fed’s Usual Disregard for Gold

So why doesn’t the Federal Reserve usually pay more attention to gold? In past decades, gold flows were relatively predictable and static. It was a safe asset that largely served as a store of value, with only small fluctuations in demand. Therefore, gold didn’t play a significant role in influencing broader economic data like GDP growth. This predictability, combined with the move away from the gold standard, meant that gold was seen as less relevant in day-to-day monetary policy decisions.

However, recent patterns have changed. A combination of global economic uncertainties, inflation fears, and geopolitical tensions has led to a surge in demand for gold as a safe haven asset. As a result, huge gold imports have recently overshadowed other aspects of the GDP, pushing the Federal Reserve to reconsider its influence.

What Does This Mean for You?

For the average investor, the growing prominence of gold has several potential implications. The most significant impact could be felt if you have a 401(k), invest in mutual funds, or hold ETFs. Many of these investment vehicles, particularly index funds and mutual funds, are required to stay fully invested in the market. This can leave investors vulnerable during periods of market volatility or when certain asset classes, like stocks, are underperforming.

In these times, it might be wise to consider reducing risk, or “beta,” in your portfolio. This means adjusting your investment strategy to become more defensive, moving away from riskier equities, and diversifying into other assets—such as gold. By reallocating a portion of your investments into gold, you can help hedge against volatility, preserve wealth, and potentially capitalize on gold’s rising demand. This is especially pertinent when traditional markets experience instability, and gold continues to serve as a long-standing safeguard against inflation and market turmoil.

The Bottom Line

The growing significance of gold in today’s economic environment is not a passing trend. As illustrated by the Fed’s GDPNow tracker, the surge in gold imports is not merely a statistical anomaly but a clear indication of broader economic shifts. Such movements in asset flows are valuable signals for individual investors, offering insight into changing market dynamics. Other key indicators to watch include currency and credit flows, which also provide clues about the direction of the economy. However, for small investors, participating directly in many of these trades can be challenging—especially with issues like storing gold, soy, or pork bellies.

In times like these, your best investment strategy is likely to focus on tangible assets. Housing should remain your largest asset, offering long-term stability and growth potential. For additional savings and retirement funds, consider allocating 90% to short-term treasuries, 5% to Treasury I Bonds, and 5% to gold and other real assets. This diversified approach can help protect your wealth and provide a hedge against economic uncertainty.


GDPnow 3-28-2025
GDPnow 3-28-2025

Capital Preservation During Trumpenomics

Trumpenomics: The Decline of the US

bookmark_borderCOVID UPDATE: Trump the Destroyer

by Daniel Brouse
March 28, 2025

Trump the Destroyer

During his first term, Trump oversaw the rise and spread of COVID-19, which resulted in millions of deaths. He downplayed the virus, even calling it a hoax. He suggested ingesting disinfectants and exposing the internal organs to UV light as remedies, despite widespread medical warnings against such dangerous misinformation.  Now, he has cut all funding for critical programs aimed at preventing future pandemics, leaving the nation vulnerable to future outbreaks of even more deadly viruses.

The Trump administration, in coordination with the Department of Government Efficiency (DOGE), has implemented sweeping cuts to COVID-19 research funding, including the critical AVIDD (Antiviral Drug Discovery and Development) and ASAP (Accelerating COVID-19 Therapeutic Interventions and Vaccines) programs. These cuts threaten the progress made in understanding and combating zoonotic diseases, which are responsible for the emergence of deadly viruses such as COVID-19.

Scientific experts have warned that reducing funding for these antiviral programs will leave the U.S. and the world more vulnerable to future pandemics. AVIDD and ASAP were instrumental in the rapid development of treatments and vaccines during the COVID-19 crisis. Without sustained investment in these areas, research into potential emerging pathogens will be significantly hindered, delaying response times and increasing the likelihood of widespread outbreaks.

The administration’s decision to cut funding is part of a broader rollback of public health initiatives. The NIH, which oversees AVIDD and ASAP, is facing an overall budget reduction, including a proposed 20% funding cut that would impact infectious disease research, vaccine development, and pandemic preparedness. Scientists and health officials have raised alarms that these cuts could set back medical advancements by decades, making it harder to develop treatments for existing and future health threats.

Public health organizations and advocacy groups are mounting opposition to these policy decisions, emphasizing that weakening pandemic defenses in a world still recovering from COVID-19 is reckless and dangerous. The cuts not only threaten scientific progress but also put millions of lives at risk by reducing the nation’s ability to respond swiftly to new viral threats.

As researchers scramble to find alternative funding sources, the long-term consequences of these cuts remain uncertain. However, history has shown that underfunding infectious disease research can lead to devastating consequences. The world witnessed this with COVID-19, and without continued support for programs like AVIDD and ASAP, the risks of another pandemic grow exponentially.

The question remains: Will the U.S. learn from past mistakes, or will short-sighted policy decisions undermine the progress made in pandemic preparedness?

COVID-19

bookmark_borderHow Climate Change Accelerates Erosion: Causes, Impacts, and Risks

by Daniel Brouse
March 27, 2025

Soil is a vital component of the climate system and highly vulnerable to change. Erosion and degradation have severe short-term impacts and can ultimately lead to desertification.

Erosion Feedback Loop

Climate change accelerates erosion by altering weather patterns, increasing extreme weather events, and disrupting land and water interactions. More intense rainfall, rising sea levels, and prolonged droughts all contribute to faster soil loss and degradation.

In turn, erosion exacerbates climate change through multiple feedback mechanisms:

  • Reduced Vegetation Cooling: The loss of plant cover decreases evapotranspiration, which helps regulate temperatures, leading to further warming.

  • Albedo Changes: As fertile, dark soil is stripped away, exposed lighter-colored subsoil or sand reflects more or less sunlight, disrupting local and global climate patterns.

  • Carbon Release: Erosion exposes and breaks down organic matter in soil, releasing stored carbon dioxide and methane into the atmosphere, further fueling climate change.

  • Water Cycle Disruptions: Degraded soils hold less moisture, reducing cloud formation and precipitation in some areas while increasing flood risks elsewhere.

This self-reinforcing cycle makes erosion not just a consequence of climate change but also a driver, worsening environmental instability over time.

Climate change intensifies erosion in multiple ways by altering weather patterns, increasing extreme weather events, and changing land and water interactions. Here are the key mechanisms:

1. Increased Rainfall Intensity

  • Heavier Downpours: Warmer air holds more moisture, leading to more intense rainfall. This enhances surface runoff, stripping away topsoil and deepening gullies.

  • More Frequent Storms: Stronger storms produce flash floods that erode riverbanks, coastal areas, and hillsides more aggressively.

2. Rising Sea Levels & Coastal Erosion

  • Stronger Waves & Storm Surges: Rising sea levels push tides further inland, eroding coastlines at an accelerated rate.

  • Saltwater Intrusion: Weakens coastal soils, making them more vulnerable to erosion.

  • Loss of Protective Barriers: Higher temperatures contribute to coral reef and ice cap loss, reducing natural barriers against wave action.

3. Increased Droughts & Vegetation Loss

  • Soil Drying & Cracking: Frequent droughts cause soils to dry out and become less cohesive, making them more prone to wind erosion.

  • Vegetation Decline: Heat stress, wildfires, and shifting climate zones kill plants that anchor the soil, leading to more erosion from wind and water.

4. Melting Permafrost & Landslides

  • Thawing Permafrost: Releases previously frozen organic material, causing ground instability and slumping.

  • More Landslides: Unstable, thawing soils on slopes increase the risk of landslides, especially in mountainous regions.

5. Glacial Retreat & River Erosion

  • Faster Glacier Melting: Increases sediment transport in rivers, leading to changes in riverbanks and deltas.

  • Altered River Courses: More meltwater can change river flow patterns, leading to unexpected erosion and sedimentation.

6. Stronger Wind Erosion

  • Desertification Expansion: Hotter, drier conditions turn more land into deserts, exposing it to wind erosion.

  • Dust Storms: More frequent and intense, carrying away nutrient-rich topsoil and worsening land degradation.

Overall Impact

Erosion worsened by climate change not only depletes fertile soils and damages infrastructure but also increases sedimentation in rivers, harming aquatic ecosystems. Coastal communities face greater risks, and agricultural lands lose productivity, exacerbating food insecurity.

More Resources

Soil Degradation and Desertification

The Decline of Penn’s Sylvania: Trees and Temperate Zones

The Album ‘Wood You Save the Trees?’ by The Beatless Sense Mongers

Create a sustainable and climate-resilient environment in and around your home and prevent soil degradation.

bookmark_borderThe Moving Target: How Weather and Climate Normals Mask Long-Term Warming

by Daniel Brouse
March 26, 2025

It is crucial to understand that the rate of climate change is accelerating rapidly. Weather and climate normals are essentially moving averages used to establish a baseline for comparing current weather and climate conditions. These averages help define what is considered “typical” for a location over a given period. However, it’s important to note that “normal” is only defined in relation to the very recent past. When you hear about “normal” temperatures or rainfall, it refers only to the average of the last decade or so. These calculations are continuously updated and reflect only recent climate patterns, without including pre-industrial conditions (before 1850). As a result, this creates a skewed perception, where “normal” climate baselines shift along with the ongoing warming trend, rather than revealing how much temperatures have diverged from pre-industrial levels.

Moving Averages in Weather and Climate Normals

  1. Weather Normals: These refer to averages over shorter periods (often 10 years or less) and are used primarily for operational meteorology—forecasting, monitoring seasonal trends, and comparing day-to-day conditions.

  2. Climate Normals: The most commonly used climate normals are 30-year averages, as recommended by the World Meteorological Organization (WMO) and the National Oceanic and Atmospheric Administration (NOAA). These are updated every decade (e.g., 1981–2010, 1991–2020, etc.), effectively making them a moving average that shifts forward in time.

Since these calculations continuously update, they only reflect recent climate patterns and do not incorporate pre-industrial conditions (before 1850). This creates a skewed perception where “normal” climate baselines shift along with the warming trend, rather than showing how much temperatures have diverged from pre-industrial times.

Why This Matters

  • Masking Long-Term Change: Since climate normals shift every decade, they fail to capture the full extent of human-induced warming. If we were to compare today’s temperatures to pre-industrial levels (rather than just the past 30 years), the warming trend would appear much more severe.

  • Underestimating Climate Change: Because recent normals already include warming trends, they make present-day extreme weather seem less unusual than it actually is when compared to historical records.

  • Shifting Baselines: With each update, the perception of what is “normal” changes, meaning that extreme heat events today may appear less anomalous when compared to a newer, warmer climate normal rather than a true historical baseline.

The Acceleration of Climate Change

It is crucial to understand that the rate of climate change is accelerating rapidly. Climate change is a complex, dynamic, and non-linear system, and we have observed a dramatic reduction in the “doubling time” of its impacts—the rate at which these effects intensify. Initially, the doubling time was about 100 years, but it has since decreased to 10 years, and more recently, to just 2 years. This means the damage caused by climate change today is already double what it was two years ago. In just two more years, the damage could be four times worse; in four years, eight times worse; and within a decade, potentially 64 times worse. These projections are conservative, assuming the doubling time does not continue to shorten further.

Alarmingly, this rapid acceleration does not appear to be an anomaly. If this trend continues, the consequences will likely be far more catastrophic than previously anticipated.

The evidence is clear: climate change is rapidly accelerating, and the costs — both economic and human — are growing exponentially. The future demands decisive and immediate action to curb greenhouse gas emissions and prevent further environmental and societal collapse. Our updated climate model, now integrating complex social-ecological factors, shows that global temperatures could rise by up to 9°C within this century — far beyond previous predictions of a 4°C rise over the next thousand years. This kind of warming could bring us dangerously close to the “wet-bulb” threshold, where heat and humidity exceed the human body’s ability to cool itself, leading to fatal consequences.