bookmark_borderState of the Cryosphere 2023

Dr. Sidd Mukherjee said, “Latest frightening news” — State of the Cryosphere Report-2023.

This has been a year of climate disasters and ice loss. A glacial lake outburst flood devastated Sikkim in India. Swiss glaciers lost 10% of their remaining ice over just two years. Sea ice around Antarctica hit all-time-low summer and winter records. Unprecedented fires raged across Canadian permafrost. Parts of the Arctic and North Atlantic saw water temperatures 4 – 6°C higher than normal. It rained far inland on Antarctica, and Greenland saw its second-highest surface melt ever.

Our message — the message of the Cryosphere – is that this insanity cannot and must not continue.

The Cryosphere – Earth’s ice sheets, sea ice, permafrost, polar oceans, glaciers and snow – is ground zero for climate change. This is because of the simple physical reality of the melting point of ice; or in the case of our rapidly acidifying polar oceans, the amount of CO2 in the atmosphere absorbed and turned to carbonic acid.

The warming impact of CO2, around 80% from fossil fuel use, already has led to steep glacier and ice sheet loss causing global sea-level rise; reduction of water resources from snowpack; growing CO2 and methane emissions from thawing permafrost; dramatic reduction of sea ice, now alarmingly low in both polar oceans; and growing evidence of stress on keystone polar marine species, such as krill, salmon and cod, from polar ocean acidification, warming and freshening. Enough. It is time to carve a line in the snow: because of what we have learned about the Cryosphere since the Paris Agreement was signed in 2015, 1.5°C is not merely preferable to 2°C. It is the only option.

Otherwise, world leaders are de facto deciding to burden humanity for centuries to millennia by displacing hundreds of millions of people from flooding coastal settlements; depriving societies of life-giving freshwater resources, disrupting delicately-balanced polar ocean and mountain ecosystems; and forcing future generations to offset long-term permafrost emissions.

This continued rise in CO2 is unacceptable.

The melting point of ice pays no attention to rhetoric, only to our actions.

Sea-level Rise: Greenland and the Collapse of the East Antarctic Ice Sheet Mukherjee and Brouse (2022 and 2023)

Sea Level Rise: Then and Now Mukherjee and Brouse (2023)

Climate Change: Rate of Acceleration Brouse and Mukherjee (2023)

Toppled Tipping Points: The Domino Effect Brouse and Mukherjee (2023)

The Age of Loss and Damage Brouse (2023)

bookmark_borderSea Level Rise and Saturation

By Daniel Brouse
October 28, 2023

What causes sea level rise? If the melting ice and snow isn’t going into the sea, where is it going?

NOAA says:
The volume of the ocean is expanding as the water warms. Thermal expansion happens when water gets warmer, which causes the volume of the water to increase. About half of the measured global sea level rise on Earth is from warming waters and thermal expansion.

There is a shift of liquid water from land to ocean due largely to humans depleting ground water.

United Nations DRR says:
For every degree Celsius in warming, the water-holding capacity of the atmosphere increases by about 7%. Record-high sea temperatures ensure there is more moisture (in the form of water vapour) in the atmosphere, by an estimated 5-15% compared to before the 1970s, when global temperature rise began in earnest.

Water vapour is a powerful greenhouse gas. Since the 1970s, its rise likely increased global heating by an amount comparable to that from rising carbon dioxide. We are now seeing the consequences. In the current climate, for average all-sky conditions, water vapour is estimated to account for 50% of the total greenhouse effect, carbon dioxide 19%, ozone 4% and other gases 3%. Clouds make up about a quarter of the greenhouse effect.

The main greenhouse gases – carbon dioxide, methane, nitrous oxide and ozone – don’t condense and precipitate. Water vapour does, which means its lifetime in the atmosphere is much shorter, by orders of magnitude, compared to other greenhouse gases. On average, water vapour only lasts nine days,

The most common measure of water vapour in the atmosphere is relative humidity. Deadly humid heat affects billions including the US Midwest this century. “It’s very disturbing,” study co-author Matthew Huber of Purdue University. “It’s going to send a lot of people to emergency medical care.”

The study Greatly enhanced risk to humans as a consequence of empirically determined lower moist heat stress tolerance was conducted by Purdue and George Mason University and published August 15, 2023.

These results indicate that a significant portion of the world’s population will experience — for the first time in human history — prolonged exposures to uncompensable extreme moist heat. Humans will struggle to adapt to these conditions in a warmer world as they will present widespread challenges across many aspects of food-energy-water security, human health, and economic development including in the world’s most populous and most vulnerable regions.

At 3C (5.4F) of yearly average warming, more than 1.5 billion people will suffer. In the summer of 2023,
the Earth experienced about a month of warming at 3C above pre-industrial levels. Both 2022 and 2023 saw a record number of heat related deaths. More than 61,000 Europeans died from extreme heat in the summer of 2022.

Sea Level Rise in the Sky
So how much of the melting ice is going into the sky instead of just dripping into the sea?

NASA says:
Hot air expands, and rises; cooled air contracts – gets denser – and sinks; and the ability of the air to hold water depends on its temperature. A given volume of air at 20°C (68°F) can hold twice the amount of water vapor than at 10°C (50°F). The relationship of how much water a given mass of air actually holds compared to the amount it can hold is its relative humidity.

When air holds as much water vapor as it can for a given temperature (100% relative humidity), it is said to be saturated. If saturated air is warmed, it can hold more water (relative humidity drops), which is why warm air is used to dry objects–it absorbs moisture. On the other hand, cooling saturated air (said to be at its dew point) forces water out (condensation). This is why a container of a cold beverage sweats: it cools the air next to it and moisture from the air condenses on the outside of the can.

Air warmed by ocean currents picks up a lot of moisture. As the heated air rises, it expands, which is measured at the surface as low air pressure. Expanding air cools, which forces it to lose its moisture as rain or snow. The opposite is true for sinking air. Such air compresses and warms. In a zone of high pressure like this, moisture is absorbed by the air from its surroundings.

According to the USGS, the volume of all water on Earth is estimated to be 332.5 million cubic miles. As a result of the hydrologic cycle, Earth’s water is never in one place for too long. It evaporates, turns to vapor, condenses to create clouds and falls back to the surface as precipitation. The cycle then begins again.

“On average, there is about the equivalent of 30 mm [1.2 inches] of rain in the form of vapor available to fall over any point of Earth’s surface,” Frédéric Fabry, the director of the J. Stewart Marshall Radar Observatory and an associate professor of the environment and the Department of Atmospheric and Oceanic Sciences at McGill University in Canada said. “That’s around 55 pounds [25 kilograms] of water over every square yard, most of which is in the form of vapor,” he said. Given that the surface area of Earth is about 197 million square miles (510 million square kilometers), there’s around 37.5 million-billion gallons of water in the atmosphere, Fabry said. If all of this mass were to fall at once, it would raise the global ocean level by about 1.5 inches (3.8 centimeters), he added.

Climate Change Post reports, “Just a few cm of sea-level rise may double the frequency of coastal flooding.”

A study published in the journal Scientific Reports, if sea levels rise between 2 and 4 inches (5 and 10 cm), it will double the flooding frequency in a host of regions, “particularly in the tropics.”

It looks like the atmosphere currently holds about 1.5 inches of sea level rise…
as the temperature rises will it be able to hold 3 inches?

What happens when the atmosphere can’t hold any more?

The Reign of Violent Rain

Climate Change: Rate of Acceleration

Climate Change: How Long Is “Ever”?

The Human Induced Climate Change Experiment

bookmark_borderAntarctic Ice Shelves Shrink at Alarming Rate

“Scientists track ‘alarming’ melt in Antarctic ice shelves”
“Forty percent of Antarctica’s ice shelves are shrinking, worrying scientists”

“We expected most ice shelves to go through cycles of rapid, but short-lived shrinking, then to regrow slowly. Instead, we see that almost half of them are shrinking with no sign of recovery,” said lead author Benjamin Davison, research fellow at the University of Leeds.

“Acceleration of glaciers due to ice shelf deterioration has added about six millimetres to global sea level since the start of the study period,” said Davison. “The ocean absorbs a lot of atmospheric heat and carbon and the Southern Ocean surrounding Antarctica is the largest contributor to that, so it’s a hugely important regulator of global climate.”

“We are seeing a steady attrition due to melting and calving… This is further evidence that Antarctica is changing because the climate is warming,” Anna Hogg, a University of Leeds professor who co-authored the study, said.

The study Annual mass budget of Antarctic ice shelves from 1997 to 2021 concludes:
We show that Antarctic ice shelves have exported 67,000 ± 3200 Gt of freshwater to the Southern Ocean from 1997 to 2021, of which solid ice (calving) provided 60% and which has been fairly constant on annual timescales since 1997 other than spikes in solid ice export from large calving events. These spatially and temporally resolved freshwater flux estimates could be used to inform modeling investigations seeking to constrain any emerging impacts of Antarctic freshwater export on Southern Ocean circulation, iogeochemical cycling, and ecological productivity, compared to other observationally constrained climate forcings, such as changes in sea ice extent and formation rates.

Building on previous studies (7, 45), we show that many Antarctic ice shelves deteriorated significantly from 1997 to 2021 and that the vast majority of those have significant mass loss trends. Pan-Antarctic ice shelf mass decreased overall by 7500 ± 1500 Gt during the 1997–2021 period due to both terminus retreat (6200 ± 700 Gt) and basal melt–induced thinning (4480 ± 1420 Gt), which were partially offset by increases in grounding line discharge (1770 ± 870 Gt), SMB (340 ± 90 Gt), and grounding line retreat (1070 ± 170 Gt). Ice shelf mass loss was regionally concentrated along the Antarctic Peninsula, the Amundsen Sea, and Bellingshausen Sea coastlines in West Antarctica, and in Wilkes Land and Victoria Land in East Antarctica. Pan-Antarctic ice shelf mass has increased since 2002 due to the steady advance of a small number of large ice shelves, but this growth masks significant and sustained reductions in the mass of many Antarctic ice shelves. Basal melt–induced thinning was the dominant mass loss term for a slight majority (52 to 73%) of ice shelves that lost mass. Both basal melt–induced thinning and retreat were significantly positively correlated with grounding line discharge change at many ice shelves, but there was a wide range in the strength and form of the relationship between ice shelves. These new observations provide a more detailed picture of the health of Antarctic ice shelves and drivers of ice shelf mass change than was previously available and highlight the wide-ranging relationships between ice shelf mass change and grounding line discharge change.

Also see:

Climate Change: Rate of Acceleration Brouse and Mukherjee (2023)

Sea-level Rise Mukherjee and Brouse (2022 and 2023)

Climate Change: How Long Is “Ever”? Brouse (2023)

bookmark_borderTipped Tipping Points, Feedback Loops, and the Domino Effect

By Daniel Brouse and Sidd Mukherjee
September 29, 2023

A look at three (3) of the multiple tipping points we appear to have breached and The Domino Effect:

  • Mountain Glacier Loss
  • Collapse of AMOC (Atlantic Meridional Overturning Circulation)
  • Amazon Rainforest Dieback

Crossing one tipping point would be alarming. For instance, crossing the tipping point for ‘mountain glacier loss‘ has immediate consequences: millions of people in Europe will be impacted by the lack of fresh water. Billions of people that live along coasts will be impacted by the saline infiltration and eventually by the submerging of their property. In September of 2022, UNESCO reported accelerated melting of glaciers in World Heritage sites, with glaciers in a third of sites set to disappear by 2050. In September of 2023, the GLAMOS glacier monitoring center found 10% of Swiss glaciers had disappeared in the last 2 years. They do not expect any Swiss glaciers will be left by 2050 no matter what actions are taken. If extreme measures are taken, they anticipate we may be able to save some polar glaciers.

This in and of itself should be alarming; however, it gets worse. Tipping points are parts of feedback loop systems. The ice–albedo feedback loop is an expression of the ability of surfaces to reflect sunlight (heat from the sun). Any loss of ice over a darker surface means the surface will absorb more heat and reflect less heat. This process makes the Earth warmer causing more loss of ice… which in turn causes more warming of the Earth. So, yes, the mountain ice tipping point is quite alarming for both its immediate impact as well as its self-sustaining growth to global warming; but wait, it gets more alarming. The increasing temperatures due to crossing a tipping point cause other tipping points to be toppled (The Domino Effect).

The tipping point for the collapse of AMOC (Atlantic Meridional Overturning Circulation) was thought to be centuries away, at the earliest. In July of 2023, the study Warning of a forthcoming collapse of the Atlantic meridional overturning circulation was published in the journal Nature Communications. “Here we provide statistical significance and data-driven estimators for the time of tipping. We estimate a collapse of the AMOC to occur around mid-century (2025-2095) under the current scenario of future emissions.” The collapse is likely to cause faster sea level rise on the east coast of the US, more severe storms in Europe, and increasing drought in the Sahel in Africa. “From the study of past climate, we know changes in the AMOC have been some of the most abrupt and impactful events in the history of climate,” said Prof. Stefan Rahmstorf, at the Potsdam Institute for Climate Impact Research in Germany and world leading oceanographer. During the last Ice Age, winter temperatures changed by up to 10C within three years in some places. “We are dealing with a system that in some aspects is highly non-linear, so fiddling with it is very dangerous, because you may well trigger some surprises,” he said. “I wish I knew where this critical tipping point is, but that is unfortunately just what we don’t know. We should avoid disrupting the AMOC at all costs. It is one more reason why we should stop global warming as soon as possible.” A feedback loop created by the AMOC tipping point is disruption in weather systems and circulation that cause loss of naturally occurring carbon sinks. One scenario is desertification of the Amazon rainforest.

The tipping point / feedback loop problem is very complex (chaos theory) and exponentially alarming. A third tipping point appears to have been triggered by the summer of 2023 — Amazon Rainforest Dieback. The Amazon is often referred to as ‘the lungs of our planet.’ Not only does the Amazon suck in huge quantities of CO2 and breath out O2, but the Amazon soils also store huge amounts of CO2.  The desertification of the Amazon would result in a release of the carbon as the soils disappeared.

1) much of July was spent at record temperatures +3C
2) the collapse of the Amazon rainforest is likely to happen between +2 – 4C. The collapse of the Amazon is expected to occur because of changing weather patterns and circulation that result in drought.
3) Brazil set up a task force for “unprecedented drought in the Amazon”

Low river levels and hotter waters have killed masses of fish seen floating on river surfaces, contaminating the drinking water, Environment Minister Marina Silva said. “We have a very worrying situation. This record drought has disrupted river transport routes (dropping 30 cm / day) threatening food and water shortages, and a large fish mortality is already beginning.” This was the effect of a periodic El Niño mixing with changes in weather patterns brought by global warming. “We are seeing a collision of two phenomena, one natural which is El Niño and the other a phenomenon produced by humans, which is the change in the Earth’s temperature.” Worsened by climate change, this combination has caused drought not seen before in the Amazon and “is incomparably stronger and could happen more frequently.”

Feedback loops and tipping points are parts of an equation that determine the rate of acceleration in climate change.. Triggering these tipping points results in the CO2 stored in nature to be released. Though we do not know how much carbon is stored in nature, it would be reasonable to assume that the temperature could be pushed from 3 degrees to 6 degrees above pre-industrial levels. Humans cannot thrive above a rise of 1.5 degrees. Humans cannot survive if the temperature rises 6 degrees.

Climate Change Tipping Points

What you can do today. How to save the planet.

Climate Change: The End of Times

The Human Induced Climate Change Experiment

bookmark_border10% of Swiss Glaciers Melt

* As thawing accelerates, Swiss glaciers lost 10% of their volume in the past 2 years
* One glacier had to stop being measured because it disappeared
* The thaw is irreversible
* Much of Europe’s drinking water comes from the glaciers

“The acceleration is dramatic, with as much ice being lost in only two years as was the case between 1960 and 1990. The two extreme consecutive years have led to glacier tongues collapsing and the disappearance of many smaller glaciers,” the Swiss Academy of Sciences said.

The AP reported:
Swiss meteorologists reported in August that the zero-degree Celsius level — the altitude where water freezes — had risen to its highest level ever recorded, at nearly 5,300 meters (17,400 feet), which means that all the Swiss Alpine peaks faced temperatures above freezing.

Matthias Huss, head of the GLAMOS glacier monitoring center, said, “Glaciers are the ambassadors of climate change. They make it very clear what is happening out there because they respond in a very sensitive way to warming temperatures. The study underlines once again that there is big urgency to act now if you want to stabilize (the) climate, and if you want to save at least some of the glaciers.”

“And once we have destabilized ice sheets, there will be no stable coastline for centuries. I repeat: There will be no stable coastline for centuries. I apologize to the children,” said Sidd Mukherjee in the paper Longthaw.

Also see:

Climate Change: Rate of Acceleration Brouse and Mukherjee (2023)

Sea-level Rise Mukherjee and Brouse (2022 and 2023)

Climate Change: How Long Is “Ever”? Brouse (2023)

bookmark_borderCalifornia Homeowners Insurance Consider Climate Change Prices

California use to only allow a max of 7% increase a year on homeowners insurance… and only base premiums on past payouts on a property. Not anymore.

“California will let insurance companies consider climate change when setting their prices, the state’s chief regulator announced Thursday, a move aimed at preventing insurers from fleeing the state over fears of massive losses from wildfires and other natural disasters. The rule change could mean higher rates for homeowners who are already seeing dramatic increases. Eight insurance companies doing business in California have requested rate increases of at least 20% or higher this year, according to the California Department of Insurance,” AP news reported.

“Modernizing our insurance market is not going to be easy or happen overnight. We are in really unchartered territory and we must make difficult choices when the world is changing rapidly.” California Insurance Commissioner Ricardo Lara said.

“Insurers have advanced a very powerful argument that the past is not as good a predictor of the future as it used to be,” said Amy Bach, executive director of United Policyholders. “I think the (Insurance) department did what it needed to do to try to restore a viable market. We don’t have a viable market right now in this state in a lot of areas.”

Florida and Louisiana already have a homeowners insurance crisis with companies fleeing the states. The 9th National Risk Assessment for Homeowners Insurance found 1/4 of all homes in the nation are underpriced for climate risk insurance.

More articles on Flood Insurance, Rising Sea Levels and Global Warming.

bookmark_borderClimate Change: Insurance Risk

The 9th National Risk Assessment for Homeowners Insurance found climate risks place 39 million U.S. homes at risk of losing their insurance. “Sound pricing is going to make it unaffordable to live in certain places as climate impacts emerge.”

“There’s this climate insurance bubble out there,” said Jeremy Porter, the head of climate implications at First Street and a contributor to the report. “And you can quantify it.”

“There’s no education to the public of what’s going on and where the risk is,” said Porter, explaining that most insurance models are proprietary. Even the Federal Emergency Management Agency (FEMA) doesn’t make flood insurance pricing available to the public. Homeowners must obtain coverage through a private insurance broker for a quote.

Wildfires are the fastest growing natural disaster risk. According to the report, “It’s not just wildfires – pressure on flood and wind insurance is increasing, too.”

Porter went on to say, “You don’t want someone to live in a place that always burns. They don”t belong there. We’re subsidizing people to live in harm’s way. Large numbers of people will need to be relocated away from areas that will be uninsurable. There is a reckoning on the horizon and it’s not pretty.”

Flow Speeds

The burning of fossil fuels and other human released emissions have impacted momentum’s impact. A warmer atmosphere can hold more moisture. Warmer air allows for the creation of more massive raindrops. Warmer ocean temperatures create stronger hurricanes. Hail and tornadoes form in strong thunderstorm clouds with intense updrafts, high liquid-water content, and large water droplets.

Sidd added: It’s worse than that. Wind and water flow forces scale as the square of velocity, so as flow speeds increase (say due to more intense heating or heavier rain) the damage scales as the square of the velocity.

So a twenty mile an hour wind exerts four times as much force as a ten mile an hour wind. And a forty mile an hour wind exerts sixteen times as much force as a ten mile an hour wind. A wind of fifty miles an hour exerts twenty five times and a wind of sixty miles an hour exerts thirty six times as much force as one of ten miles an hour. Then you have the density term. Water is about eight hundred times denser than air, So the force exerted by a ten mile an hour flow of water is eight hundred times that of a ten mile an hour wind. So as flow velocities go up due to climate change, force and damage scale as square of the velocities. What is not clear is how much these velocities increase with climate change. But in a sense we are seeing this already as, for example, flood and sewage systems succumb and hillsides fall down, and so on.

Climate change’s influence on wind and water flow forces caused more severe damage and deaths. The Maui wildfire of August 2023 is an example. What would have been a fairly routine wildfire was fanned out-of-control by hurricane force winds. One headline read, “Maui fires: Hawaii blazes fanned by Hurricane Dora”. Another headline read, “Hawaii wildfires kill as ‘apocalypse’ hits Maui island”. The New York Times reported, “Gov. Josh Green of Hawaii said on Thursday that the devastating wildfires that swept through western Maui and killed at least 55 people, and possibly many more, were ‘likely the largest natural disaster in Hawaii state history.'”

Both wind and water flow forces contributed to the devastation. Hurricane Dora was at least 500 miles from Hawaii yet the wind forces impacted the fire in Maui. The winds were so strong that before the fire reached Lahaina extremely hot air blew over the town. The streets were so hot they burnt people’s feet trying to flee. The surface of everything became hot. Even after people jumped into the ocean, they said the debris in the water was too hot to float on. Almost all the boats in the harbor burned.

The blast of hot air over Lahaina created the conditions for a flashpoint. A flashpoint is the temperature at which a particular organic compound gives off sufficient vapor to ignite in air. The entire town ignited so quickly that warning sirens could not be activated and people did not have time to escape.

In an unexpected twist, water flow forces also contributed to the chaos. How could water flow add to the fire emergency conditions? When people fled the heat and fire, they jumped into the sea. ABC news reported: Shawn Dougherty, of Lahaina, was among the hundreds of residents forced to flee the resort city when the wildfire began engulfing their homes.

Like others, Dougherty said his only means of survival was to jump into the ocean with his girlfriend, but while some found safety in nearby jetties, the rocks and coral tore up Dougherty’s body.

“At one point, it seemed like I might drown,” he told ABC News. “{I’m a good swimmer, but the water was just really rough because of the wind and the turbulence.”

Norway Floods 2023

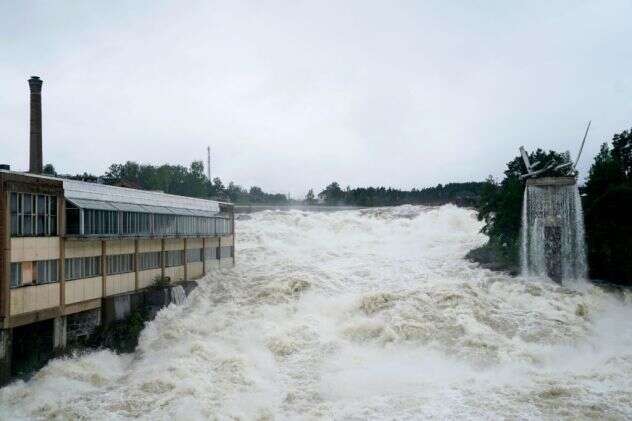
Also in August of 2023, climate change’s influence on water flow forces caused more severe damage and deaths. AccuWeather reported, “Dam bursts open as deadly flooding washes away homes in Norway. Torrents of water gushed through multiple towns across Norway and landslides cascaded down mountainsides after a deluge drenched Norway.”

Summary

By increasing the energy in the system, humans have increased flow volumes, masses and velocities leading to increased damage (and deaths.)

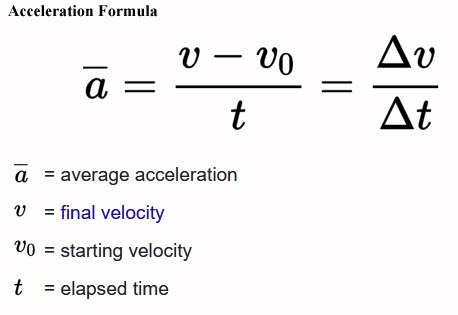
Newton’s second law: F = m * a
F = force
m = mass of an object
a = acceleration

Acceleration Formula

ALSO SEE
Climate Change: Rate of Acceleration
By 2020, there was enough data to see the “doubling period” of some anthropogenic climate affects had gone from 100 years to 10 years. For instance the rate of sea level rise has gone from about 1.5 millimeters per year to over 3 millimeters. We expect to see the doubling period to continue to shrink raising the possibility of sea levels rising a foot/year by 2050.

Tipping points and feedback loops are parts of an equation that determine the rate of acceleration in climate change.

Climate Change: The End of Times

More articles on Flood Insurance, Rising Sea Levels and Global Warming.

bookmark_borderInsurance, and the Lack Thereof

The Washington Post reported, “Home insurers cut natural disasters from policies as climate risks grow“.

“Allstate, American Family, Nationwide, Erie Insurance Group and Berkshire Hathaway — have told regulators that extreme weather patterns caused by climate change have led them to stop writing coverages in some regions, exclude protections from various weather events and raise monthly premiums and deductibles.”

“they will cut out damage caused by hurricanes, wind and hail from policies underwriting property along coastlines and in wildfire country”

“places once considered safe from natural catastrophes could lose crucial insurance protections while their natural disaster exposure expands or intensifies ”

“Allstate said its climate risk mitigation strategy would include “limiting new [auto and property] business … in areas most exposed to hurricanes” and “implementing tropical cyclone and/or wind/hail deductibles or exclusions where appropriate.””

“Nationwide said it no longer underwrites coverage for “properties within a certain distance to the coastline” because of hurricane potential.”

“There’s no place to hide from these severe natural disasters”

“a policy in a region afflicted by hurricanes may exclude coverage for wind or hail damage, or in wildfire country, a policy without fire and smoke protection.”

“Activity has been observed in recent years that has differed from historical norms or modeled expectations.”

More articles on Flood Insurance, Rising Sea Levels and Global Warming.

bookmark_borderClimate Change: Stranded on an Island

by Daniel Brouse

Climate change brings with it the inevitability of rising sea levels. Even if green house gas emissions were stopped completely, the sea will continue to rise for hundreds or thousands of years.

Not only will the submerged properties be affected by the rising tides, so will all the new island properties. Initially, some properties will just be temporarily cut-off from civilization. Eventually, those temporary islands will become permanent.

An initial reaction may be “Oh, I’ve always wanted to live on island;” however, being stranded on a deserted island is not fun. It is important to look forward and evaluate the risk in value to real estate. Much of the newly isolated land will become worthless.

ARS Technica reports, “having a property above water won’t be much good if flooding nearby means you can’t get to a hospital or grocery store when you need to or lose access to electricity or other services. It’s entirely possible for rising seas to leave a property high, dry, but uninhabitable as rising seas cut connections to essential services. A group of researchers has analyzed the risk of isolation driven by sea level rise, and shows it’s a major contributor to the future risks the US faces.”

If you’re interested in comparing the risk of isolation to that of inundation, the researchers built a website that lets you explore the risks under different sea level rise scenarios.

The Journal Nature published “Risk of isolation increases the expected burden from sea-level rise”:

The typical displacement metric for sea-level rise adaptation planning is property inundation. However, this metric may underestimate risk as it does not fully capture the wider cascading or indirect effects of sea-level rise. To address this, we propose complementing it by considering the risk of population isolation: those who may be cut off from essential services. We investigate the importance of this metric by comparing the number of people at risk from inundation to the number of people at risk from isolation. Considering inundated roadways during mean higher high water tides in the coastal United States shows, although highly spatially variable, that the increase across the United States varies between 30% and 90% and is several times higher in some states. We find that risk of isolation may occur decades sooner than risk of inundation. Both risk metrics provide critical information for evaluating adaptation options and giving priority to support for at-risk communities.

More articles on Flood Insurance, Rising Sea Levels and Global Warming.

bookmark_borderAntarctic Ice Sheet Is Melting at Accelerated Rate

The Word Economic Forum published the report The Antarctic ice sheet is melting. And this is bad news for humanity.

* The Antarctic ice sheet has been strongly decreasing since 2016.
* If left unchecked, the complete melting of the West Antarctic ice sheet would cause a global sea level increase of 3.3 metres in the future, says an expert.
* At present, the world is heading towards a warming of 2.8C by the end of this century.
* The Antarctic ice sheet will therefore continue to melt and contribute to sea level rise, which will test the adaptive capacity of humanity.

The consequences of the collapsing ice sheet
The sustained melting of the West Antarctic ice sheet could indicate that an unstable retreat (which reinforces itself) is underway or imminent. However, there is high uncertainty about this phenomenon.

The mechanism that would explain this unstable retreat is known as Marine Ice Sheet Instability.

If the bed, where the ice sheet lies, slopes down towards the interior, it destabilizes the position of the grounding line — zone where this ice sheet starts to float. The thinning of the ice shelf causes this grounding line to retreat, which leads to an influx of ice from the ice sheet to the sea. This, subsequently, causes the thinning of the ice shelf and so on and so forth.

The bottom line is that the melting of the Antarctic ice sheet contributes to and will continue to contribute to sea level rise for a long time, which will test the adaptive capacity of humanity.

The sea level increase by 2100 will particularly affect the tropical countries. And so, what happens in the Antarctic will definitely not stay in the Antarctic.

In February of 2023. the Copernicus Programme issued the repot Copernicus: Antarctic sea ice extent reaches all-time minimum in February – Second warmest winter on record in Europe.

February 2023 – temperature highlights:
* February 2023 was the fifth warmest globally
* Most of Europe had above-average air temperatures, particularly northern Norway and Sweden, and the Svalbard region
* Above-average temperatures occurred in the eastern United States, northern Russia, and in Pakistan and India
* Below-average temperatures were experienced across the Iberian Peninsula, Türkiye, the western United States, * Canada, northeast Russia, and northern Australia

February 2023 – Sea ice highlights:
* Antarctic sea ice reached its lowest monthly extent in the satellite data record, at 34% below the average for February, breaking the previous record of February 2017.
* Antarctic daily sea ice extent also reached an all-time minimum, surpassing the previous record set in February 2022.
* Sea ice concentrations were much below-average in all sectors of the Southern Ocean.
* Arctic sea ice extent was 4% below average, ranking 2nd lowest for February in the satellite data record, jointly with February 2016 and 2017.
* Arctic sea ice concentrations were most below-average in the Barents Sea and Svalbard region.

Sea-level Rise: Greenland and the Collapse of the Antarctic Ice Sheet

More articles on Flood Insurance, Extreme Weather Events, Rising Sea Levels and Global Warming