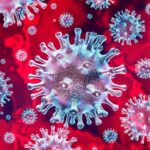
bookmark_borderAfter You Recover from COVID-19 Induced Secondary Pellagra (CISP) Long Haulers

Research by Ade Wentzel, Robert Miller, and Guy Richards has found COVID-long (Long Haulers Syndrome) is COVID-19 Induced Secondary Pellagra (CISP) and is a result of an NAD+ deficiency caused by COVID-19.

You can boost your NAD+ levels with the Anti-COVID Protocol: Niacin B3, Vitamin D, Vitamin C, Quercetin, Zinc, and Selenium

If you were NAD+ deficient prior to COVID and recovered using the Protocol, you should consult with your doctor about any preexisting conditions you were being treated for. If you were on drugs to help regulate your preexisting conditions, you may need to reduce your dosage. Perhaps someone on Lisinopril for high blood pressure, or Warfarin to thin their blood, or maybe Metformin for their type 2 diabetes, should have concern that replenishing your NAD+ will cause the medication to be too strong. You should check with your doctor about lowering your dosage.

Robert Miller said, “Metaformin is a complex 1 inhibitor that will mess with NAD+ redox and NAD+ levels. As for lowering doses, yes, NAD+ boosting is highly likely to create a need to lower some medication but this must be done with a medical professional.”

Ade Wentzel added, “Quercetin and Warfarin should be monitored as the Warfarin effect may be changed. Nicotinic acid can reduce blood pressure and blood sugar in those with raised numbers so this needs to be monitored carefully.”

MORE ON COVID: COVID-19 / SARS-CoV-2 / Novel Coronavirus

bookmark_borderCOVID-19 Induced Secondary Pellagra (CISP) and the Coronavirus Code

By Daniel Brouse
help@membrane.com

Coronavirus / COVID

Three scientists from South Africa have cracked the COVID code. COVID Long Haulers Syndrome is COVID Induced Secondary Pellagra (CISP).

By treating the population for pellagra:
* many new COVID cases can be prevented (prophylactic)
* the severity and duration of COVID symptoms can be reduced
* COVID-long Haulers Syndrome can be treated

THE PROTOCOL: Niacin B3, Vitamin D, Vitamin C, Quercetin, Zinc, Methyltetrahydrofolate, and Selenium.

The dosage depend on your Niacin B3 deficiency. COVID causes a Niacin deficiency. In addition, many people are deficient prior to contracting COVID. These cases often end in death (aged, hypertension, obese, and type2 diabetics.)

The following doses have treated severe niacin and NAD+ deficiencies in COVID-long cases:
* Vitamin C, Quercetin and Selenium you can get from your diet. Careful not too much Selenium. One (1) Brazil nut a day is adequate Selenium.
* The Vitamin D is best gotten from 15 minutes a day in the sun. You can take 1000iu/day supplement, too.
* A 15mg Zinc/day supplement. Care should be taken not to overdose on Zinc. There are many zinc products which deliver different amounts of free zinc per milligram.
* Methyltetrahydrofolate 130-400ug/day
* The Niacin is the trickiest and most important part. You need to make sure you get the right kind of B3. Non-flush is no good. You can start with 35mg/day, but it will depend on your deficiency. The treated long hauler takes 100-150mg with each meal. Supplementation is still necessary for an undetermined amount of time.

Niacin is the most important ingredient in the protocol. Niacin is used to replenish NAD+. The other ingredients can not be processed without NAD+. Taking mega doses of Vitamin C or Vitamin D are of little to no help without NAD+.

The protocol was developed by Dr. Ade Wentzel (Port Elizabeth, South Africa), Robert Miller (Cape Town) and Guy Richards (Johannesburg). They developed the diet based protocol as a result of their research COVID-19: NAD+ deficiency may predispose the aged, obese and type2 diabetics to mortality through its effect on SIRT1 activity.

This is not the first time the world has seen a pellagra epidemic. “In the early 1900s, pellagra reached epidemic proportions in the American South. Between 1906 and 1940 more than 3 million Americans were affected by pellagra with more than 100,000 deaths, yet the epidemic resolved itself right after dietary niacin fortification.” (Pellagra – Wikipedia)

In 2000, the World Health Organization developed an emergency management plan for pellagra.

WHO Pellagra Prevention and Control (PDF)

MORE ON COVID: COVID-19 / SARS-CoV-2 / Novel Coronavirus

bookmark_borderInterferons Interfere With Disease

by Daniel Brouse

An interferon is a protein released by animal cells, usually in response to the entry of a virus, which has the property of inhibiting virus replication. A natural substance that helps the body’s immune system fight infection and other diseases, such as cancer. Interferons are made in the body by white blood cells and other cells, but they can also be made in the laboratory to use as treatments for different diseases. In cancer therapy, interferons may help keep cancer cells from growing and may help kill cancer cells. There are three main types of interferons: interferon-alfa, interferon-beta, and interferon-gamma. An interferon is a type of cytokine and type of immunomodulating agent. [1]

Several new studies of immune response to SARS-CoV-2, the virus that causes the disease, suggest timing could be critical for interferons. These immune proteins suppress viral replication early in disease. Yet if they are active later, some scientists think they can exacerbate the harmful inflammation that forces some COVID-19 patients onto life support. Interferons are “a double-edged sword,” says immunologist Eui-Cheol Shin of the Korea Advanced Institute of Science and Technology. [2]

The timing of the creation and the implementation of interferons appears to be a critical part of the immune system. Synthetic interferons may do more harm than good. Synthesizing and synergizing interferons by the body may be a safe and effective way to boost the nonspecific immune system. It may also be a safe and effective way to boost the specific immune system.

Memory T cells are created when a naive T cell acquires the memory of an antigen. Acquired T cell responses are critical for the host’s defense against microbial pathogens. T cells, by the release of interferon-γ (IFN-γ), induce autophagy, phagosomal maturation, the production of antimicrobial peptides such as cathelicidin, and antimicrobial activity. There is a a mechanism in which vitamin D is required for acquired immunity to overcome the ability of intracellular pathogens to evade macrophage-mediated antimicrobial responses.[3]

While the inflammation generated by innate immune cells [neutrophils, macrophages, monocytes, natural killer (NK) cells, dendritic cells (DCs), etc.] is important in the initial containment of the infection, it also informs and directs the expansion and differentiation of adaptive immune cells. Responding to the inflammatory environment created by the innate response, cells of the adaptive arm of the immune response (B cells, αβ T cells, and γδ T cells) are stimulated to expand in number (proliferate) and to differentiate into cells with a range of functions appropriate for the immunological challenge.[4]

What is necessary for the creation and implementation of interferons?

The role of eating meat in your diet is not yet clearly known; however, animal proteins and amino acids obtained through eating meat likely play an important role in creating interferons. We do know that bacterium found in ruminant cattle (meat and milk) is essential for humans to make Vitamin D. [5] We also know that exposure of the skin to sunlight (UVB radiation) is required for the body to photosynthesize Vitamin D and create the photoproducts. Previtamin D3 and vitamin D3 also absorb UV B radiation and are converted into a variety of photoproducts some of which have unique biologic properties. [6]

“We’ve discovered a new component of the interferon system,” said Michael J. Holtzman, MD, the Selma and Herman Seldin Professor of Medicine. “It does something that other components don’t do, and it works on both sides of the fence: It dials up the body’s internal genes that fight viruses, and it attacks viral proteins directly.”

The researchers’ strategy did not involve increasing the amount of interferon, the first step of this important antiviral signaling cascade. Instead, it dialed up amounts of the protein STAT1, the second component of this cascade, without altering the system’s overall interferon on/off switch.

“Past work to boost this system just kept the interferon signal on all the time,” Holtzman said. “When the system is chronically activated, it is no longer regulated, and that’s where the autoimmune problems may come from. Our system is still regulated by the presence or absence of interferon. Interferon amounts increase when there is an infection and decrease when there is no infection. We’re not boosting interferon itself, but the secondary signal that interferon activates, which sets off the rest of the antiviral cascade. It’s like greasing the wheels. We’re not pushing the system any harder. But when we do push, we get a bigger effect.” [7]

COVID, Vitamin D, Health, and Wellness

Vitamin D, Sunlight, the Season, and People of Color

Your Immune System and Photosynthesized Vitamin D

1. Interferon National Cancer Institute
2. An Immune Protein Could Prevent Severe COVID-19—if It Is Given at the Right Time Scientific American
3. Vitamin D Is Required for IFN-γ–Mediated Antimicrobial Activity of Human Macrophages NIH
4. T cell responses: naïve to memory and everything in between NIH
5. Dr. Karl Kruszelnicki Podcast / Australian Broadcasting Corporation

6. Sunlight and Vitamin D NIH
7. Study reveals new, potent way to boost immunity and fight viruses​​​ Washington University in St.Louis

bookmark_borderOmnivores: About Your Immune System and COVID

By Daniel Brouse

Humans are omnivores. A human’s immune system is dependent on eating an omnivore’s diet. Your immune system is really a collaboration between many of your body’s systems, such as, neurological, respiratory, cardiovascular, and circulatory systems. The “health” of your immune system is dependent on your overall status, but more importantly, the ability of your immune system to respond to any given battle at a particular time.

COVID can cause damage to your organs directly during the fight. COVID can also cause damage to all your body’s systems. Post-COVID chronic ailments comprise both categories. Many COVID cases result in damage to the lungs, heart, kidneys, and brain. Many COVID cases also cause damage to your immune system. (eg Long Haulers Syndrome)

Diet and lifestyle choices are detrimental in both the immune system’s ability to fight individual battles, as well as, your immune system’s ability to survive the war.

THE BATTLE
When an infection starts attacking your body, your immune system starts a process involving most of your body’s systems including neurological, respiratory, cardiovascular, and circulatory systems. Your brain connects with command centers throughout your body. The power supply for these command centers is called NAD+

The timing and locations of the battles are crucial for victory. Your command centers deploy Trojan horses to the nearest fight. The Trojan horses come in a variety of different breeds but are commonly called interferons. The interferons are unique antiviral proteins. They are part of the process that invades the infection, gets inside, steals the memory. Then, the interferon creates more protein. The proteins prevent the virus from multiplying. To help you win the war, the memory of the virus is then transferred to your central intelligence agency and used in your antibody production including T-cells and B-cells.

Your immunity factory needs a bunch of supplies to metabolize in order to win. It is critical that your body make and distribute the supplies to the immune factory assembly line. Supplements may be substituted in an emergency, but supplements can not replace your assembly line. You need to consume plants, animals, O2, H20, and sunlight. Time is of the essence.

WINNING THE BATTLE AGAINST COVID
The simplest strategy to defeat COVID is to consume Niacin (B3) and photosynthesized Vitamin D (sunlight).

Niacin is crucial for the production of your command centers — Nicotinamide adenine dinucleotide (NAD+)

Sunlight is crucial for the production of your interferons. The photosynthesis of Vitamin D produces the Vitamin D you need, but more important for this battle is the timing of the unique photoproducts that are also created in the photosynthesis process — interferons. The interferons need to be deployed rapidly to the exact location of the intruder. In the end, interferons are meat proteins consumed by your immune system. The role of eating meat in your diet is not yet clearly known; however, animal proteins and amino acids obtained through eating meat likely play an important role. We do know that bacterium found in ruminant cattle (meat and milk) is essential for humans to make Vitamin D.

CONCLUSION
To help prevent catching COVID, to help fight COVID, and/or to recover from post-COVID, Niacin and the photosynthesis of Vitamin D are the simplest protocol.

bookmark_borderIs Oxygen A Carcinogen?

There are some people that believe in a fluoride conspiracy. They take out all the minerals (elements) in their drinking water because they have a fluoride-phobia.

Fluoride is naturally present in the food and drink we consume and is considered a normal constituent of the human body. The fluoride concentration in bones and teeth is about 10,000 times that in body fluids and soft tissues. Fluoride is ingested from several sources including foods, fluoridated and unfluoridated water, fluoridated toothpastes and some dietary supplements. (NIH 2017)

Recommended fluoride intake.

Moderation is the key. Not enough fluoride and you’ll have weak teeth and bones. Too much fluoride can kill you. Did you know that too much oxygen can kill you, too?

NIH
Med Hypotheses. 1983 Sep;12(1):55-60.
Oxygen: our major carcinogen?
Evidence has accumulated implicating that atmospheric oxygen can be considered as an important environmental mutagen, whose action can be potentiated by a variety of environmental factors. Under normal conditions oxygen genotoxicity is largely prevented by a cellular antioxygenic defense system, which must be extremely efficient, but might not be entirely safe. A better understanding of this defense system may help to suggest how the incidence of carcinogenesis can be minimized.

Science News
from research organizations
Can inhaled oxygen cause cancer?
Date: January 13, 2015
Source: PeerJ
Summary:
The ancient physician/alchemist, Paracelsus, said: ‘The dose makes the poison.’ According to a new study, even oxygen may fall prey to the above adage. While essential to human life, aspects of oxygen metabolism may promote cancer. Capitalizing on the inverse relationship of oxygen concentration with elevation, researchers found lower rates of lung cancer at higher elevations, a trend that did not extend to non-respiratory cancers, suggesting that carcinogen exposure occurs via inhalation.

Oxygen toxicity
From Wikipedia, the free encyclopedia Oxygen toxicity is a condition resulting from the harmful effects of breathing molecular oxygen (O2) at increased partial pressures. It is also known as oxygen toxicity syndrome, oxygen intoxication, and oxygen poisoning. Historically, the central nervous system condition was called the Paul Bert effect, and the pulmonary condition the Lorrain Smith effect, after the researchers who pioneered its discovery and description in the late 19th century. Severe cases can result in cell damage and death, with effects most often seen in the central nervous system, lungs and eyes. Oxygen toxicity is a concern for underwater divers, those on high concentrations of supplemental oxygen (particularly premature babies), and those undergoing hyperbaric oxygen therapy.

You can also consume too much water — drowning. Listen to your body for the happy medium.

bookmark_borderDiet And Global Warming

For quite some time, the scientific consensus has been eating meat is worse for the environment than being a vegetarian; however, a new study found a very different result. Lettuce is “over three times worse in greenhouse gas emissions than eating bacon,” according to researchers from the Carnegie Mellon University.

Paul Fischbeck, study co-author and CMU’s professor of social and decisions sciences, said: “Lots of common vegetables require more resources per calorie than you would think. Eggplant, celery and cucumbers look particularly bad when compared to pork or chicken.”

bookmark_borderWhy Do Vegaterians Seem Brain Damaged?

By Daniel Brouse

“Vegans eat only food of plant origin. Because animal products are the only food sources of vitamin B12, vegans must supplement their diets with a source of this vitamin.” — USDA

Lack of B12 and amino acids results in neurological disorders. (eg Brain Damage)

“Also, the vegan diet is a poor choice for growing children. The process of neurodevelopment requires many things. One of those things is cholesterol. It is involved in the myelin sheath. As adults, we make as much, or even more than we need. As children are actively growing myelin, they need more than they can produce. For those infants still nursing, they get it from Mom. Once weened, they need a source for cholesterol. There is no vegetable source of cholesterol. Denying animal-based foods will have a significantly detrimental impact on a growing child’s neurodevelopment,” added Seth Glass.

More from Humans Are Omnivores

bookmark_borderVegetarians Are Less Healthy

A new study had concluded that vegetarians are less healthy than omnivores:

Nutrition and Health – The Association between Eating Behavior and Various Health Parameters: A Matched Sample Study

Nathalie T. Burkert*, Johanna Muckenhuber, Franziska Großschadl, Eva Rasky, Wolfgang Freidl

Institute of Social Medicine and Epidemiology, Medical University Graz, Graz, Austria

Abstract

Population-based studies have consistently shown that our diet has an influence on health. Therefore, the aim of our study was to analyze differences between different dietary habit groups in terms of health-related variables. The sample used for this cross-sectional study was taken from the Austrian Health Interview Survey AT-HIS 2006/07. In a first step, subjects were matched according to their age, sex, and socioeconomic status (SES). After matching, the total number of subjects included in the analysis was 1320 (N = 330 for each form of diet – vegetarian, carnivorous diet rich in fruits and vegetables, carnivorous diet less rich in meat, and carnivorous diet rich in meat). Analyses of variance were conducted controlling for lifestyle factors in the following domains: health (self-assessed health, impairment, number of chronic conditions, vascular risk), health care (medical treatment, vaccinations, preventive check-ups), and quality of life. In addition, differences concerning the presence of 18 chronic conditions were analyzed by means of Chi-square tests. Overall, 76.4% of all subjects were female. 40.0% of the individuals were younger than 30 years, 35.4% between 30 and 49 years, and 24.0% older than 50 years. 30.3% of the subjects had a low SES, 48.8% a middle one, and 20.9% had a high SES. Our results revealed that a vegetarian diet is related to a lower BMI and less frequent alcohol consumption. Moreover, our results showed that a vegetarian diet is associated with poorer health (higher incidences of cancer, allergies, and mental health disorders), a higher need for health care, and poorer quality of life. Therefore, public health programs are needed in order to reduce the health risk due to nutritional factors.

Citation: Burkert NT, Muckenhuber J, Großschadl¨ F, Rasky´ ´
E, Freidl W (2014) Nutrition and Health – The Association between Eating Behavior and Various Health
Parameters: A Matched Sample Study. PLoS ONE 9(2): e88278. doi:10.1371/journal.pone.0088278

Editor: Olga Y. Gorlova, Geisel School of Medicine at Dartmouth College, United States of America

Received May 17, 2013; Accepted January 9, 2014; Published February 7, 2014

Copyright: 2014 Burkert et al. This is an open-access article distributed under the terms of the Creative Commons Attribution License, which permits unrestricted use, distribution, and reproduction in any medium, provided the original author and source are credited.

Funding: The authors have no support or funding to report.

Competing Interests: The authors have declared that no competing interests exist. * E-mail: nathalie.burkert@medunigraz.at

Introduction

Our diet has an impact on our well-being and on our health. Studies have shown a vegetarian diet to be associated with a lower incidence of hypertension, cholesterol problems, some chronic degenerative diseases, coronary artery disease, type II diabetes, gallstones, stroke, and certain cancers [1–7]. A vegetarian diet is characterized by a low consumption of saturated fat and cholesterol, due to a higher intake of fruits, vegetables and whole-grain products [3,4,8]. Overall, vegetarians have a lower body mass index [1,4,5,7,9–12], a higher socioeconomic status [13], and better health behavior, i.e. they are more physically active, drink less alcohol, and smoke less [9,13,14]. On the other hand, the mental health effects of a vegetarian diet or a Mediterranean diet rich in fruits, vegetables, whole-grain products and fish are divergent [9,15]. For example, Michalak et al. [16] report that a vegetarian diet is associated with an elevated prevalence of mental disorders. A poor meat intake has been shown to be associated with lower mortality rates and higher life expectancy [17], and a diet which allows small amounts of red meat, fish and dairy products seems to be associated with a reduced risk of coronary heart disease as well as type 2 diabetes [18]. Additionally, evidence concerning lower rates of cancer,

colon diseases including colon cancer, abdominal complaints, and all-cause mortality is, however, inconsistent [5–7,19–22].

Not only is the intake of certain nutrients, like red meat, associated with an increased health risk [18,23–26],high-caloric intake also plays a crucial role [23,27]. Moreover, there seems to be proof that lifestyle factors like physical activity may be more crucial in lowering disease rates than individual dietary habits [20,28–29]. While, generally speaking, diets based on plants, like vegetarian diets, seem to be associated with a certain health benefit, a lower risk to contract certain chronic diseases [30], and the ability to improve health [31–32], restrictive and monotonous vegetarian diets include the risk of nutritional deficits [2,18,19,30,33]. Baines et al. [9] report that vegetarians take more medication than non-vegetarians.

To summarize, a number of studies have shown vegetarian diets and diets with poor meat intake to be associated with lower mortality rates for certain diseases. Research about the dietary habits in Austria is, however, rather sparse and mainly focused on genetic factors [33–36]. Therefore, the aim of this study was to investigate health differences between different dietary habit groups among Austrian adults.

Methods

Study Design and Study Population

The sample for this cross-sectional study was taken from the Austrian Health Interview Survey (AT-HIS) which ran from March 2006 to February 2007 [37]. The AT-HIS is a standardized survey which is conducted at regular intervals in Austria (currently every eight years). The subjects included in the survey form a representative sample of the Austrian population. They were chosen from the central population register and are distributed across the different geographic regions of Austria. The AT-HIS is part of the European Health Interview Survey (E-HIS; http://www.euhsid.org), an important high-quality survey. The interviews were conducted by free-lancers engaged by the Austrian Statistic Agency. To ensure that all interviews were conducted in the same way, interviewers had to participate in a training day where they were instructed on how to conduct the survey. Time measurement, non-response analyses, and analyses of error dialogs were performed in order to ensure consistency between interview- ers. Additionally, all interviewers were supervised by field supervisors. Overall, 15474 individuals, aged 15 years and older, were questioned in computer-assisted personal interviews (CAPI; 54.7% female; response rate: 63.1%).

While 0.2% of the interviewees were pure vegetarians (57.7% female), 0.8% reported to be vegetarians consuming milk and eggs (77.3% female), and 1.2% to be vegetarians consuming fish and/ or eggs and milk (76.7% female). 23.6% reported to combine a carnivorous diet with lots of fruits and vegetables (67.2% female), 48.5% to eat a carnivorous diet less rich in meat (60.8% female), and 25.7% a carnivorous diet rich in meat (30.1% female). Since the three vegetarian diet groups included a rather small number of persons (N = 343), they were analyzed as one dietary habit group. Moreover, since the vegetarian group was the smallest, we decided to match each of the vegetarians (1) with an individual of each other dietary habit group (carnivorous diet rich in fruits and vegetables (2), carnivorous diet less rich in meat (3) and a carnivorous rich in meat (4)).

Matching Process

In a first step, subjects consuming a vegetarian diet were identified (N = 343). All vegetarians were categorized according to their sex, age (in age-groups spanning 5 years, e.g. 20- to 24-year- olds), and socioeconomic status (SES). Each such vegetarian was then matched with one subject consuming a carnivorous diet rich in fruits and vegetables, one individual eating a carnivorous diet less rich in meat, and one subject consuming a carnivorous diet rich in meat. Only 96.2% of the vegetarians were included in the analyses, since not all of them corresponded to a subject of the same sex, age, and SES from a different dietary habit group. Therefore, the total number of analyzed subjects was 1320 (comprising 330 vegetarians, 330 subjects consuming a carnivo- rous diet rich in fruits and vegetables, 330 individuals eating a carnivorous diet less rich in meat, and 330 subjects consuming a carnivorous diet rich in meat). Each dietary habit group was set-up according to the demographic characteristics shown in Table 1.

Ethical Approval

The study was carried out in compliance with the principles laid down in the Helsinki Declaration. No minors or children were included in the study. Verbal informed consent was obtained from all subjects, witnessed, and formally recorded. The Ethics Committee of the Medical University of Graz approved the consent procedure as well as the conductance of this study (EK- number: 24–288 ex11/12).

The Association between Nutrition and Health

Table 1. Data definition and structure for each of the four dietary habit groups.

Age Sex TOTAL
men women
SES N N N %
15–19 Low 3 22 25 7.6%
Middle 9 19 28 8.5%
High 0 1 1 0.3%
20–29 Low 4 11 15 4.5%
Middle 10 35 45 13.6%
High 5 13 18 5.4%
30–39 Low 3 10 13 3.9%
Middle 6 23 29 8.8%
High 6 11 17 5.2%
40–49 Low 4 6 10 3.0%
Middle 4 20 24 7.3%
High 8 16 24 7.3%
50–59 Low 3 7 10 3.0%
Middle 3 11 14 4.2%
High 1 6 7 2.1%
60–69 Low 3 7 10 3.0%
Middle 1 14 15 4.5%
High 0 2 2 0.6%
70–79 Low 4 8 12 3.6%
Middle 1 2 3 0.9%
High 0 0 0 0.0%
80+ Low 0 5 5 1.5%
Middle 0 3 3 0.9%
High 0 0 0 0.0%
TOTAL Low 24 76 100 30.3%
Middle 34 127 161 48.8%
High 20 49 69 20.9%
TOTAL 78 252 330 100.0%

Note. Data source: Austrian Health Interview Survey (AT-HIS) 2006/07.

N = number of subjects. Analyses were calculated with subjects matched according to their age, sex, and socio-economic status. Each dietary habit group consisted of 330 subjects with the above shown demographic characteristics (330 vegetarians, 330 subjects consuming a carnivorous diet rich in fruits and vegetables, 330 individuals eating a carnivorous diet less rich in meat, and 330 subjects consuming a carnivorous diet rich in meat; N = 1320). SES: A low SES corresponds a SES score between $3 and #6, a middle SES between .6 and # 10, and a high SES a score between .10 and #15. doi:10.1371/journal.pone.0088278.t001

Variables and Measurements

Face-to-face interviews were conducted by questioning the subjects about their socio-demographic characteristics, health- related behavior, diseases, medical treatments, and also psycho- logical aspects.

The independent variable in this study was the dietary habit of individuals. Concerning eating behavior, the respondents were given a list of six different dietary habits and asked which one describes their eating behavior best (1 = vegan, 2 = vegetarian eating milk/eggs, 3 = vegetarian eating fish and/or milk/eggs, 4 = carnivorous diet rich in fruits and vegetables, 5 = carnivorous diet less rich in meat, 6 = carnivorous diet rich in meat).

PLOS ONE | www.plosone.org 2 February 2014 | Volume 9 | Issue 2 | e88278

Participants described their dietary habit, without interviewers giving a clear definition of the various eating categories. Since, overall, only 2.2% of all participants consumed a vegetarian diet, these individuals were analyzed as one dietary habit group. We created a scale that would reflect the animal fat intake for each dietary habit (1 = vegetarian diet, 2 = carnivorous diet rich in fruits and vegetables, 3 = carnivorous diet less rich in meat, 4 = carniv- orous diet rich in meat).

Since age, sex, and the socioeconomic background of subjects all have an influence on health [38–41], we matched the subjects according to these variables in order to control for their influence. The SES of the subjects (ranging between 3 and 15) was calculated using the following variables: net equivalent income, level of education, and occupation. Net equivalent income was calculated based on an equivalence scale provided by the OECD [42], and divided by quintiles. Level of education was measured by an ordinal variable, distinguishing between (1) basic education (up to 15 years of age), (2) apprenticeship/vocational school, (3) secondary education without diploma, (4) secondary education with diploma, and (5) university education. The occupation of the subjects was differentiated into the following five levels: (1) unskilled worker, (2) apprentice/skilled worker, (3) self-em- ployed/middle job, (4) qualified job/academic, (5) executive position. To verify the combination of variables that served to calculate the SES, correlations with the different variables were calculated. They ranged between r = .70 and r = .80.

The body mass index (BMI) and lifestyle factors (physical activity, smoking, and alcohol consumption) were included as covariates in all analyses. The BMI was calculated by dividing the weight of a person in kilograms by the square of their height in meters (kg/m2) [43]. Physical exercise was measured using the short version of the International Physical Activity Questionnaire (IPAQ), a self-reported instrument, which asks for an estimate of the total weekly physical activity (walking, moderate- and vigorous-intensity activity) performed during the last week. The short version of the IPAQ does not discriminate between leisure- time and non-leisure time physical activity. The total MET score was calculated by weighting the reported minutes per week within each activity by a MET energy expenditure estimate that was assigned to each category [44]. Smoking behavior was measured as the number of cigarettes smoked per day. Alcohol consumption was surveyed as the number of days on which alcohol was consumed during the last 28 days.

The dependent variables focusing on ill-health included self- perceived health, ranging from 1 (very good) to 5 (very bad), and impairment to health, ranging from 1 (very impaired) to 3 (not impaired). We further assessed the presence of 18 specific chronic conditions (asthma, allergies, diabetes, cataract, tinnitus, hyper- tension, cardiac infarction, apoplectic stroke, bronchitis, arthritis, sacrospinal complaints, osteoporosis, urinary incontinence, gastric or intestinal ulcer, cancer, migraine, mental illness (anxiety disorder or depression), and any other chronic condition). Each condition was coded as present (1) or absent (0). We calculated a total frequency score by summing up the chronic conditions present (0–18, sum index). Additionally, a vascular risk score was calculated by summing up the variables ‘‘hypertension’’, ‘‘en- hanced blood cholesterol level’’, ‘‘diabetes’’, and ‘‘smoking’’ (0–4, sum index). Each variable was coded as present (1) or absent (0).

A dependent variable concerning health care was created as the sum index of the number of doctors consulted in the last 12 months (0–8, sum index). Each of the 8 medical treatments (general practitioner, gynecologist, urologist, dermatologist, oph- thalmologist, internist, orthopedist, and ENT physician) was coded as ‘‘consulted’’ (1) or ‘‘not consulted’’ (0). The number of

The Association between Nutrition and Health

andsex,age,socio-economic 28lastthedays) (N = 1320).
meatin p-value .000 .000 .002 .000 .150 .000 .003 .005 .033
3 4 4 4 4 3 4 4 4
carnivorous diet rich SD 0.87 0.61 1.60 0.73 1.22 2.13 1.05 withsubjects matched according to their which alcohol was consumed during
N= 330 M 1.57 2.73 1.03 1.98 1.60 3.61 1.26
habitdietarydifferentthebetweengroups. carnivorousdiet rich in fruits carnivorous diet less vegetablesand330=NvegetarianN = 330 rich in meat N = 330 MSDM SD M SD 1.500.941.78 0.90 1.46 0.87 2.710.662.62 0.62 2.72 0.59 1.001.601.29 1.64 0.92 1.29 1.960.742.02 0.75 2.01 0.71 1.681.331.69 1.27 1.43 1.02 3.652.283.22 2.15 3.59 2.02 1.391.071.25 1.07 1.29 1.07 Ndeviation,standard=SDmean,=M2006/07.= number of subjects, p = probability.
results,better day),percigarettesof(numberbehaviorsmokingand alcohol consumption (number of days on
calculatedcomparison.univariateresultAnalyseswereof
4
multivariate test result,
3
carehealthandhealthinDifferences2.Table Measure Health generallyhealthreported-Self Impairment conditionsChronic riskVascular careHealth doctor)thetovisitsof(numbertreatmentsMedical vaccinationsofNumber healthpreventiveofNumber usedofferscare HIS)-(ATSurveyInterviewHealthAustriansource:DataNote. 1 score),MET(totalactivityphysicalBMI,forcontrollingstatus doi:10.1371/journal.pone.0088278.t002
1 means
a higher score
2
1 results,
2 worse
1 2 means
2 1 score
a higher
PLOS ONE | www.plosone.org 3 February 2014 | Volume 9 | Issue 2 | e88278

The Association between Nutrition and Health

Table 3. Differences in suffering from various chronic conditions between the different dietary habit groups.

Carnivorous diet rich in Carnivorous diet less Carnivorous diet
Chronic condition Vegetarian fruits and vegetables rich in meat rich in meat p-value (x2)
Asthma 4.8% 3.3% 3.9% 4.5% .772
Allergies 30.6% 18.2% 20.3% 16.7% .000
Diabetes 2.7% 4.2% 2.4% 2.4% .455
Cataract 4.2% 3.0% 3.3% 1.8% .348
Tinnitus 4.8% 4.8% 4.8% 3.6% .840
Hypertension 11.5% 10.6% 12.4% 15.5% .260
Cardiac infarction 1.5% 1.5% 0.9% 0.6% .610
Apoplectic stroke 1.2% 1.8% 1.5% 1.8% .610
Bronchitis 3.9% 3.6% 2.4% 3.0% .701
Arthritis 8.5% 7.6% 8.8% 10.3% .662
Sacrospinal complaints 26.7% 24.8% 18.2% 23.9% .060
Osteoporosis 6.4% 4.8% 3.6% 5.8% .415
Urinary incontinence 2.1% 3.9% 2.7% 6.4% .023
Gastric or intestinal ulcer 4.2% 4.2% 1.5% 3.6% .169
Cancer 4.8% 3.3% 1.2% 1.8% .022
Migraine 15.8% 11.8% 9.1% 12.1% .074
Mental illness (anxiety 9.4% 4.8% 5.8% 4.5% .036
disorder or depression)
Any other chronic conditions 8.8% 5.5% 5.8% 6.7% .308

Note. Data source: Austrian Health Interview Survey (AT-HIS) 2006/07. Percentage of subjects suffering from the different chronic conditions. p (x2): probability value of Chi-Square-Test. Analyses were calculated with subjects matched according to their age, sex, and socio-economic status (N = 1320). doi:10.1371/journal.pone.0088278.t003

vaccinations was analyzed by calculating a sum index combining 8 different vaccinations (influenza, tetanus, diphtheria, polio, FSME, pneumococci, hepatitis A and B; 0–8, sum index). Each vaccination was coded as present (1) or absent (0). In addition, preventive health care was analyzed by calculating a sum index of the variables ‘‘preventive check-ups’’, ‘‘mammography’’, ‘‘prostate gland check-up’’, and ‘‘Papanicolaou test’’ (0–4, sum index). Each variable was coded as present (1) or absent (0).

The dependent variable concerning quality of life was measured using the short version of the WHOQOL (WHOQOL-BREF) [45]. Four domain scores (physical health, psychological health, social relationships, and environment) were calculated. These domain scores ranged between 4 and 20.

Statistical Analysis

In a first step subjects with different dietary habits (vegetarian, carnivorous diet rich in fruits and vegetables, carnivorous diet less rich in meat, carnivorous diet rich in meat) were matched according to their sex, age, and SES. Differences in lifestyle factors (BMI, total MET score, number of cigarettes smoked per day, and alcohol consumption in the last four weeks) between the different dietary habit groups were calculated by multivariate analysis of variance.

In order to analyze the differences between the dietary habit groups, multivariate analyses of variance were calculated for the three domains: (1) health (self-reported health, impairment due to health problems, number of chronic conditions, vascular risk), (2) health care (number of visits to the doctor, number of vaccinations, number of used preventive care offers), and (3) quality of life (physical and psychological health, social relation- ships, and environment). To address the bias of lifestyle factors impacting health, analyses of variance were calculated, controlling

for the aforementioned lifestyle variables (BMI, physical activity, smoking behavior, and alcohol consumption).

In the domain of ‘‘health’’, the two variables ‘‘self-reported health’’ and ‘‘impairment due to health problems’’ were originally assessed using an ordinal scale. Therefore, we controlled the results using non-parametric tests (Kruskal Wallis Test). Since the results were the same, only results of the analyses of variance are reported.

In addition, Chi-square tests were calculated for the aforemen- tioned 18 chronic conditions in order to establish which one occurs significantly more often, depending on the form of nutrition. p- values ,.050 were considered as statistically significant. All analyses were calculated using IBM SPSS software (version 20.0) for Windows.

Results

Participant Characteristics and Lifestyle Differences between the Dietary Habit Groups

In total, we analyzed the data of 1320 individuals (330 in each dietary habit group). Each dietary habit group was set-up according to the demographic characteristics shown in Table 1. Overall, 23.6% of all subjects were male and 76.4% female. 40.0% of the individuals were younger than 30 years, 17.8% between 30 and 39 years, 17.6% between 40 and 49 years, 9.4% between 50 and 59 years, 8.4% between 60 and 69 years, 4.4% between 70 and 79 years, and 2.4% than 80 years or older. 30.3% of the subjects had a low SES (they had an SES score of #6), 48.8% a middle one (SES between .6 and #10), and 20.9% had a high SES (SES.10).

Our multivariate analysis regarding lifestyle showed a significant main effect for the dietary habit of individuals (p = .000), showing

PLOS ONE | www.plosone.org 4 February 2014 | Volume 9 | Issue 2 | e88278

that the different dietary habit groups differ in their overall health behavior. However, results of the univariate analyses showed that the dietary habit groups only differ concerning their BMI and their alcohol consumption.

Concerning BMI: vegetarians have the lowest mean BMI (M = 22.9), followed by subjects eating a carnivorous diet less rich in meat (M = 23.4), rich in fruits and vegetables (M = 23.5), and rich in meat (M = 24.9). Heavy meat eaters differ significantly from all other groups in terms of their BMI (p = .000).

Concerning physical exercise: no significant difference was found in the total MET score between the various dietary habit groups (p = .631).

Concerning smoking behavior: the number of cigarettes smoked per day did not differ between the various dietary habit groups (p = .302).

Concerning alcohol consumption: Subjects following a vegetar- ian diet (M = 2.6 days in the last 28 days) or a carnivorous diet rich in fruits and vegetables (M = 3.0 days) consume alcohol signifi- cantly less frequently than those eating a carnivorous diet less rich in meat (M = 4.4 days) or rich in meat (M = 4.8 days; p = .000).

Health Differences between the Dietary Habit Groups

In the domain of health, the multivariate analysis of variance showed a significant main effect for the dietary habit of individuals (p = .000). Overall, vegetarians are in a poorer state of health compared to the other dietary habit groups. Concerning self- reported health, vegetarians differ significantly from each of the other groups, toward poorer health (p = 000). Moreover, these subjects report higher levels of impairment from disorders (p = .002). Vegetarians additionally report more chronic diseases than those eating a carnivorous diet less rich in meat (p = .000; Table 2). Significantly more vegetarians suffer from allergies, cancer, and mental health ailments (anxiety, or depression) than the other dietary habit groups (Table 3). Subjects who eat a carnivorous diet rich in meat more often report urinary incontinence (p = .023). No differences between individuals consuming different forms of diet were found regarding their vascular risk (p = .150; Table 2).

Differences in Health Care between the Dietary Habit Groups

Our multivariate analysis regarding health care has shown a significant main effect for dietary habits (p = .000) and confirmed that, overall, subjects with a lower animal fat intake demonstrate worse health care practices. Vegetarians and subjects eating a carnivorous diet rich in fruits and vegetables consult doctors more often than those eating a carnivorous diet less rich in meat (p = .003). Moreover, vegetarians are vaccinated less often than all other dietary habit groups (p = .005) and make use of preventive check-ups less frequently than subjects eating a carnivorous diet rich in fruits and vegetables (p = .033; Table 2).

Differences in Quality of Life between the Dietary Habit Groups

Regarding quality of life, the main effect of the multivariate analysis of variance showed no significant difference between the dietary habit groups (p = .291). The results obtained in the univariate analyses of variance, however, revealed that vegetarians have a lower quality of life in the domains of ‘‘physical health’’ (p = .026) and ‘‘environment’’ (p = .037) than subjects consuming a carnivorous diet less rich in meat. Moreover, vegetarians have a lower quality of life regarding ‘‘social relationships’’ than individuals eating a carnivorous diet rich in fruits and vegetables,

The Association between Nutrition and Health

value-p .291 .026 .116 .043 .037 BMI,forphysical
2 3 3 3 3
carnivorous diet rich in meat SD 2.86 2.24 16.88 2.63 16.45 2.08 sex, and socio-economic status controlling
N= 330 M 17.40 16.66 last 28 days) (N = 1320).
carnivorous diet less rich in M SD 2.90 2.33 16.96 2.38 16.56 1.98 subjects matched according to their age, alcohol was consumed during the
meat N = 330 17.68 16.88 p = probability.
dietarydifferentthebetweenlife habit groups. carnivorous diet rich in fruits 330=Nvegetarianand vegetables N = 330 SDM M SD 3.2617.16 17.52 2.95 2.7416.50 16.75 2.42 2.8216.59 16.99 2.49 2.2616.16 16.44 2.11
mean.=M2006/07.HIS)-(ATSurveySD = standard deviation. N = numbersubjects.of result,testmultivariate andday),percigarettesof(numberalcohol consumption (number of dayswhichon
result ofcomparison.univariatecalculatedAnalyseswerewith
3
qualityinDifferences4.Tableof Measure lifeofQuality healthphysicalWHOQOL healthpsychologicalWHOQOL relationshipssocialWHOQOL environmentWHOQOL InterviewHealthAustriansource:DataNote. 1 behaviorsmokingscore),MET(totalactivity doi:10.1371/journal.pone.0088278.t004
2
1 1 results,
1 1 better
a higher score means
PLOS ONE | www.plosone.org 5 February 2014 | Volume 9 | Issue 2 | e88278

or those with a carnivorous diet less rich in meat (p = .043). All results are shown in Table 4.

Discussion

Overall, our findings reveal that vegetarians report poorer health, follow medical treatment more frequently, have worse preventive health care practices, and have a lower quality of life. Concerning the variable ‘‘eating behavior’’, we tried to generate a variable that would reflect the animal fat intake (1 = vegetarian, 2 = carnivorous diet rich in fruits and vegetables, 3 = carnivorous diet less rich in meat, 4 = carnivorous diet rich in meat). The mean BMI of subjects is coupled in nearly linear progression with the amount of animal fat intake. This is in line with previous studies showing vegetarians to have a lower body mass index [1,4,5,7,9– 12].

Our results have shown that vegetarians report chronic conditions and poorer subjective health more frequently. This might indicate that the vegetarians in our study consume this form of diet as a consequence of their disorders, since a vegetarian diet is often recommended as a method to manage weight [10] and health [46]. Unfortunately, food intake was not measured in more detail, e.g. caloric intake was not covered. Hence, further studies will be necessary to analyze health and its relationship with different forms of dietary habits in more detail.

When analyzing the frequency of chronic diseases, we found significantly higher cancer incidence rates in vegetarians than in subjects with other dietary habits. This is in line with previous findings, reporting that evidence about cancer rates, abdominal complaints, and all-cause mortality in vegetarians is rather inconsistent [5–7,19–22]. The higher cancer incidence in vege- tarians in our study might be a coincidence, and is possibly related to factors other than the general amount of animal fat intake, such as health-conscious behavior, since no differences were found regarding smoking behavior and physical activity in Austrian adults as reported in other studies for other countries [9,13,14]. Therefore, further studies will be required in Austria in order to analyze the incidence of different types of cancer and their association with nutritional factors in more depth.

Several studies have shown the mental health effects of a vegetarian diet to be divergent [9,15,16]. Vegetarians in our study suffer significantly more often from anxiety disorder and/or depression. Additionally, they have a poorer quality of life in terms of physical health, social relationships, and environmental factors.

Moreover, the use of health care differs significantly between the dietary habit groups in our study. Vegetarians need more medical treatment than subjects following another form of diet. However, this might be due to the number of chronic conditions, which is higher in subjects with a vegetarian diet.

Among the strengths of our study are: the large sample size, the matching according to age, sex, and socioeconomic background, and

References

1.American Dietetic Association, Dietitians of Canada (2003) Position of the American Dietetic Association and Dietitians of Canada: vegetarian diets. Can J Diet Pract Res 64(2): 62–81.

2.Craig WJ (2009) Health effects of vegan diets. Am J Clin Nutr 89(5): 1627s– 1633s.

3.Craig WJ (2010) Nutrition concerns and health effects of vegetarian diets. Nutr Clin Pract 25(6): 613–20.

4.Craig WJ, Mangels AR, American Dietetic Association (2009) Position of the American Dietetic Association: vegetarian diets. J Am Diet Assoc 109(7): 1266– 82.

5.Dwyer JT (1988) Health aspects of vegetarian diets. Am J Clin Nutr 48: 712–38.

6.Key TJ, Appleby PN, Davey GK, Allen NE, Spencer EA, et al. (2003) Mortality in British vegetarians: review and preliminary results from EPIC-Oxford. Am J Clin Nutr 78: 533s–58s.

The Association between Nutrition and Health

the standardized measurement of all variables. Other strengths of our study include considering the influence of weight and lifestyle factors on health, e.g. physical exercise and smoking behavior.

Potential limitations of our results are due to the fact that the survey was based on cross-sectional data. Therefore, no statements can be made whether the poorer health in vegetarians in our study is caused by their dietary habit or if they consume this form of diet due to their poorer health status. We cannot state whether a causal relationship exists, but describe ascertained associations. More- over, we cannot give any information regarding the long-term consequences of consuming a special diet nor concerning mortality rates. Thus, further longitudinal studies will be required to substantiate our results. Further limitations include the measure- ment of dietary habits as a self-reported variable and the fact that subjects were asked how they would describe their eating behavior, without giving them a clear definition of the various dietary habit groups. However, a significant association between the dietary habit of individuals and their weight and drinking behavior is indicative for the validity of the variable. Another limitation concerns the lack of detailed information regarding nutritional components (e.g. the amount of carbohydrates, cholesterol, or fatty acids consumed). Therefore, more in-depth studies about nutri- tional habits and their effects on health are required among Austrian adults. Further studies should e.g. investigate the influence of the various dietary habits on the incidence of different cancer types. To our knowledge this is the first study ever in Austria to analyze differences in terms of dietary habits and their impact on health. We admit that the large number of participants made it necessary to keep the questions simple, in order to cover the large sample. Overall, we feel that our results are of specific interest and contribute to extant scientific knowledge, notwith- standing some limitations regarding causes and effects.

Conclusions

Our study has shown that Austrian adults who consume a vegetarian diet are less healthy (in terms of cancer, allergies, and mental health disorders), have a lower quality of life, and also require more medical treatment. Therefore, a continued strong public health program for Austria is required in order to reduce the health risk due to nutritional factors. Moreover, our results emphasize the necessity of further studies in Austria, for a more in- depth analysis of the health effects of different dietary habits.

Author Contributions

Conceived and designed the experiments: NTB WF. Performed the experiments: NTB. Analyzed the data: NTB JM FG ER WF. Contributed reagents/materials/analysis tools: NTB JM FG WF. Wrote the paper: NTB ER WF.

7.Key TJ, Appleby PN, Rosell MS (2006) Health effects of vegetarian and vegan diets. Proc Nutr Soc 65(1): 35–41.

8.Deriemaeker P, Alewaeters K, Hebbelinck M, Lefvre J, Philippaerts R, et al. (2010) Nutritional status of Flemish vegetarians compared with non-vegetarians: a matched sample study. Nutrients 2(7): 770–80.

9.Baines S, Powers J, Brown WJ (2007) How does the health and well-being of young Australian vegetarian women compare with non-vegetarians? Public Health Nutr 10(5): 436–42.

10.Farmer B, Larson BT, Fulgoni VL, Rainville AJ, Liepa GU (2011) A vegetarian dietary pattern as a nutrient-dense approach to weight management: an analysis of the national health and nutrition examination survey 1999–2004. J Am Diet Assoc 111(6): 819–27.

PLOS ONE | www.plosone.org 6 February 2014 | Volume 9 | Issue 2 | e88278

11.Rizzo NS, Sabate´ J, Jaceldo-Siegl K, Fraser GE (2011) Vegetarian dietary patterns are associated with a lower risk of metabolic syndrome: the adventist health study 2. Diabetes Care 34(5): 1225–27.

12.Tonstad S, Butler T, Yan R, Fraser GE (2009) Type of vegetarian diet, body weight, and prevalence of type 2 diabetes. Diabetes care 32(5): 791–96.

13.Pollard J, Greenwood D, Kirk S, Cade J (2001) Lifestyle factors affecting fruit and vegetable consumption in the UK women’s cohort study. Appetite 37(1): 71–79.

14.Gacek M (2010) Selected lifestyle and health condition indices of adults with varied models of eating. Rocz Pantsw Zakl Hig 61(1): 65–69.

15.Low Dog T (2010) The role of nutrition in mental health. Altern Ther Health Med 16(2): 42–46.

16.Michalak J, Zhang XC, Jacobi F (2012) Vegetarian diet and mental disorders: results from a representative community survey. Int J Behav Nutr Phys Act 9: 67.

17.Singh PN, Sabate´ J, Fraser GE (2003) Does low meat intake increase life expectancy in humans? Am J Clin Nutr 78(3): 526s–32s.

18.McEvoy CT, Temple N, Woodside JV (2012) Vegetarian diets, low-meat diets and health: a review. Public Health Nutr 15: 2287–2294.

19.Appelby PN, Thorogood M, Mann JI, Key TJA (1999) The Oxford vegetarian study: an overview. Am J Clin Nutr 70: 525s–31s.

20.Frentzel-Beyme R, Chang-Claude J (1994) Vegetarian diets and colon cancer: the German experience. Am J Clin Nutr 59: 143s–52s.

´

21. Burkert NT, Großscha¨dl F, Muckenhuber J, Ra´sky E, Stronegger WJ, et al. (2012) Gastro-intestinal complaints related to various eating behaviours. J Nutr Therapeutics 1: 19–23.

22. Tantamango-Bartley Y, Jaceldo-Siegl K, Fan J, Fraser G (2013) Vegetarian Diets and the Incidence of Cancer in a Low-risk Population. Cancer Epidemiol Biomarkers Prev 22(2). DOI: 10.1158/1055-9965.EPI-12.1060.

23. Flood A, Velie AM, Sinha R, Chaterjee N, Lacey JV, et al. (2003) Meat, fat, and their subtypes as risk factors for colorectal cancer in a prospective cohort study in women. Am J Epidemiol 158: 59–68.

24. Mathew A, Peters U, Chatterjee N, Kulldorff M, Sinha R (2004) Fat, fiber, fruits, vegetables, and risk of colorectal adenomas. Int J Cancer 108: 287–292.

25. Seow A, Quah SR, Nyam D, Straughan PT, Chua T, et al. (2002) Food groups and the risk of colorectan carcinomas in an Asian population. Cancer 95: 2390– 2396.

26. Vang A, Singh PN, Lee JW, Haddad EH, Brinegar CH (2008) Meats, processed meats, obesity, weight gain and occurrence of diabetes among adults: findings from Adventist Health Studies. Ann Nutr Metab 52(2): 96–104.

27. Boutron-Ruault MC, Senesse P, Meance S, Belghiti C, Faivre J (2001) Energy intake, body mass index, physical activity, and the colorectal adenoma- carcinoma sequence. Nutr Cancer 39: 50–57.

28. Appleby PN, Key TJ, Thorogood M, Burr ML, Mann J (2002) Mortality in British vegetarians. Public Health Nutr 5(1): 29–36.

29. Chang-Claude J, Hermann S, Eilber U, Steindorf K (2005) Lifestyle determinants and mortality in German vegetarians and health-conscious persons: results of a 21-yearfollow-up. Cancer Epidemiol Biomarkers Prev 14(4): 963–68.

30. Fraser GE (2009) Vegetarian diets: what do we know of their effects on common chronic diseases? Am J Clin Nutr 89: 1607s–12s.

The Association between Nutrition and Health

31.Sabate´ J (2003a) The contribution of vegetarian diets to health and disease: a paradigm shift? Am J Clin Nutr 78: 502s–7s.

32.Sabate´ J (2003b) The contribution of vegetarian diets to human health. Forum Nutr 56: 218–20.

33.Karlic H, Schuster D, Varga F, Klindert G, Lapin A, et al. (2008) Vegetarian diet affects genes of oxidative metabolism and collagen synthesis. Ann Nutr Metab 53(1): 29–32.

34.Kornsteiner M, Singer I, Elmadfa I (2008) Very low n-3long-chain polyunsaturated fatty acid status in Austrian vegetarians and vegans. Ann Nutr Metab 52(1): 37–47.

35.Majchrzak D, Singer I, Maenner M, Rust P, Genser D, et al. (2006) B-vitamin status and concentrations of homocysteine in Austrian omnivores, vegetarians and vegans. Ann Nutr Metab 50(6): 485–91.

36.Schumacher M, Eber B, Schallmoser K, Toplak H, Zweiker R, et al. (1993) Eating behavior of patients with metabolic diseases and metabolically healthy probands in Austria. Results of a questionnaire survey at the Graz Autumn Fair 1991. Wien Med Wochenschr 43(12): 329–23.

37.Klimont J, Kytir J, Leitner B (2007) Austrian Health Interview Survey 2006/07. (Oesterreichische Gesundheitsbefragung 2006/07. Hauptergebnisse und meth- odische Dokumentation.) Wien: Statistik Austria.

38.Bauer GF, Huber CA, Jenny GJ, Mueller F, Haemming O (2009) Socioeconomic status, working conditions and self-rated health in Switzerland: explaining the gradient in men and women. International J Pub Health 54: 23– 30.

39.Volkert, D (2006) The body mass index (BMI) – an important parameter to evaluate the nutritional status [Der Body-Mass-Index (BMI) – ein wichtiger Parameter zur Beurteilung des Erna¨hrungszustandes]. Aktuel Ernaehr Med 31: 126–132.

40.Dorner TE, Rieder A (2010) Obesity paradox or reverse epidemiology: is hight body weight a protective factor for various chronic conditions? [Das Adipositasparadoxon oder Reverse Epidemiologie. Hohes Ko¨rpergewicht als protektiver Faktor bei bestimmten chronischen Bedingungen?] Dtsch Med Wochenschr 135: 413–418.

41.Burkert NT, Ra´sky E, Freidl W (2012) Social inequalities regarding health and health behaviour in Austrian adults. Wien klin Wochenschr 7–8:256–261.

42.OECD Social Policy Division (2009) ‘‘What are equivalence scales?’’ Available: http://www.oecd.org/els/social.

43.World Health Organization (2013) Global database on Body Mass Index. BMI classification. Available: http://apps.who.int/bmi/index.jsp?introPage = intro_3.html. Accessed 2013 September 17.

44.Craig CL, Marshall A, Sjostrom M, Bauman AE, Booth ML et al. (2003) International Physical Activity Questionnaire: 12 country reliability and validity. Med Sci Sports Exerc 35(8): 1381–1395.

45.World Health Organization (1996) WHOQOL-BREF. Introduction, Adminis- tration, Scoring, and Generic Version of the Assessment. Geneva: WHO. Available: http://www.who.int/mental_health/media/en/76.pdf.

46.Leitzmann C (2005) Vegetarian diets: what are the advantages? Forum Nutr 57: 147–56.
bookmark_borderForaging For Food in the Winter

Winter foraging can be one of the toughest challenges; however, if you do a little preparation in the fall, the buried treasures will yield healthy results.

Find out more from the Guide To Edible Plants’ Foraging for Food in the Winter.

Chives, Garlic Greens, Mint, Carrot Greens, Parsley