⚡ How Is Climate Change Hitting You? Rapid-Fire Lightning
Rapid-fire, near-continuous cloud-to-cloud lightning can sound less like an ordinary thunderstorm and more like a prolonged fireworks finale lasting an hour or more.
But the lightning is doing more than making noise.
⚡ Lightning creates NOx 🌎 NOx contributes to ozone formation 🌿 Ground-level ozone damages vegetation and reduces its ability to take up CO₂ 🔥 Ozone is also a greenhouse gas
That creates a powerful climate feedback:
More heat → more intense atmospheric processes → more lightning → more NOx → more low-level ozone → less vegetation carbon uptake → more CO₂ remaining in the atmosphere → more warming.
The vegetation that normally helps remove carbon from the atmosphere can itself become a casualty of increasing atmospheric ozone.
This is why climate change is not simply about a rising temperature.
It is about interconnected feedbacks that can amplify one another.
Sometimes you don’t just see climate change.
You hear it.
You feel it.
And sometimes, like during a night of nearly continuous lightning, it can sound like a war zone outside your window.
🌩️🌿🔥
How Is Climate Change Hitting You? Read the full paper:
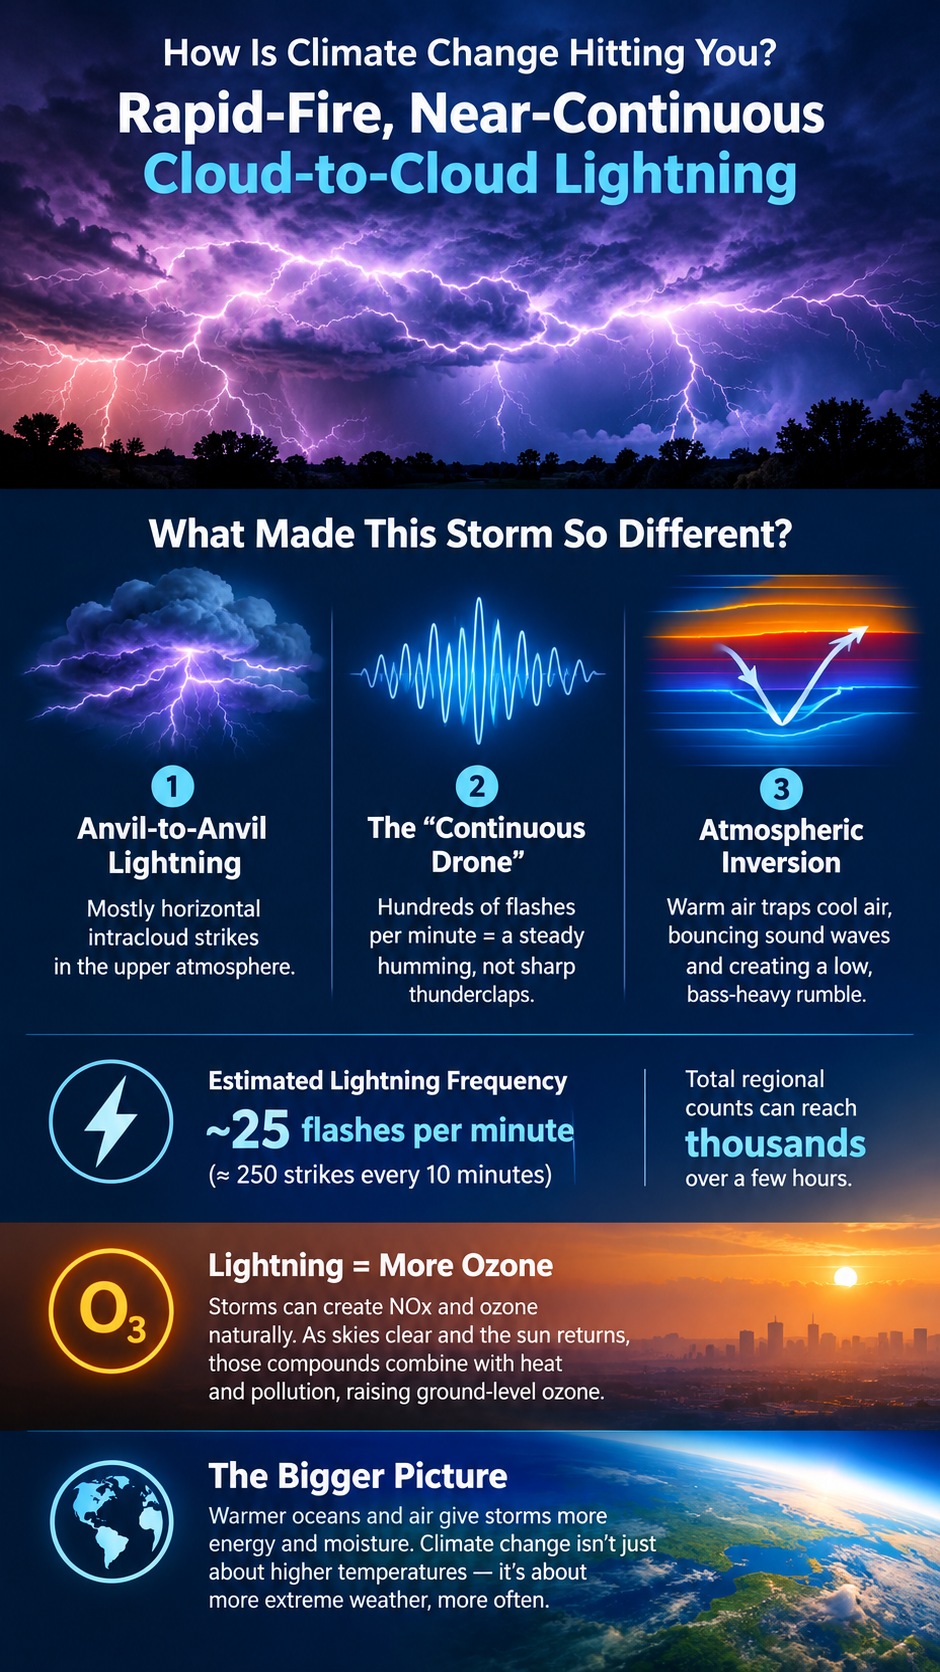
The unusual-sounding lightning storm that moved through Chester County, Pennsylvania, overnight was a severe weather system characterized by rapid-fire, near-continuous cloud-to-cloud lightning, accompanied by low, constant rolling rumbles rather than distinct thunderclaps.
The storm’s acoustic and visual profile was dictated by several notable meteorological factors.
Anvil-to-Anvil (Intracloud) Lightning
Rather than producing primarily traditional vertical cloud-to-ground strikes, this system generated a massive amount of horizontal, intracloud lightning that appeared to crawl across the upper atmosphere.
The “Continuous Drone” Sound
Because hundreds of high-altitude flashes occurred every minute, their sound waves overlapped continuously. Instead of hearing a sharp, localized crack followed by booming thunder, residents experienced a strange, uninterrupted humming or buzzing vibration that persisted for extended periods, sounding more like a prolonged fireworks finale lasting an hour or more.
Atmospheric Inversion
The storm arrived during a highly humid evening ahead of a cooler morning. When a layer of warmer air traps cooler air near the surface, it creates an atmospheric inversion that can act as an acoustic ceiling. This can cause sound waves to be reflected back toward the ground, muffling the sharpness of individual cracks and stretching the thunder into a low-frequency, bass-heavy rumble that can seem to vibrate through the walls of homes.
Estimated Lightning Frequency
At the peak of the system moving through the region, regional radar and lightning networks estimated close to 25 lightning flashes per minute—roughly 250 strikes every 10 minutes—across the storm cells in southeastern Pennsylvania.
For a fast-moving but highly charged system like this one, total regional flash counts over a multi-hour period can scale into the thousands of individual flashes.
Lightning, NOx, and Ground-Level Ozone
Severe lightning storms contribute to low-level, or ground-level, ozone through chemical production triggered by the intense heat and vertical atmospheric churning associated with lightning.
Most ground-level ozone is a man-made pollutant formed when emissions from vehicles and industry interact with sunlight. But intense lightning can also produce ozone naturally and generate nitrogen oxides (NOx) high in the atmosphere.
Because last night’s storm was highly electrical and featured continuous intracloud flashing, it likely generated a high volume of regional NOx within the storm clouds. As clear skies and sunlight return to southeastern Pennsylvania today, those lingering compounds can interact with existing heat and other atmospheric pollutants, contributing to elevated regional ground-level ozone.
Climate Energy Hitting You
The important point is not simply that southeastern Pennsylvania experienced another unusual thunderstorm.
It is that climate change is altering the energy available to Earth’s weather systems.
As the atmosphere and oceans warm, more energy and moisture become available to storms. That additional energy can manifest locally as changes in precipitation intensity, heat, humidity, lightning, severe thunderstorms, and other forms of extreme weather.
Sometimes climate change doesn’t announce itself with a gradual change in a temperature reading.
Sometimes you hear it.
You feel it.
And on a night filled with nearly continuous lightning, you may even hear it as a low, persistent rumble vibrating through your home—more like a war zone than an ordinary thunderstorm.
☁️🌎 LOW-LEVEL CLOUD FEEDBACK: THE UNKNOWN MEGA-MULTIPLIER
What if one of Earth’s most important climate amplifiers is something we still don’t fully understand?
Low-level marine clouds are more than weather. They are a planetary sunshade—reflecting enormous amounts of incoming sunlight back into space.
But what happens if that sunshade starts to disappear?
🔥 As the climate warms, low-level clouds over the Pacific may thin, weaken, and potentially reach a tipping point where marine stratocumulus cloud decks fragment.
Less reflective cloud cover means more sunlight reaches the dark ocean.
More absorbed solar energy means more warming.
And more warming can further disrupt the clouds.
That is a feedback loop.
But the bigger concern is what happens when this feedback couples with other warming feedbacks already accelerating across the Earth system.
🌀 Warming ↓ ☁️ Low clouds diminish ↓ ☀️ More solar energy enters the ocean ↓ 🌊 Ocean warming accelerates ↓ 🔥 Further climate warming ↓ ☁️ More cloud disruption
Leading research suggests that the loss of low-level cloud albedo could contribute an additional 1.5°C to 2°C of global warming.
That would not be a minor correction to the climate trajectory.
It may be The Mega-Multiplier. In a tipping point scenario where clouds completely break up under extreme emission tracks, it could trigger a catastrophic, abrupt warming spike.
The climate system is not a collection of isolated feedbacks.
It is a coupled, nonlinear system in which feedbacks can interact, reinforce one another, and accelerate change.
☁️ The clouds may be one of the biggest unknowns.
And the Pacific may be where we need to look.
Read the full paper and explore the feedback cascade:
The Mega-Multiplier
The dynamic role of clouds is widely recognized as the single largest source of uncertainty in modern climate modeling. Cloud feedbacks can act as both blankets, trapping Earth’s heat, and sunshades, reflecting sunlight back into space.
As global warming has entered a faster decadal phase, leading research indicates that changes to both high- and low-level cloud structures are shifting toward a strong, positive warming-amplification loop.
1. High-Level Clouds: The Expanding Heat Trap
High-level clouds, such as cirrus clouds, reside above 20,000 feet. Composed primarily of ice crystals, they are relatively thin and transparent to incoming solar radiation, allowing sunlight to pass through them. However, they are highly effective at absorbing the outgoing longwave infrared radiation—heat—emitted from Earth’s surface and re-radiating it back downward.
The Anvil Cloud Expansion: Deep convective storms in the tropics create massive, fan-shaped high clouds known as tropical anvil clouds. As the upper troposphere warms and shifts, these clouds are expected to remain at higher, colder altitudes. Because they are colder, they radiate less heat out to space, increasing their efficiency as a planetary heat trap.
The High-Cloud Shift: Furthermore, climate models suggest that warming causes high-level clouds to shift toward higher latitudes, or poleward. This migration redistributes the heat-trapping effect over areas that are already experiencing accelerated melting, like the Arctic, compounding regional warming trends.
2. Low-Level Clouds: The Diminishing Planetary Sunshade
While high clouds act as greenhouse blankets, low-level clouds—specifically marine stratocumulus decks that sit below 6,000 feet—act as Earth’s primary solar sunshade. They cover roughly 20% of the subtropical oceans and reflect up to 30% to 60% of incoming sunlight back into space.
The shrinking of these low-level cloud decks, particularly over the northeast and southeast Pacific Ocean, is the focal point of intense scientific concern.
The Mechanics of Pacific Cloud Loss
Low-lying marine stratocumulus clouds depend heavily on a fragile thermal balance. They are sustained by a process called cloud-top radiative cooling, in which the tops of the clouds radiate heat out into space, cooling the air within the cloud layer. This cooling causes the air to sink, creating a convective loop that draws moisture up from the warm ocean surface below to maintain the cloud deck.
Global warming disrupts this system in two powerful ways:
Atmospheric Opacity: High concentrations of greenhouse gases render the lower atmosphere more opaque to infrared radiation. This traps heat above the clouds, warming their tops and stifling the cloud-top radiative cooling required to drive convection.
Enhanced Evaporation and Turbulence: As sea-surface temperature (SST) rises, the layer of dry air above the marine boundary layer grows warmer. This induces stronger turbulence that entrains—pulls down—dry, warm air from above, rapidly evaporating the thin cloud layer.
Groundbreaking thermodynamic simulations, notably led by researchers at Caltech’s Linde Center, have revealed that low-level clouds possess a critical tipping point.
If greenhouse gas concentrations continue to rise unchecked, marine stratocumulus decks over the Pacific could reach an instability threshold where they fragment and dissolve into scattered, shallow cumulus clouds. Without the vast reflective white sheets to shield the ocean, the dark tropical and subtropical waters would absorb massive amounts of solar energy.
Calculations indicate that the loss of this cloud albedo feedback alone could add an additional 1.5°C to 2°C of global warming. In a tipping point scenario where clouds completely break up under extreme emission tracks, it could trigger a catastrophic, abrupt warming spike.
Even short of a total breakup, observational data from satellites indicates that a gradual thinning of these clouds is already underway. This slow degradation is believed to be a major factor behind the recent acceleration in Earth’s total energy imbalance and ocean heat uptake.
The Unknown Mega-Multiplier
Cloud feedback is different from many other climate feedbacks because the direction, magnitude, and interactions of cloud changes remain exceptionally difficult to constrain.
The fundamental physics are clear: clouds can either reflect incoming solar energy back into space or trap outgoing heat within the climate system. But their response to a warming planet depends on where clouds form, how high they are, how thick they become, how long they persist, how they interact with atmospheric moisture and circulation, and how those changes couple with other climate feedbacks.
That creates the possibility of a multiplier effect.
A reduction in low-level Pacific clouds allows more solar energy to enter the ocean. Additional ocean warming changes evaporation, atmospheric circulation, and moisture transport. Those changes can alter cloud formation and persistence, potentially producing further reductions in reflective cloud cover. At the same time, changes in high-level clouds can increase the retention of outgoing heat.
The result is not simply more warming.
It is a potentially coupled feedback cascade:
Warming → cloud changes → altered albedo and heat retention → more absorbed energy → additional warming → further cloud changes.
This is why low-level cloud feedback may represent one of the most consequential uncertainties in the future climate trajectory.
If Pacific low-level cloud cover continues to diminish, the planet loses part of its natural solar shield at precisely the time that greenhouse-gas concentrations are increasing and other climate feedbacks are accelerating.
The question is no longer simply whether clouds respond to warming.
The critical question is whether warming is pushing the cloud system toward a threshold where the loss of low-level marine cloud albedo becomes a self-reinforcing source of additional global warming.
If so, low-level cloud feedback could become the unknown mega-multiplier—a climate feedback capable of coupling with other tipping elements and accelerating an already nonlinear Earth-system response.
Climate feedbacks are processes in which an initial change in Earth’s climate system triggers additional changes that amplify or dampen the original change. Positive feedbacks amplify the initial warming caused by greenhouse-gas emissions, accelerating climate change beyond what the initial forcing alone would produce.
As Earth’s climate system warms and destabilizes, millions of emerging feedback interactions are becoming active across the atmosphere, oceans, cryosphere, land, and living systems. Many of these interactions are now being observed for the first time in human history. As individual feedbacks activate, strengthen, and interact with one another, they create new pathways for amplifying climate change and accelerating Earth-system change.
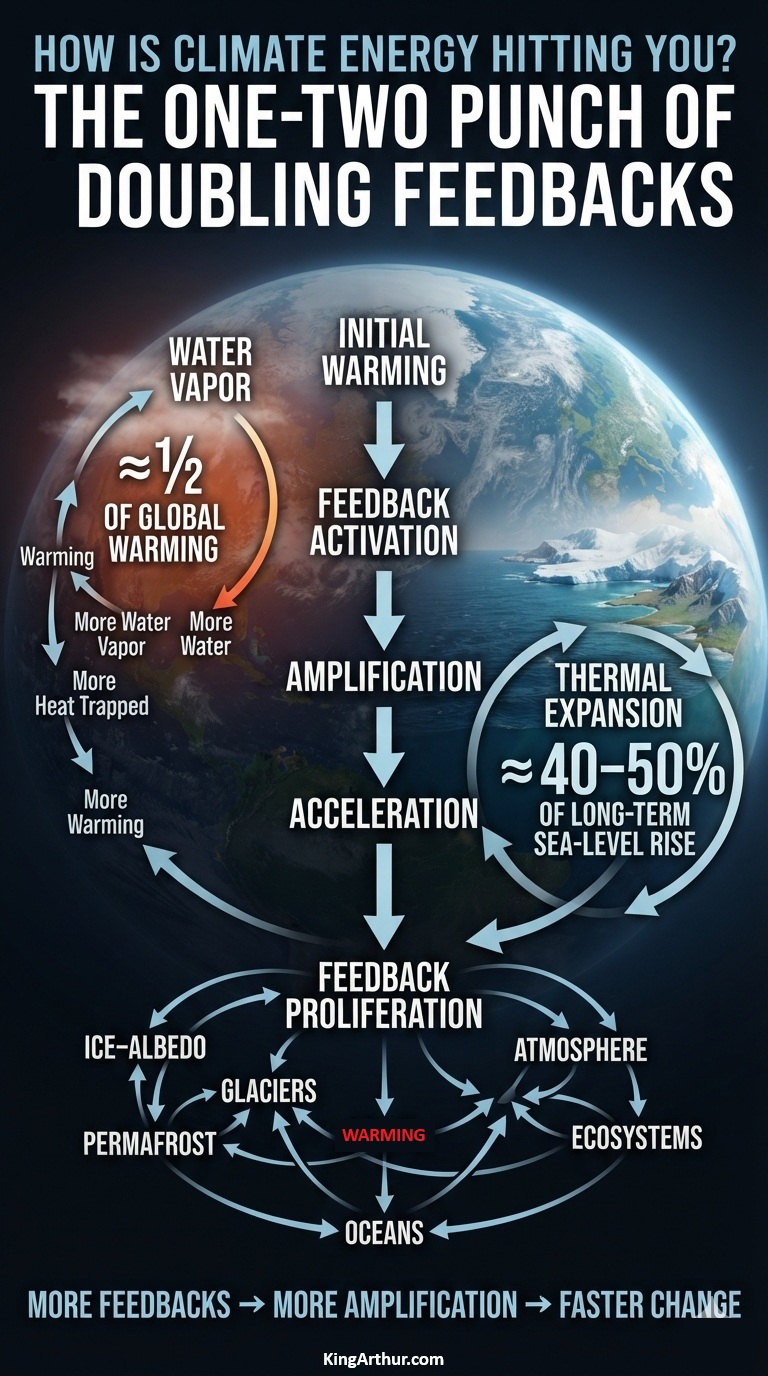
Two important climate-system responses illustrate this one-two punch: water-vapor amplification and ocean thermal expansion.
Water Vapor: The First Punch
Water vapor is Earth’s most important natural greenhouse-gas feedback.
As the atmosphere warms, it can hold more water vapor. Because water vapor is itself a powerful greenhouse gas, additional atmospheric moisture traps more outgoing infrared radiation, causing further warming. That additional warming allows the atmosphere to hold still more water vapor.
It is a reinforcing cycle:
Warming → more water vapor → more heat trapped → more warming
Water-vapor feedback is Earth’s greatest climate amplifier. As temperatures rise, the atmosphere holds more water vapor, which traps additional heat and amplifies the initial warming. Water-vapor feedback is responsible for approximately half of the global warming observed since the 1990s, making it one of the most powerful mechanisms accelerating Earth-system warming.
Thermal Expansion: The Second Punch
The ocean delivers a different kind of climate response.
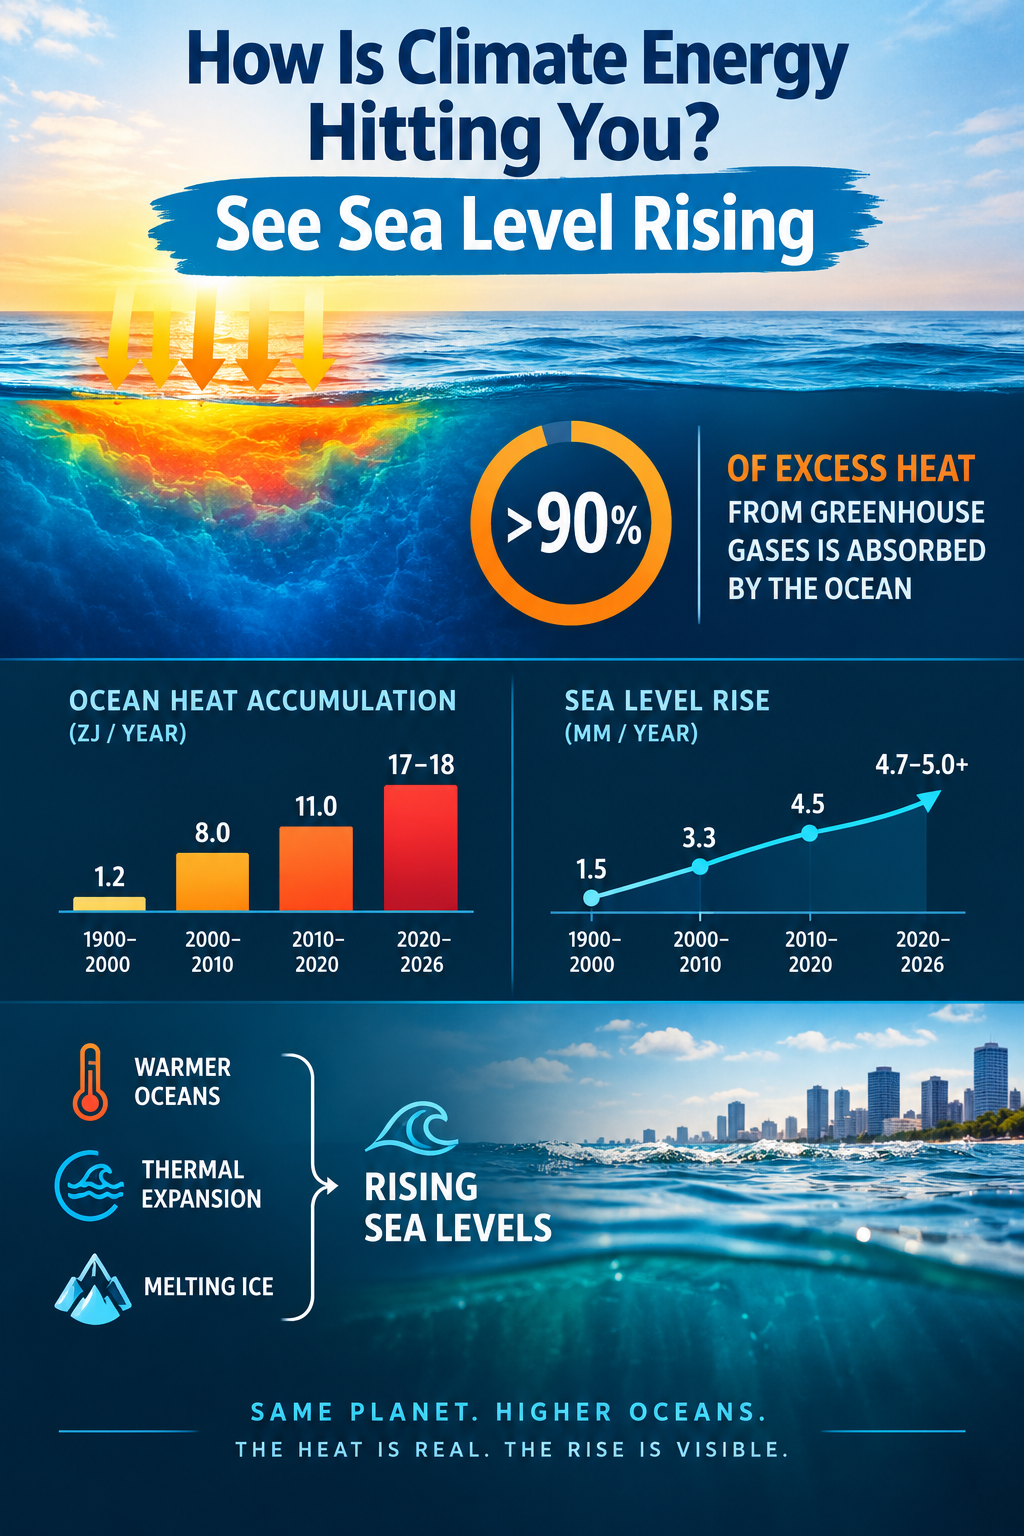
More than 90% of the excess heat accumulating in the Earth system is absorbed by the ocean. As seawater warms, it expands, increasing ocean volume and contributing to global sea-level rise.
This process is called thermal expansion or steric sea-level rise.
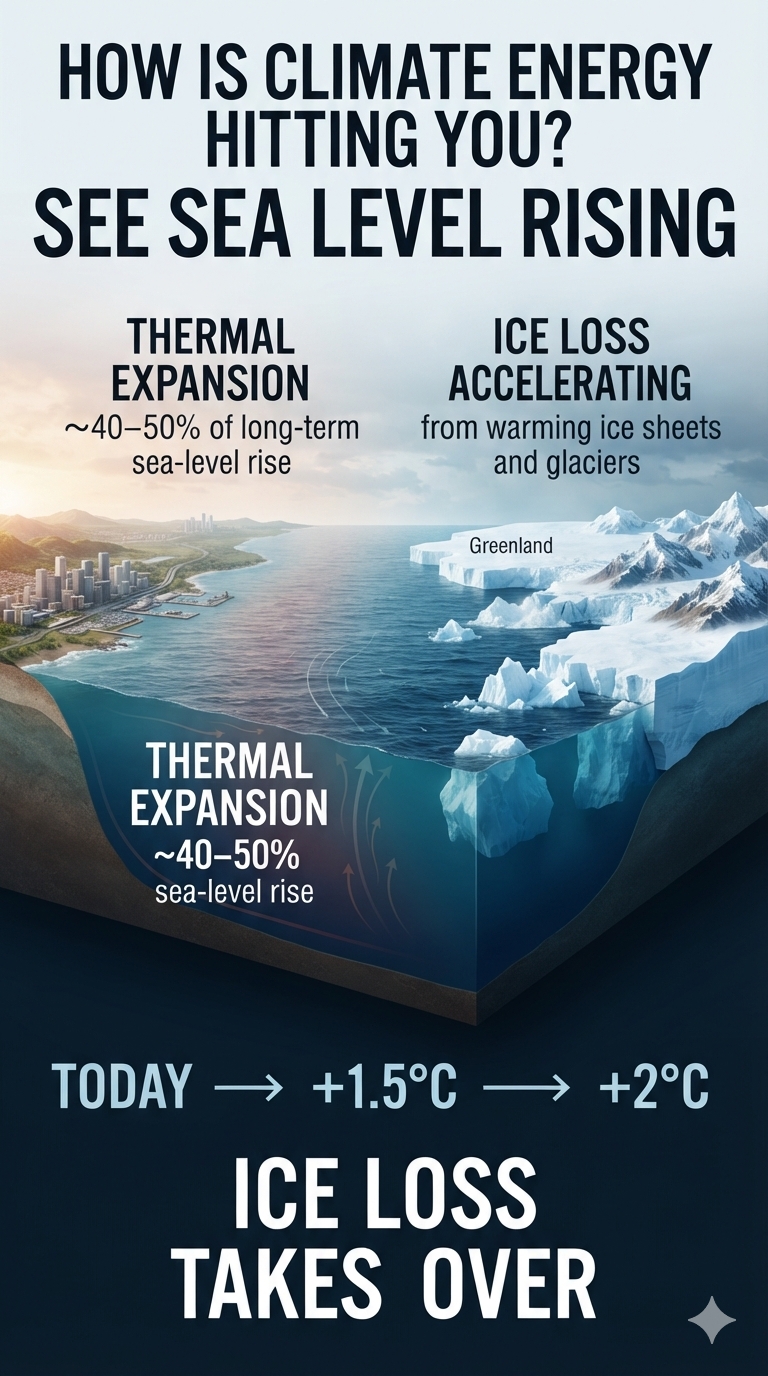
Thermal expansion has historically contributed roughly 40% to 50% of long-term global sea-level rise, with the remainder coming primarily from melting glaciers and ice sheets. The exact contribution varies over time and depends on the period and measurement method.
The water-vapor and thermal-expansion processes demonstrate two different ways excess climate energy can double the impact of climate change. Water-vapor feedback can approximately double the warming impact of greenhouse-gas emissions, while thermal expansion can approximately double the sea-level-rise impact by adding substantial additional sea-level rise beyond the contribution from melting land ice alone.
Water vapor amplifies warming.
Thermal expansion raises the oceans.
And neither operates in isolation.
As warming increases, additional feedbacks can become activated or strengthened—including ice-albedo feedback, permafrost carbon release, glacier and ice-sheet loss, and changes in ocean and atmospheric circulation.
The result is not a simple linear response.
More warming → more feedbacks → more warming → greater physical impacts
That is the one-two punch of climate feedbacks: the initial energy imbalance changes the climate system, while reinforcing processes can amplify the consequences.
The question is no longer simply “How much has Earth warmed?”
The more consequential question is:
“What is that additional climate energy doing to the Earth system—and how quickly are the feedbacks making it worse?”
More than 90% of the excess heat trapped in Earth’s climate system by human-caused greenhouse gas emissions is absorbed by the ocean.
Because water has a much higher heat capacity than air, the global ocean acts as a massive climate buffer. Without this vast heat reservoir soaking up the energy from burning fossil fuels, the atmosphere and land surfaces would be warming at a drastically faster, potentially unlivable rate.
But the ocean’s ability to absorb heat does not make that energy disappear. It stores the energy and redistributes it throughout the climate system—with consequences that include rising sea levels, melting ice, changing ocean circulation, and increasingly energetic climate feedbacks.
Estimated Rates of Ocean Heat Accumulation
Period
Approximate Rate
1900–2000
~1.2 ZJ/year
2000–2010
~8.0 ZJ/year
2010–2020
~11.0 ZJ/year
2020–2026
~17.0–18.0 ZJ/year
Key Factors Behind the 2026 Update
The 2025–2026 Acceleration
The 2020–2025 baseline average of approximately 16 ZJ/year was shattered by a massive, record-breaking surge reported in early 2026.
Peer-reviewed findings from the Institute of Atmospheric Physics (IAP/CAS) and Copernicus Marine revealed that the ocean absorbed an astonishing ~23 ZJ of excess heat in 2025 alone—up from ~16 ZJ in 2024.
That increase represents more than simply a large amount of additional heat. It is evidence of an accelerating rate of energy accumulation in the ocean.
Thermal Expansion
Thermal expansion is responsible for roughly 40% to 50% of long-term global sea-level rise. Over the last few decades, the drivers of rising oceans have generally been split roughly down the middle between thermal expansion—the swelling of water as it heats up—and meltwater from glaciers and ice sheets.
The percentage can fluctuate dramatically from year to year because of global weather patterns.
For instance, according to a NASA analysis, a massive surge in ocean heat during the 2024 El Niño caused a temporary flip: two-thirds, or about 66%, of that year’s accelerated sea-level rise came from thermal expansion alone.
Because the ocean is so vast, it acts like a giant, slow-moving thermal battery. Even if global greenhouse gas emissions were to completely stop today, the heat already trapped in the climate system would continue to move into the deep ocean for centuries.
This means sea levels will continue to rise from thermal expansion long after surface temperatures stabilize. As global temperatures rise beyond 1.5°C to 2°C, the rate of ice sheet melt is projected to grow exponentially, drastically outpacing thermal expansion. By the end of the century, scientists expect melting ice sheets and glaciers to become the overwhelmingly dominant driver, shrinking thermal expansion’s proportional share well below its current 40%–50% baseline.
The ocean therefore provides a critical buffer against even faster atmospheric warming—but that buffer comes with a cost. The energy being absorbed by the ocean is physically expanding the water and helping drive sea-level rise.
Rate of Sea-Level Rise
Period
Approximate Rate
1900–2000
~1.5 mm/year
2000–2010
~3.3 mm/year
2010–2020
~4.5 mm/year
2020–2026
~4.7–5.0+ mm/year
Sea Level Rise Is Accelerating
Sea-level rise is not occurring at a constant rate.
The rate has increased substantially over the past century, from roughly 1.5 mm/year during 1900–2000 to approximately 4.7–5.0+ mm/year during 2020–2026.
In other words, sea level rise is accelerating—and the acceleration itself is accelerating.
What happens in the ocean does not stay in the ocean.
The heat accumulating in the world’s oceans is becoming a physical signal we can see: sea level rising.
Reservoir Dry Dogs: Climate Change Is Shrinking America’s Water Storage
Climate change is making the world’s reservoirs less reliable, altering both the quantity and quality of stored freshwater. Rising temperatures, erratic precipitation, drought, wildfire, extreme rainfall, and shifting ecosystems are attacking water storage through three interconnected mechanisms:
Less water entering reservoirs
Less capacity to store the water that does arrive
Degrading water quality and creating additional climate feedbacks
The result is a growing climate-water squeeze: the water supply is declining while the infrastructure designed to store that water is simultaneously losing capacity.
The Global Reservoir Problem
More than half of the world’s largest reservoirs and lakes have shrunk significantly since the early 1990s as a result of climate change, extreme drought, human water consumption, and rapid sedimentation.
Research published in journals including Science and Nature Sustainability indicates that nearly two-thirds of existing large reservoirs have experienced substantial water losses.
This is not simply a drought problem. It is increasingly a water-storage problem.
The Colorado River System
Lake Mead and Lake Powell are the two largest reservoirs in the United States, supplied by the Colorado River system.
A multi-decade, climate-change-driven megadrought combined with heavy regional water demand has pushed both reservoirs toward historically low levels. Persistent low storage threatens drinking-water supplies and hydropower generation serving more than 40 million people across the American Southwest.
Frequently near-empty; severe farm-supply deficits
Strontia Springs
Colorado
Denver municipal supply
Wildfire erosion & flash floods
Rapid sediment buildup and declining storage capacity
San Luis
California / Central Valley
Agricultural & municipal hub
Atmospheric rivers & extreme heat
High runoff pollution, increasing groundwater dependence
Global Climate-Water Hotspots
The most critically impacted reservoirs and water systems around the world are experiencing intense climate-related strain.
Reservoir / Lake
Location
Primary Climate Driver
Status / Impact
Lake Mead & Lake Powell
United States
Megadrought & low snowmelt
Drinking-water and energy deficits
Balbina Reservoir
Brazil
High heat & decaying biomass
Massive methane emissions and ecological damage
Gowd-e-Zareh
Afghanistan
Extreme heat & runoff loss
Widespread desiccation and loss of agricultural water
Mar Chiquita
Argentina
Accelerated evaporation & land pressure
Severe shrinkage and ecological threat
These examples illustrate an increasingly important principle: climate change does not have to eliminate a water source completely to make the water system fail.
Extreme Evaporation
One of the simplest ways climate energy attacks reservoirs is through evaporation.
For an open water surface—including a reservoir or swimming pool—evaporation depends on several interacting variables. A useful framework is the Penman combination equation, which incorporates both the energy available at the surface and aerodynamic drying.
The equation contains two major physical components.
1. Available Energy
The term:
Δ(Rₙ − G)
represents the energy available at the surface to drive evaporation.
Greater available energy generally means greater potential evaporation when sufficient water is available.
In a warming climate, increasing temperatures and changes in surface energy can therefore increase evaporative demand.
2. Aerodynamic Drying
The term:
ρₐ × cₚ × (eₛ − eₐ) / rₐ
represents the aerodynamic component.
The difference:
eₛ − eₐ
is the vapor-pressure deficit (VPD).
A larger VPD means the atmosphere is farther from saturation and therefore has a greater capacity to remove water from a wet surface.
Wind increases turbulent exchange, continually replacing moist air near the water surface with drier air.
The result can be extreme evaporation.
For reservoirs, this means that the same climate energy that produces hotter air can also accelerate the loss of the water stored behind dams.
America’s Reservoirs Are Filling With Sediment
Evaporation and drought are only half of the problem.
Climate change is creating a dangerous feedback loop in America’s water-storage system: drought is reducing available water just as wildfires and increasingly extreme rainfall are accelerating sedimentation that reduces the capacity of reservoirs to store what water remains.
Strontia Springs: A Case Study
Strontia Springs Reservoir near Denver provides a clear example.
After 44 years, nearly 20% of its storage capacity has been consumed by sediment.
Wildfires upstream destroyed vegetation that once stabilized steep slopes. Subsequent rainstorms then washed enormous quantities of soil, sand, and debris into the reservoir.
Denver Water has already spent $18.5 million on dredging, yet removed less than half of the material it hoped to remove.
The reservoir therefore demonstrates an important climate connection:
The United States has roughly 90,000 reservoirs and dams, supplying about 70% of the nation’s water.
Of critical federal reservoirs surveyed, nearly one-third have lost at least 10% of their capacity to sediment.
A recent Nature study estimates that the United States has already lost about 8% of total reservoir storage capacity, equivalent to roughly 25.5 million Olympic swimming pools.
Nearly half of U.S. reservoirs may be more than 25% filled with sediment.
Because the population has grown, the loss is even more significant on a per-person basis. Estimates indicate that the United States may have already lost up to 44% of its per-capita water-storage capacity since the 1970s.
And smaller reservoirs may actually be in worse condition because they tend to fill with sediment faster and are less comprehensively monitored.
Why Climate Change Makes It Worse
The climate-water system is being squeezed from multiple directions.
Less water coming in
Climate warming → drought → less snow → reduced runoff → less reservoir inflow
Less storage capacity
Climate warming → more wildfire → vegetation loss → erosion → sedimentation → less reservoir capacity
More extreme runoff
Extreme rainfall → larger runoff events → more soil and debris transported into reservoirs
These processes can operate simultaneously.
That is the critical point.
There is less water coming into reservoirs while the reservoirs themselves are losing their ability to store the water that does arrive.
By 2041, wildfires could double sediment accumulation in more than one-third of U.S. watersheds, with nearly all watersheds experiencing at least a 10% increase.
The Economic Consequences
Shrinking reservoir capacity threatens much more than drinking water.
It affects:
Agriculture and irrigation
Hydroelectric generation
Food prices
Water-utility costs
Groundwater supplies
Agricultural insurance
Capital costs for water infrastructure
When reservoirs run low, farmers increasingly turn to groundwater.
During California’s 2015 drought, for example, farmers spent an additional $600 million pumping groundwater.
The costs therefore extend well beyond the reservoir itself.
The Hidden Danger: Reservoirs Don’t Have to Be “Full” of Sediment
One of the most important points is that the percentage of total sedimentation can be misleading.
A reservoir could theoretically retain 80–90% of its original storage capacity while already experiencing a critical operational failure.
Why?
Because water outlets, hydroelectric equipment, and intake structures are generally located toward the bottom of the reservoir.
A relatively modest amount of sediment can therefore interfere with critical infrastructure long before the reservoir appears visually “full” of sediment.
As one geomorphologist has noted, 15% sedimentation may be enough to block an intake.
That is what happened at Colorado’s Paonia Reservoir, where sediment accumulated around the outlet, eventually forcing managers to drain the reservoir and physically remove sediment.
The lesson is important:
Storage capacity is not the same thing as operational capacity.
Why Solving It Is So Difficult
There are several potential responses, but each presents major challenges.
Dredging
Dredging is extremely expensive and technically difficult. Sediment can be abrasive or contaminated, and disposing of millions of tons of material requires permits and suitable locations.
Flushing
Sediment can sometimes be flushed downstream by releasing large quantities of water through the dam.
But that becomes particularly difficult during a drought—the exact time when water is most valuable.
Preventing Erosion
Managing vegetation and reducing wildfire damage upstream can slow sedimentation.
But climate-driven wildfire risk is increasing, making erosion prevention increasingly difficult.
Building New Reservoirs
New reservoirs are expensive, politically difficult, and environmentally controversial.
More importantly, they can become problematic investments if climate change alters the water-supply assumptions on which they were designed.
Building additional storage does little good if the climate is simultaneously reducing the water available to fill it.
The Bigger Picture: A Climate Infrastructure Feedback
America’s reservoir system is an aging piece of infrastructure whose original assumptions are becoming increasingly obsolete.
Most dams were constructed decades ago, with expected useful lives of roughly 50–100 years. Engineers understood that sedimentation would eventually threaten their usefulness.
The problem was largely deferred to future generations.
Now that future has arrived.
The central problem is therefore not simply that reservoirs are filling with mud.
It is that America is simultaneously losing:
1. The water entering its reservoirs
and
2. The physical capacity to store the water that does arrive.
That creates a powerful infrastructure feedback:
Warming → drought and wildfire → reduced inflow + increased erosion → sedimentation → reduced storage → greater water scarcity → greater dependence on increasingly stressed water sources.
And another climate-energy pathway operates alongside it:
Warming → greater available energy + higher evaporative demand → increased evaporation → further water loss.
Together, these processes transform reservoirs from passive infrastructure into active components of the climate-water system.
Reservoir Dry Dogs
The phrase “reservoir dry dogs” captures the emerging problem: water systems can become increasingly thirsty even while the infrastructure built to supply them remains physically present.
A reservoir does not have to disappear to become unreliable.
It can lose water through drought and evaporation.
It can lose storage through sediment.
It can lose operational capacity when sediment blocks intakes and outlets.
It can lose water quality through heat, pollution, and ecological disruption.
And it can become increasingly expensive to maintain precisely when communities have fewer water resources available to pay for that maintenance.
The climate signal is therefore not simply less water.
It is less reliable water storage.
The deeper climate-energy story is that warming is attacking the water system from both sides:
Less water coming in.
Less room to keep it.
More energy driving it out.
That is how climate energy hits you—even when the water is sitting behind a dam.
Water vapor is the greatest climate amplifier, acting as Earth’s most powerful natural feedback mechanism.
While greenhouse gases such as carbon dioxide (CO₂) and methane (CH₄) are the primary drivers of human-caused climate change, water vapor amplifies and multiplies their warming effects.
This amplification operates through a continuous, compounding feedback loop:
Initial Warming: Human activities release greenhouse gases, primarily through the burning of fossil fuels, which warms the atmosphere.
Increased Evaporation: A warmer atmosphere can hold more moisture. For every 1°C of warming, the atmosphere’s water-holding capacity increases by about 7%.
Amplified Greenhouse Effect: Water vapor is itself a greenhouse gas. As atmospheric moisture increases, it traps more of the heat radiated from Earth’s surface, producing additional warming. The result is a powerful feedback cycle: warming increases evaporation and atmospheric moisture; increased water vapor traps more heat; and that additional heat promotes further evaporation and moisture accumulation.
Water Vapor as a Warming Multiplier
Of the global warming experienced since 1990, water vapor is responsible for roughly half of it.
Water vapor did not start the fire, but it has helped make the fire burn hotter. Over the last 36 years, atmospheric water vapor has increased by roughly 5%, increasing the amount of outgoing thermal radiation retained by the climate system. In this sense, water vapor has effectively doubled the intensity of the warming driven by human fossil-fuel emissions.
To offset the warming effect caused by water-vapor amplification since 1990, human-driven greenhouse-gas emissions would have to drop by approximately 50% relative to our post-1990 accumulation rate.
The important distinction is that water vapor is primarily a feedback, rather than the initial forcing. Humans increase the concentration of long-lived greenhouse gases; the resulting warming changes the hydrological cycle; and water vapor then amplifies that initial warming.
That is what makes water vapor so important to understanding climate energy.
How Water Vapor Drives Extreme Weather
The impacts of increased atmospheric water vapor extend far beyond global temperature. They are expressed through some of the most disruptive forms of extreme weather.
The “Loaded Dice” Effect for Heavy Rainfall
Because the atmosphere holds roughly 5% more moisture today than it did in 1990, storms have a larger reservoir of water available to them. This changes the character of rainfall. The same storm systems can produce more intense and concentrated downpours, dramatically increasing the risk of flash flooding.
More atmospheric moisture means that when the atmosphere finally releases that stored water, the release can be extreme.
Supercharged Tropical Cyclones
Water vapor does not simply provide the raw material for rain; it also acts as fuel for tropical cyclones.
When water vapor condenses into liquid rain within a hurricane, it releases a massive amount of latent heat. This heat warms the surrounding air, causing it to rise faster and lowering surface pressure. The resulting pressure changes can intensify the storm’s circulation and increase wind speeds.
In other words, the same water cycle that supplies rainfall can also supply additional energy to powerful storms.
Atmospheric Rivers
Atmospheric rivers are narrow, thousands-of-miles-long plumes of intense moisture transport through the atmosphere—often described as “rivers in the sky.”
As global atmospheric moisture increases, these systems can transport enormous quantities of water. When they make landfall, particularly against mountainous terrain, they can produce extreme precipitation and catastrophic flooding.
California and the U.S. West Coast have experienced some of the most visible consequences of these powerful moisture-transport systems.
The Warm-Air / Dry-Soil Paradox
Perhaps one of the most important consequences of increased atmospheric moisture is the apparent paradox that a warmer, wetter atmosphere can contribute to both heavier rainfall and more severe drying.
When it is raining, additional atmospheric moisture can provide storms with more water to release. When it is not raining, warmer air increases evaporative demand. The atmosphere effectively acts like a stronger sponge, drawing moisture from soils and vegetation through evaporation and transpiration. The result can be accelerated drying between precipitation events.
This creates a volatile cycle:
More moisture → heavier rainfall → runoff and flooding → drying → increased evaporation → drought stress → wildfire risk.
The atmosphere can therefore move rapidly between extremes of water abundance and water scarcity.
The Regional Picture
The impact of increasing atmospheric moisture is not distributed evenly across the planet. While global average atmospheric moisture has risen by roughly 5% since 1990, individual regions can experience much larger changes.
Mid-latitude and coastal regions can experience particularly sharp increases in extreme one-day or hourly precipitation totals as warmer air and moisture-rich storm systems interact.
Arid inland regions can experience intensified evaporation without a corresponding increase in rainfall, worsening water scarcity and increasing drought stress.
This regional contrast is critical. Climate change is not simply making the planet “wetter” or “drier.” It is increasing the energy available to the hydrological cycle and, in many places, increasing the volatility between wet and dry extremes.
The Steam Engine Multiplier
Water vapor is therefore more than another greenhouse gas in the atmosphere. It is a dynamic component of Earth’s climate system that responds rapidly to temperature changes and feeds energy back into the system.
Carbon dioxide and methane provide much of the initial forcing from human activity.
Water vapor responds to that warming.
Then water vapor amplifies the warming.
That amplified warming alters evaporation, precipitation, soil moisture, storms, and atmospheric circulation.
Those changes can produce additional extremes, creating another layer of feedback throughout the Earth system.
The climate signal is consequently not simply a thermometer reading.
Water vapor is the steam engine multiplier: not the spark that started the process, but one of the mechanisms that can make the entire system run increasingly harder as the planet warms.
Climate Change, Groundwater Depletion, and the Emerging Water Crisis
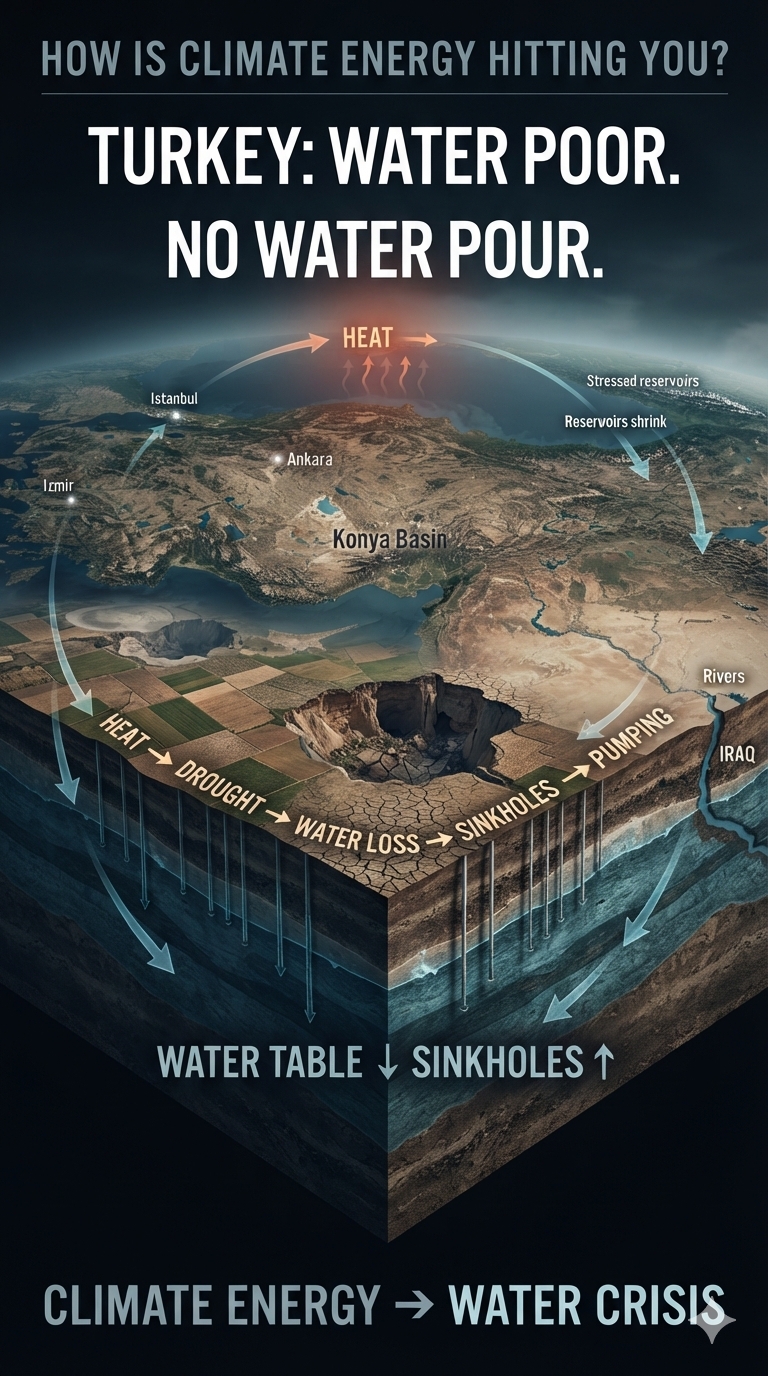
Türkiye is rapidly approaching a critical threshold at which it could officially become a water-poor nation by 2030, driven heavily by severe climate change and extensive groundwater mismanagement.
Located within the highly vulnerable Mediterranean Basin, Türkiye is experiencing plunging per-capita water availability, escalating drought, and an alarming 88 percent risk of nationwide desertification. The consequences extend far beyond water supplies. According to a climate assessment by the World Bank, a mere 10 percent reduction in water supply could cost the country 6 percent of its total GDP.
The emerging crisis illustrates how climate energy can propagate through an interconnected system: rising temperatures intensify drought; drought reduces surface water and reservoir replenishment; declining water supplies increase groundwater extraction; falling water tables destabilize the landscape; and the resulting agricultural, urban, and economic stresses compound one another.
Drivers of Water Poverty
Plunging Per-Capita Water Supply
The United Nations Convention to Combat Desertification warns that population growth combined with rising temperatures will push Türkiye into official water poverty within years.
As the population grows while available water supplies decline, the amount of water available per person continues to fall. Climate change compounds the problem by increasing evaporation, intensifying drought, and placing additional pressure on already limited freshwater resources.
Vanishing Natural Lakes
Environmental experts report that more than 75 percent of Türkiye’s lakes have completely dried up over the past 60 years.
The disappearance of natural lakes represents more than the loss of individual bodies of water. Lakes function as components of larger regional hydrological systems, storing water and supporting agriculture, ecosystems, and communities. Their disappearance is another visible indicator of a system under increasing water stress.
Diminishing Rainfall
Recurrent droughts occur every few years, causing critical declines in surface runoff and reservoir replenishment.
As precipitation becomes less reliable and temperatures rise, the same amount of rainfall can produce less usable water. Higher evaporation rates remove more moisture from soils, reservoirs, and landscapes, while shortened snowmelt cycles further alter the timing and volume of downstream water.
The Agriculture and Sinkhole Crisis
Groundwater Over-Extraction
As drought intensifies, farmers have increasingly turned to groundwater to sustain crops. An estimated 120,000 unlicensed wells have been dug to compensate for declining surface-water availability.
Groundwater therefore becomes a critical emergency reserve—but continued extraction faster than natural recharge transforms that reserve into a rapidly depleting resource.
Receding Water Tables
Heavy agricultural siphoning is causing underground water tables in central regions to decline by up to 16 feet annually.
This represents a profound alteration of the subsurface water system. As groundwater is removed faster than it can be replenished, the water table retreats deeper beneath the agricultural landscape.
Proliferating Sinkholes
The structural consequences are increasingly visible.
This underground depletion has contributed to the formation and collapse of more than 680 massive sinkholes across the crucial Konya Basin agricultural region.
The sinkholes provide a dramatic physical manifestation of the water crisis: what is being removed from beneath the landscape eventually manifests at the surface.
Urban and Geopolitical Strains
Stressed Mega-Cities
Major urban centers—including Istanbul, Ankara, and Izmir—face severe water scarcity as major reservoirs regularly fall below critical capacity.
The crisis is therefore not confined to rural agricultural regions. As water supplies tighten, cities must compete with agriculture, industry, ecosystems, and other demands for an increasingly constrained resource.
Downstream River Depletion
Shorter mountain snowmelt cycles are heavily reducing the natural volumes flowing into regional rivers.
Changes in snowpack and melt timing can disrupt the seasonal delivery of freshwater downstream, further stressing rivers, reservoirs, agriculture, and communities dependent upon predictable water flows.
Geopolitical Tensions
The water crisis also extends beyond Türkiye’s borders.
Restricted flows from dams on the Tigris and Euphrates rivers worsen severe water crises downstream in Syria and Iraq, according to The Water Project.
Water scarcity can therefore become a regional geopolitical problem, transforming climate-driven hydrological changes into competition among nations sharing increasingly stressed river systems.
The Climate-Energy Connection
Türkiye’s emerging water crisis demonstrates how climate energy does not remain confined to a thermometer reading.
Climate change increases the energy available to the atmosphere and intensifies the hydrological cycle. The resulting extremes can simultaneously increase evaporation, alter precipitation, accelerate snowmelt, reduce water availability, and increase demand for irrigation.
When human water consumption is added to those climate stresses, the system can move rapidly toward a critical threshold.
Water poor. No water pour.
For Türkiye, the question is no longer simply whether climate change will affect water availability. The emerging question is how quickly multiple water-related stresses can begin comingling and amplifying one another—and what happens when a nation’s agricultural, urban, economic, and geopolitical systems all depend upon the same shrinking resource.
Coastal Erosion, Property Loss & the Uninsurable Coast
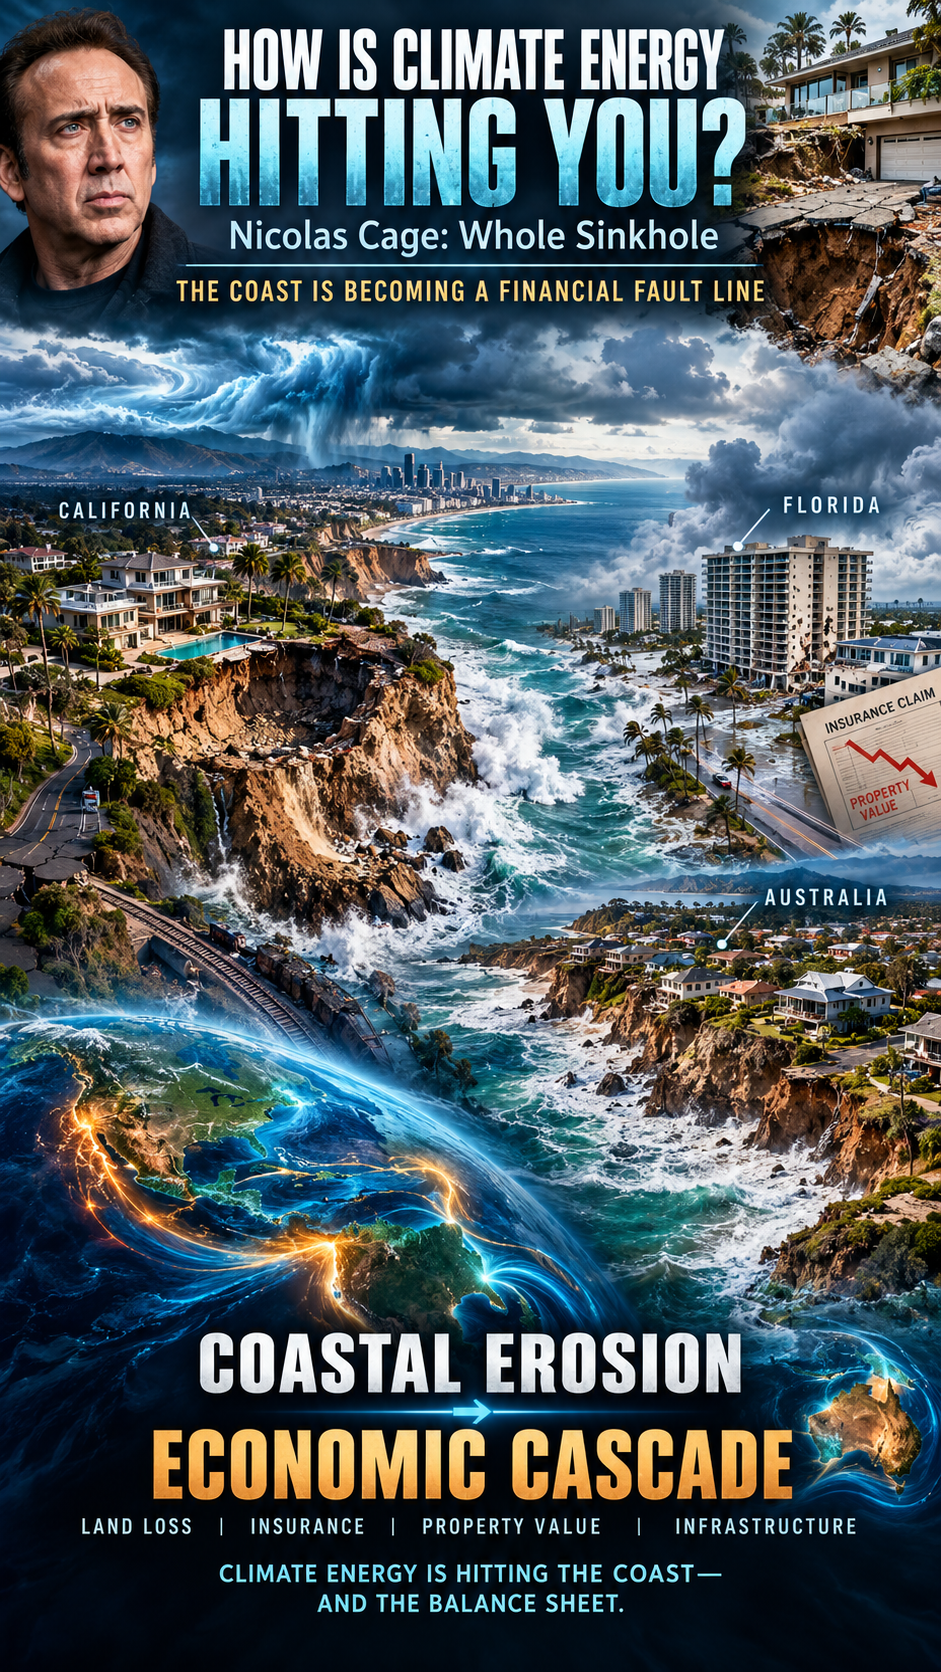
Nicolas Cage: Whole Sinkhole
On September 8, 2026, severe coastal erosion and high surf triggered by the aftermath of Hurricane Marie caused the driveway of Nicolas Cage’s $10.5 million beachfront mansion to completely collapse.
The resulting crater expanded to roughly 30 by 60 feet and plunged about 25 feet deep, swallowing the driveway, a construction-site portable restroom, and heavy concrete debris.
Powerful south swells, extreme high tides, and pounding waves from Tropical Storm/Hurricane Marie ate away at the coastline directly beneath the property.
The collapse ruptured a gas main, forcing utility crews to shut off natural gas along the street. Because the ground remained highly unstable, city officials declared a local state of emergency and red-tagged or ordered evacuations for roughly 30 surrounding homes. Fortunately, the home was unoccupied at the time, and no injuries were reported.
California’s Coastal Erosion
Climate change and coastal erosion are fundamentally reshaping California’s 1,100-mile coastline. What was once considered a slow-moving, long-term environmental shift has accelerated into a series of highly disruptive events, resulting in collapsing bluffs, shrinking beaches, and massive infrastructure vulnerabilities.
The severe impacts California is facing are driven by a combination of rising sea levels and intensifying ocean patterns.
1. Vanishing Beaches and the “Coastal Squeeze”
California’s famous sandy beaches are facing an existential crisis. The U.S. Geological Survey (USGS) estimates that 24% to 75% of California’s beaches could completely erode by the year 2100.
The Squeeze: Normally, a beach would naturally migrate inland as sea levels rise. However, much of California’s coast is experiencing a “coastal squeeze”: beaches are trapped between the rising ocean and human-made infrastructure such as seawalls, highways, and residential developments, leaving the sand nowhere to go.
Artificial Interventions: According to recent USGS satellite data, some Southern California beaches have artificially expanded, but this is entirely due to expensive human interventions, such as dredging and “beach nourishment” projects, rather than natural coastal resilience.
2. Sea Cliff Failures and Deadly Landslides
Roughly 70% of California’s coast is comprised of oceanfront bluffs and cliffs.
Increased Wave Attack: As baseline sea levels rise, waves strike the base of these cliffs more frequently and with greater force. This severely degrades their structural stability, triggering sudden and unpredictable cliff collapses and landslides.
Human and Property Risk: Bluff failures have turned deadly for beachgoers in areas such as Encinitas and San Francisco. They also pose an immediate threat to multi-million-dollar cliffside homes and vital transportation routes.
3. The “Triple Threat” of El Niño and Severe Storms
While climate change is steadily raising the global baseline sea level, seasonal weather anomalies can trigger immediate emergencies. Geomorphologists at the Scripps Institution of Oceanography warn that El Niño conditions create a devastating “triple threat”:
Elevated Ocean Height: El Niño patterns can temporarily push local sea levels up by an additional 6 to 13 inches. Combined with pre-industrial sea-level rise, this radically amplifies the baseline ocean height.
Powerful Swells: Stronger storms and intense wave energy eat away at protective sand berms at an accelerated rate.
Heavy Rain: Atmospheric rivers saturate coastal land, triggering landslides from the top down while waves batter the cliffs from the bottom up.
The compound effect of these forces was highly visible during recent extreme-weather events, which caused widespread flooding in Long Beach and massive coastal sinkholes in Malibu. Every 2 to 4 inches of sea-level rise effectively doubles coastal flood risks.
4. Compounding Economic and Ecological Damages
Infrastructure at Risk: The state’s Legislative Analyst’s Office estimates that $8 billion to $10 billion worth of existing property could be entirely underwater within the next few decades, with billions more at risk during high tides. Critical lifelines—including the Pacific Coast Highway and coastal rail links such as the Amtrak lines connecting San Diego to Los Angeles—frequently face service suspensions because of ground instability.
Ecological Degradation: California has already lost more than 60% of its historical coastal sand dune systems to development and erosion. This destroys critical habitats for native birds and mammals while removing the coastline’s natural buffer against storm surges.
Water Supply Risks: Rising tides put freshwater aquifers at risk of saltwater intrusion. Increased saltwater contamination in the Sacramento-San Joaquin Delta threatens the drinking-water supply for millions of Californians as well as adjacent agricultural land.
California’s Adaptive Strategy
In response, California passed legislation such as Senate Bill 272, requiring all local governments within the coastal zone to establish comprehensive sea-level-rise plans by January 1, 2034. Communities are forced to choose between “hard armoring”—building massive rock revetments and groins to hold back the sea—and “managed retreat,” the highly controversial process of moving structures and infrastructure entirely inland.
Florida Coastal Erosion
Florida is facing a systemic coastal real-estate crisis in which climate-driven physical erosion has collided with aggressive new legal and financial mandates.
The state is experiencing severe physical land loss, but the downstream financial impact—specifically skyrocketing condo fees, massive special assessments, and a plunging condo market—is reshaping the state’s housing economy.
Part 1: How Coastal Erosion Is Impacting Florida
Florida features a low-lying, highly vulnerable topography. Rising sea levels and climate-fueled hurricanes are causing severe coastline degradation.
Critical Erosion: The Florida Department of Environmental Protection has designated a majority of Florida’s coastline as facing “critical erosion risk.” Beaches and barrier islands are shrinking, eliminating natural buffers that protect buildings from storm surges.
Foundation Undermining: Storm surges and intense wave action systematically wash away sand beneath seawalls and structural slabs. Saltwater intrusion aggressively corrodes the steel rebar inside concrete foundations and parking garages, severely compromising structural integrity over time.
Boundary Shrinkage: Coastal erosion is shrinking the physical legal boundaries of private properties. By 2050, over 140,000 Florida properties are expected to be significantly altered by land loss.
Part 2: The Condo Crisis — Fees & Special Assessments
Historically, beachfront condo associations kept their Homeowners Association (HOA) fees artificially low by voting to “waive” reserve funding for long-term maintenance. The tragic 2021 collapse of Champlain Towers South in Surfside permanently ended this practice.
Following the disaster, Florida passed strict safety laws, including SB 4-D and subsequent updates such as HB 913, creating a financial perfect storm:
Mandatory Milestone Inspections: All buildings three stories or taller that reached 30 years of age—or 25 years if within three miles of the coast—were required to complete rigorous structural inspections. These inspections uncovered decades of hidden saltwater corrosion, concrete spalling, and foundation rot.
Structural Integrity Reserve Studies (SIRS): Associations must perform a SIRS to calculate the remaining lifespan of critical components such as roofs, foundations, and load-bearing walls.
The Ban on Waiving Reserves: Associations are strictly prohibited from waiving or underfunding reserves for structural items. They must collect the required cash.
The Financial Fallout
Six-Figure Special Assessments: Because buildings deferred maintenance for decades, unit owners are being hit with mandatory, one-time special assessments ranging from $50,000 to more than $400,000 per unit to pay for multi-million-dollar structural repairs.
Skyrocketing Monthly Fees: Regular monthly HOA fees have surged—sometimes by 20% to 50% in a single year—to cover ongoing reserve requirements and exploding commercial-property insurance premiums.
Surging Insurance Costs: Driven by storm damage and climate risk, many major private insurers have pulled out of Florida entirely. Condo buildings are forced onto high-cost, bare-minimum state-backed policies, adding thousands of dollars annually to an individual unit owner’s bottom line.
Part 3: Devastation of Real Estate Values
The financial strain of these assessments and fees has broken the economics of Florida condo ownership, resulting in a dramatic price correction along the coast.
The Mass Sell-Off: Fixed-income retirees and middle-class owners cannot afford a sudden $100,000 assessment or a doubling of their monthly dues. This has caused a massive influx of inventory as desperate owners try to unload their units before deadlines hit.
Evaporating Buyer Demand: Disclosures showing thousands of non-compliant buildings, paired with high risk, have terrified buyers. Buyers refuse to inherit pending six-figure structural repair bills, causing sales velocity to freeze.
Deep Price Disruption: According to market trackers, this massive supply glut and lack of demand has led to steep price drops for coastal condos. In stark contrast to single-family homes, aging coastal condos are seeing values plummet by 20% to 40%.
Coastal Gentrification: The ultimate trajectory is severe economic displacement. As middle-class owners are forced out, developers and wealthy buyers are buying up entire distressed buildings at steep discounts, either to demolish them or completely rebuild luxury projects out of pocket.
Australia Coastal Erosion
Over 250,000 Australian homes are at risk of coastal erosion, according to the “Rising Seas, Rising Bills” report published by the Climate Council on September 10, 2026.
Drawing on groundbreaking climate modeling from the University of Melbourne and the Australian National University, the report highlights the severe threat that rising sea levels and storm surges pose to Australia’s massive coastal population.
1. The Real Estate and Financial Risk
Properties Threatened: The report explicitly warns that more than 267,000 coastal properties—roughly a quarter of a million homes—are at risk of severe inundation and erosion damage by 2100.
The $855 Billion Economic Bill: Total economic losses are projected to hit at least $855 billion AUD by the end of the century. This includes $274.3 billion AUD in direct property damage, alongside $580.7 billion AUD in damage to farmland, nature reserves, and critical public infrastructure.
The Timeline: While 2100 is the benchmark for the worst damages, researchers stress that the economic shock waves will start crippling coastal real estate as early as 2040.
2. State-by-State Breakdown: Where Is Most Exposed?
The damage is not distributed evenly, with specific regions carrying extreme structural and financial burdens:
Queensland — 93,157 properties at risk: The worst-affected state by property count. The Gold Coast alone is officially named Australia’s most exposed urban area, facing a staggering $84.4 billion AUD in projected economic losses on its own.
New South Wales — 71,210 properties at risk: Communities in Northern NSW and the Central Coast are projected to experience far higher property losses than Greater Sydney.
Western Australia — 51,366 properties at risk: While it has fewer homes at risk than Queensland or New South Wales, Western Australia faces the highest overall financial loss, at $230.5 billion AUD, due to vast tracts of highly valuable coastal agricultural land that will be permanently lost to sea-level rise.
Victoria: Property losses are heavily concentrated in low-lying, densely populated urban areas around Melbourne’s Port Phillip Bay and the Yarra River.
3. The Uninsurable “Actions of the Sea”
Much like the condo crisis unfolding in Florida, Australia is facing a severe insurance reckoning.
The Exclusion Clause: Most standard private insurers in Australia explicitly exclude coverage for “actions of the sea.” This means regular ocean tidal flooding, steady coastal erosion, and sea-level rise are completely uncovered.
The Cost Burden: When a storm surge destroys a foundation or a cliff collapses, property owners will largely be forced to bear the multi-million-dollar stabilization or relocation costs entirely on their own. Experts warn that this will trigger massive drops in property values and result in “uninsurable” coastal ghost zones.
The Coast Is Becoming a Financial Fault Line
From California to Florida to Australia, coastal erosion is no longer simply a problem of disappearing sand or retreating shorelines. It is becoming a cascading climate-energy problem that reaches directly into property values, insurance markets, infrastructure, ecosystems, and household finances.
The Nicolas Cage sinkhole provides a dramatic example of how quickly coastal instability can turn an expensive piece of real estate into a dangerous hole in the ground. California demonstrates the growing physical vulnerability of beaches, cliffs, transportation corridors, and freshwater resources. Florida shows how physical climate risks can cascade into insurance crises, special assessments, and collapsing real-estate economics. Australia demonstrates how the same process can scale into a national financial exposure measured in hundreds of billions of dollars.
The underlying lesson is straightforward: coastal climate risk does not stop at the water’s edge.
As sea levels rise and extreme coastal events intensify, the physical loss of land can propagate through the economic system. Erosion undermines structures. Structural damage increases repair costs. Repair costs increase insurance premiums and assessments. Insurance becomes unavailable or unaffordable. Properties lose value. Buyers disappear. Communities face declining tax bases and increasingly expensive infrastructure protection.
What begins as coastal erosion can therefore become a cascading economic feedback.
Climate energy is hitting the coast—and increasingly, it is hitting the balance sheet.
Indonesia’s Orangutans and the Peatland Carbon Bomb
Indonesia is experiencing a dangerous convergence of climate stress, extreme drought, human land-use change, and wildfire across Sumatra and Borneo. As of September 2026, satellite observations indicate that more than 200,000 hectares have burned, releasing enormous quantities of greenhouse gases while blanketing large portions of Southeast Asia in toxic smoke and haze.
For Indonesia’s orangutans, this is more than a wildfire crisis. It is an accelerating ecosystem crisis in which climate change, drought, deforestation, and peatland destruction reinforce one another.
The Climate Change Feedback Loop
Climate change does not have to ignite a wildfire to make a fire catastrophe more likely. Instead, warming can intensify the environmental conditions that allow fires to spread, burn longer, and become increasingly difficult to control.
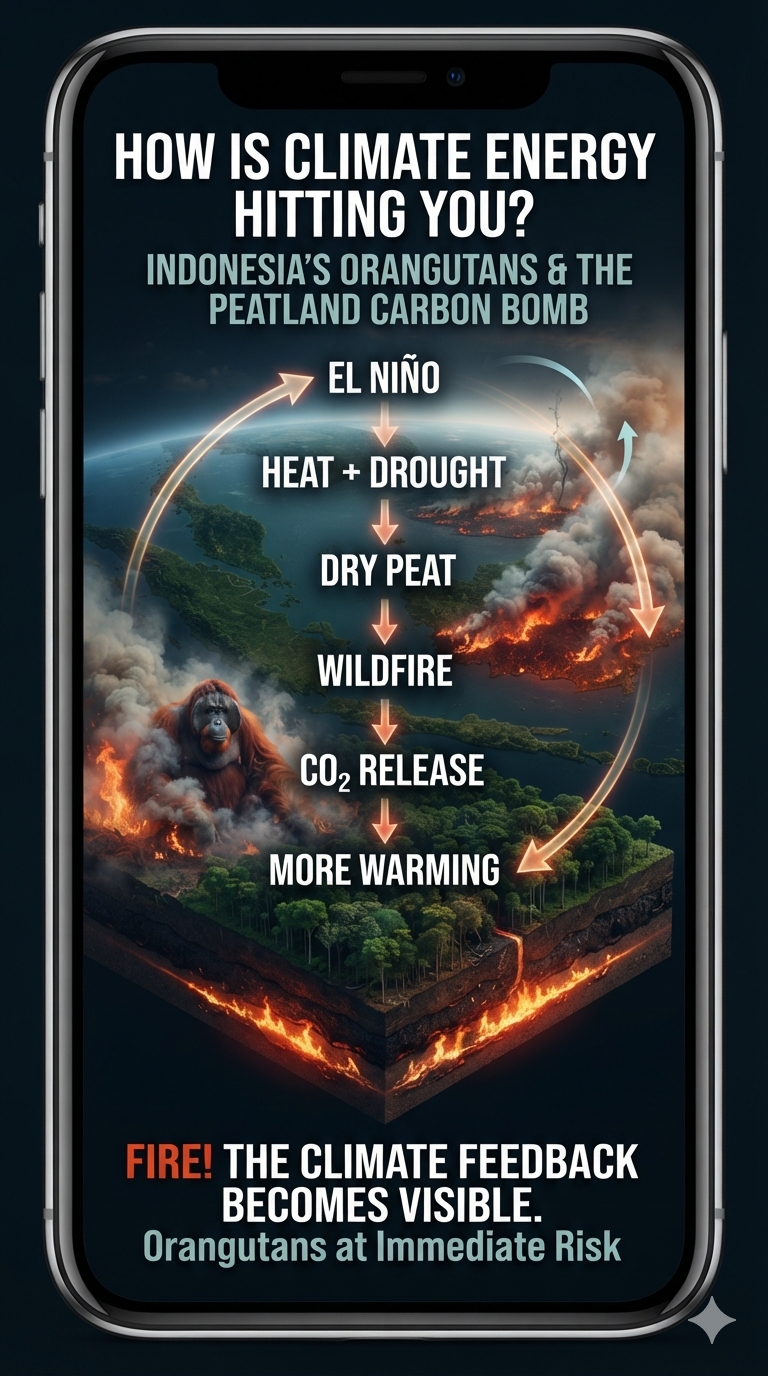
Indonesia’s recurring dry seasons are strongly influenced by natural climate variability, particularly El Niño. But a warmer climate can load the system with additional heat and alter the background conditions under which these natural cycles operate. During an exceptionally strong El Niño, prolonged drought and extreme heat can turn already vulnerable landscapes into tinderboxes.
That becomes particularly dangerous in Indonesia’s peatlands.
The Peatland Carbon Bomb
Indonesia contains vast tropical peatlands—wetlands formed from layers of partially decomposed organic material accumulated over thousands of years. When these ecosystems remain saturated, the waterlogged peat is relatively resistant to burning.
But decades of drainage and conversion for agriculture, palm-oil production, pulpwood plantations, roads, and other development have transformed many peatlands into something fundamentally different: enormous stores of carbon sitting above the water table.
Once dried, peat can ignite and continue smoldering underground. A surface fire may disappear while combustion continues below ground, allowing fires to persist for weeks or months and re-emerge far from the original ignition point.
Peat fires are also major sources of fine particulate pollution, creating severe health impacts across Indonesia and neighboring countries. Unlike an ordinary forest fire, a peat fire can continue consuming carbon-rich soil beneath the surface, releasing greenhouse gases long after the visible flames have disappeared.
From Forest Fire to Climate Feedback
The significance extends far beyond the individual fire.
When forests and peatlands burn, carbon that had been stored in vegetation and soil for centuries or millennia is rapidly transferred into the atmosphere. The resulting greenhouse-gas emissions contribute to additional warming, while the loss of forest reduces the ecosystem’s capacity to store carbon in the future.
This creates another reinforcing loop:
Forest and peatland destruction → carbon release → atmospheric warming → greater drought and heat stress → increased fire vulnerability
The system can therefore begin amplifying itself.
The Orangutan Connection
Orangutans are among the most visible casualties of this feedback system. Their remaining habitat is concentrated primarily in the forests and peatlands of Borneo and Sumatra. When these landscapes are cleared, drained, fragmented, or burned, orangutans lose not simply individual trees but entire interconnected ecosystems on which their survival depends.
Fire can kill animals directly, separate populations, destroy food sources, and further fragment already shrinking habitat. Smoke and prolonged drought add additional stress.
The orangutan therefore provides a remarkably tangible way to understand climate energy.
The heat accumulating in the Earth system does not remain an abstract number on a graph. It manifests through drought, altered rainfall, drying wetlands, wildfire, habitat destruction, ecosystem collapse, and ultimately the loss of living organisms.
A Global Feedback
The danger does not end at Indonesia’s borders.
Between September 1 and September 7, 2026, reported wildfire emissions were estimated to have increased dramatically, with approximately 19.7 million tons of carbon dioxide released during that period. If confirmed, such emissions demonstrate how rapidly a regional ecological disturbance can become part of the global climate system.
Indonesia’s peatlands are effectively biological carbon reservoirs. When they remain wet and intact, they help keep carbon out of the atmosphere. When they are drained and burned, they can become carbon sources instead.
That is the paradox of the peatland carbon bomb:
The ecosystem that once stored carbon becomes an engine for releasing it.
Climate Energy Is Coming Back Around
This is what makes Indonesia’s wildfire crisis so important in understanding climate change.
Climate energy moves through the Earth system. The atmosphere warms. Oceans redistribute enormous quantities of heat. Atmospheric circulation changes. Drought and precipitation patterns shift. Vegetation becomes stressed. Wetlands dry. Fire releases stored carbon. Carbon dioxide and other greenhouse gases increase atmospheric energy retention.
The process is not a simple straight line from warming to fire.
It is a feedback system.
Warming → drought → fire → carbon release → more warming → greater vulnerability
And in Indonesia, that feedback is colliding with one of the planet’s most biologically important ecosystems.
The orangutan is not separate from the climate system.
Neither is the peat beneath its feet.
The fire is where the climate feedback becomes visible.
🏔️ SIMPLIFIED INTRODUCTION: MOUNTAIN GLACIERS AT THE EDGE
Mountain glaciers are disappearing faster.
But the bigger danger may be what happens to the mountains when the ice disappears.
Record global heat and the powerful 2023–2024 El Niño helped drive extraordinary glacier mass loss worldwide. Now, with another potentially powerful El Niño developing against an already overheated climate, the consequences extend far beyond shrinking glaciers.
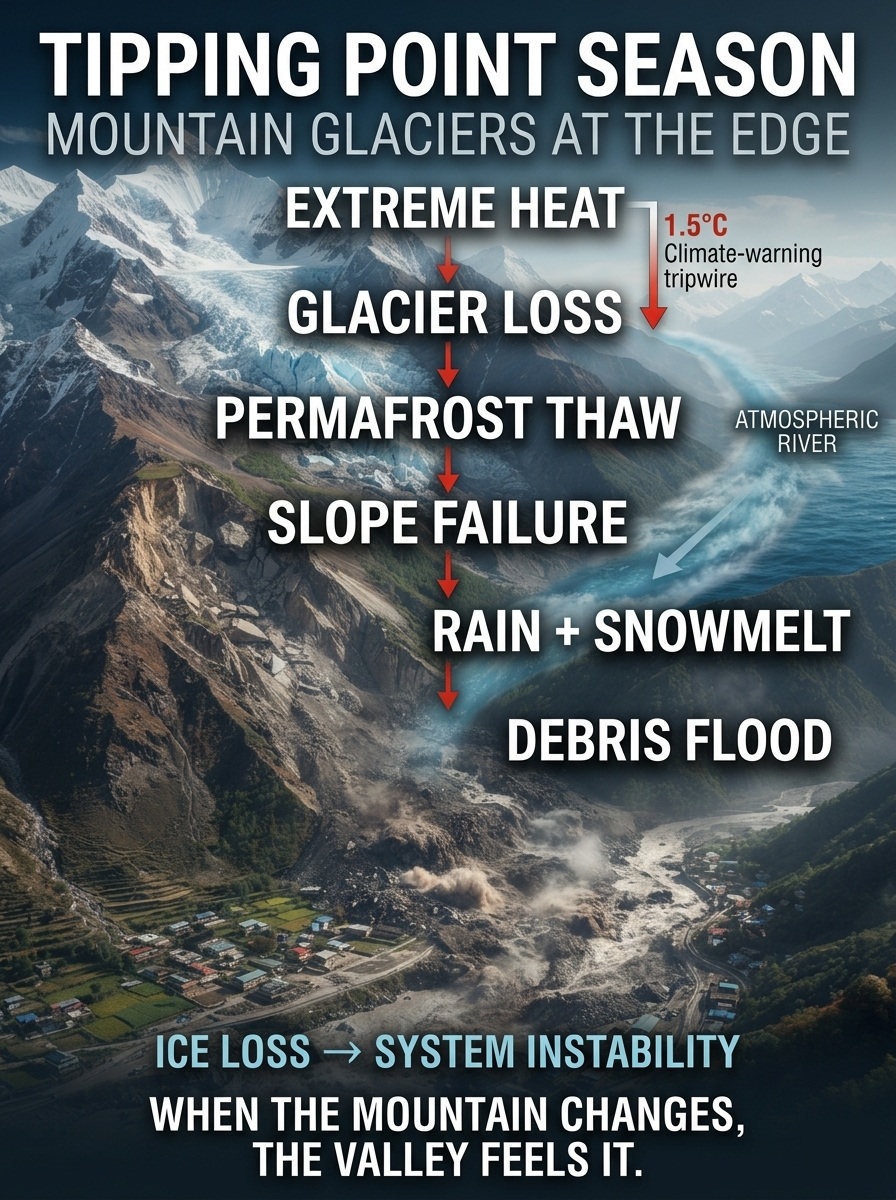
Extreme heat melts glacier ice.
Permafrost thaws.
Mountain slopes weaken.
Rain replaces snow.
Atmospheric rivers deliver enormous amounts of water.
Landslides block rivers.
Temporary lakes form.
And those lakes can suddenly burst downstream.
The danger is no longer simply ICE LOSS.
It is SYSTEM INSTABILITY.
This is what happens when multiple climate-sensitive systems begin moving together—and feedbacks start turning one disturbance into another.
Tipping Point Season: Mountain Glaciers at the Edge
The mountain isn’t just losing ice.
The mountain is changing.
The Full Report
The combination of the powerful 2023–2024 El Niño and record-breaking global heat severely accelerated the loss of mountain glaciers worldwide, producing some of the largest glacier mass-balance deficits ever recorded. What makes this period particularly important is not simply the amount of ice being lost, but the way extreme heat, altered precipitation, permafrost thaw, and increasingly volatile hydrology are beginning to interact across high-mountain environments.
2023–2024: A Global Glacier Mass-Loss Shock
Data compiled by the World Glacier Monitoring Service (WGMS) and the United Nations illustrate the extraordinary scale of recent glacier deterioration. The compounding effects of human-induced climate change and the 2023–2024 El Niño contributed to exceptionally severe melting conditions.
Record-breaking global mass loss
During the 2023 hydrological year, glaciers experienced a record-breaking global mass loss equivalent to approximately 1.1 meters of ice thickness. The total loss was roughly 600 gigatons of water, making 2023 the largest annual glacier mass loss recorded since systematic measurements began in 1976.
The deterioration continued in 2024. The 2024 hydrological year ranked as the fourth-worst year on record, with glaciers losing another approximately 450 billion tonnes of ice. It also marked the third consecutive year in which all 19 glacier regions monitored globally experienced a net mass loss.
The significance of these numbers extends beyond the glaciers themselves. Mountain glaciers function as frozen reservoirs, storing water that is gradually released into downstream river systems. Their rapid depletion therefore represents both a cryospheric transformation and a growing threat to water security, ecosystems, agriculture, hydropower, and communities downstream.
Tropical Glaciers: Exceptionally Vulnerable
Tropical glaciers, particularly those in the Andes and Indonesia, are exceptionally sensitive to changes in precipitation and temperature. The 2023–2024 El Niño amplified those vulnerabilities.
In the Peruvian Andes, research on the Quelccaya Ice Cap has shown how El Niño can suppress wet-season snowfall, replacing it with warmer and drier conditions. Fresh snow normally provides a highly reflective surface that returns much of the incoming solar energy back to space. When snowfall fails and bare glacier ice is exposed, the darker surface absorbs substantially more solar energy.
This creates a powerful feedback: less snowfall means less reflective snow cover; less reflective snow means greater absorption of solar energy; greater energy absorption accelerates melting and exposes still more bare ice.
Indonesia’s Puncak Jaya glaciers face an even more precarious future. These rare tropical glaciers were already critically endangered, and drought and temperature anomalies associated with El Niño accelerated the timeline toward potential disappearance.
European Alps and North American Ranges
El Niño does not directly control the climate of every mountain region. Its effects are superimposed on a much larger background trend of human-driven global warming.
In the European Alps, persistent and intense summer heatwaves produced severe glacier degradation. Melting occurred even at elevations above approximately 3,100 meters—heights that historically provided substantially greater protection from summer heat.
The North Cascades of the United States experienced a similar pattern. In areas such as North Cascades National Park, monitored glaciers continued to lose mass through both 2023 and 2024, consistent with a broader regional trend in which glacier melt rates have increased dramatically over recent decades.
The important signal is therefore not simply that glaciers are retreating. It is that the elevation, duration, and intensity of melting are changing. Ice that once remained protected through the summer is increasingly being exposed to temperatures capable of transforming both the surface and the internal structure of mountain glaciers.
The 2023–2024 Glacier Signal
Metric / Region
Impact from 2023–2024 Heat and El Niño
Global Mass Loss
2023 was the worst year on record, with approximately 600 Gt of ice lost. 2024 ranked fourth-worst. All 19 monitored glacier regions experienced net loss.
Tropical Glaciers
Reduced seasonal snowfall combined with extreme heat exposed darker bare ice, accelerating thinning and shortening extinction timelines.
Mid-Latitude Glaciers
Extreme high-elevation temperatures pushed the melt zone upward, exposing previously protected ice to rapid melting, fracturing, and structural deterioration.
Sea-Level Contribution
Glacier mass loss adds freshwater directly to the oceans, compounding sea-level rise driven by thermal expansion and other sources.
But the story does not end with glacier retreat.
The more consequential question is what happens when a warming atmosphere begins to destabilize the mountains surrounding and supporting those glaciers.
2026–2027: From Glacier Loss to Mountain Instability
The emerging 2026–2027 El Niño is occurring against an already unprecedented background of global warming. If the event develops with the exceptional strength currently being discussed, its influence will not be confined to ocean temperatures or atmospheric circulation.
High-mountain environments are particularly vulnerable because they sit at the intersection of several climate-sensitive systems: glaciers, snowpack, permafrost, steep rock faces, atmospheric circulation, and rapidly responding river networks.
The result can be a chain reaction in which one disturbance increases the probability or severity of another.
1. The Nepal–Tibet Glacial Collapse
The catastrophic disaster reported along the Nepal–Tibet border on August 26, 2026, provides a stark example of how extreme heat can intersect with high-altitude geological instability.
A massive section of glacier collapsed at approximately 5,200 meters, triggering an enormous avalanche of ice, rock, and mud that moved into the Trishuli and Bhotekoshi River valleys. The resulting destruction affected communities and critical infrastructure, including hydropower facilities and border transportation routes.
The thermal environment preceding the collapse is particularly significant. Meteorological analysis reportedly found prolonged and exceptional warmth at the elevation of the glacier, with temperatures averaging approximately 5°C (41°F) over a six-day period. Such temperatures are extraordinary at 5,200 meters and illustrate how extreme atmospheric warmth can penetrate environments historically protected by elevation.
The lesson is larger than a single glacier failure.
When temperatures rise far enough, high altitude is no longer the same form of protection it once was.
2. Feedback Mechanism: Permafrost Thaw and Slope Failure
Glacier retreat is only one component of high-mountain destabilization. Permafrost provides another critical structural control.
Permafrost consists of permanently frozen soil, rock, and ice. In steep mountain terrain, frozen water can act as a form of geological glue, binding fractured rock and stabilizing slopes.
Extreme warming attacks that structural support.
As temperatures rise, permafrost can thaw progressively deeper into mountain slopes. Ice within fractures melts, reducing the cohesion between rock surfaces. Water can then penetrate deeper into the fractured rock, while repeated freeze-thaw cycles and changing hydraulic pressures further weaken the structure.
The result can be slope failure.
A destabilized glacier, hanging ice mass, or fractured rock face may collapse as a single event, but the material released does not necessarily remain an avalanche of ice. It can entrain enormous quantities of rock, soil, sediment, and meltwater.
What begins as a glacier or rock failure can therefore become a high-speed debris flow or mudslide carrying millions of tonnes of material downstream.
This is a critical transition: climate change is not simply removing ice from mountains; it can alter the mechanical stability of the mountains themselves.
El Niño reorganizes global atmospheric circulation and changes the distribution of heat and moisture across the planet. Warmer ocean surfaces provide greater evaporation potential, increasing the amount of water vapor available to the atmosphere.
That additional atmospheric moisture can feed powerful atmospheric rivers—long, narrow corridors transporting enormous quantities of water vapor.
When these systems encounter mountain ranges, the consequences can become extreme.
Instead of falling as snow, warm atmospheric rivers can produce rain at elevations that historically received substantial snowfall. This creates a particularly dangerous combination: rain-on-snow events occurring simultaneously with already accelerated glacier and snowpack melt.
4. The Hydro-Thermal Double Whammy
Rain falling on snow and ice does more than add water.
Rain transfers sensible and latent heat directly into the snowpack and glacier surface. At the same time, the enormous volume of rainfall can rapidly increase runoff.
The result is a hydro-thermal double whammy:
Heat accelerates melting while water accelerates runoff.
Mountain drainage systems can become overwhelmed as rainfall, snowmelt, and glacier melt converge. Steep terrain magnifies the response, sending water and sediment rapidly into narrow valleys.
If landslides or debris flows block those valleys, temporary lakes can form behind natural dams of rock, ice, and sediment. Such impounded water can subsequently breach the blockage, generating devastating downstream floods, including glacial lake outburst floods (GLOFs).
One climate disturbance can become a cascade of physical disturbances.
The Compounding Cycle of Mountain Hazards
Climate Driver
Direct Physical Change
Resulting Environmental Hazard
Record Ambient Heat
Extreme high-elevation temperatures accelerate surface melting and weaken glacier structures.
Rapid ice loss, glacier destabilization, and structural collapse.
Permafrost Thaw
Ice binding rock and soil begins to melt, weakening the mountain’s internal structure.
Whole-slope failures, massive rockfalls, and debris-laden mudslides.
El Niño–Driven Moisture
Warmer oceans increase evaporation and atmospheric moisture availability.
More powerful atmospheric rivers and extreme precipitation events.
Rain-on-Snow Events
Warm rainfall adds heat and water directly to mountain snow and ice.
Accelerated melt, rapid runoff, flooding, and landslides.
Cascading Hydrology
Landslide and debris-flow material blocks narrow river channels.
Temporary lakes and potentially catastrophic glacial lake outburst floods.
Tipping Point Season
The most important signal may therefore not be the disappearance of an individual glacier.
It may be the increasing synchronization of multiple mountain processes.
Glacier loss changes surface reflectivity and water storage. Permafrost thaw weakens mountain slopes. Extreme heat raises the elevation of the melt zone. Atmospheric rivers deliver greater quantities of warm precipitation. Rain-on-snow events accelerate runoff. Landslides alter river channels. Temporary lakes form behind unstable debris dams. Those lakes can subsequently fail.
Each process can amplify another.
This is what makes mountain glacier loss a potential tipping-point problem. The danger is not necessarily one dramatic threshold at which a glacier suddenly disappears. The danger is a system in which multiple thresholds are approached simultaneously, feedbacks proliferate, interactions strengthen, and individual disturbances begin producing consequences far beyond their original location.
The mountain system becomes increasingly nonlinear.
A glacier that once functioned primarily as a frozen reservoir can become a source of floodwater. Permafrost that once stabilized a mountain slope can become a liability when it thaws. Snow that once stored water safely through the winter can become a mechanism for rapid runoff when warm rain falls on it. A landslide that once would have been a localized geological event can block an entire river and create a secondary flood disaster.
The result is a shift from ice loss to system instability.
That may be the larger lesson of Tipping Point Season: climate change is not simply making glaciers smaller. It is changing the physical relationships among ice, rock, water, atmosphere, and gravity.
And when those relationships begin changing together, the mountain can stop behaving like the mountain we knew.