bookmark_borderSpotify and the Music Business

by Daniel Brouse

I’ve been seeing a lot of misleading posts about Spotify, so I wrote a little research paper on the topic. Mind you, as one of the inventors of streaming and downloadable music in 1994, I never supported Spotify nor YouTube, etc. I don’t like artists having to share their publishing; however, Spotify isn’t the one sharing your revenues — the company that you use to publish on Spotify is. In any event, here is the paper:

Introduction
I tried revolutionizing the music business back in the 1990s when I was one of the first to put my record company on the web. We pioneered pay-per-download and subscription streaming services, effectively dismantling the criminal syndicate of traditional music distribution. Now, with AI individual musicians can record and produce their music at a fraction of the cost and distribute it freely online. This process, which used to cost a minimum of $200,000 for an artist, was often fronted by a record company. However, most artists never managed to repay these advances, and under restrictive contracts, they couldn’t record or perform their music again. It was a disheartening industry to be part of, but today, it feels like a dream come true.

Spotify Misconceptions
Daniel Ek, CEO of Spotify, has not accumulated his wealth directly from artists, but rather through the success and growth of the Spotify platform. It’s important to understand the broader context of Spotify’s financial journey and its impact on the music industry.

Financial Context and Profitability

  • Spotify’s Financial Journey: Spotify, founded in 2006 by Daniel Ek and Martin Lorentzon, initially struggled to turn a profit. It wasn’t until recent years that Spotify started to see profitability. As of 2021, Spotify reported its first annual operating profit, demonstrating the company’s progress in managing its costs and increasing its revenue streams【source】.

Impact on Artists

  • Payment to Artists: Spotify provides a platform where artists, especially those without major label backing, can distribute their music to a global audience. While the payment per stream has been a point of contention, it has enabled many independent artists to gain visibility and earn from their music. Without platforms like Spotify, many of these artists might not have had the opportunity to reach such a wide audience【source】.

Criticism and Misconceptions

  • Vilification of Spotify: Criticizing Spotify for its payment model overlooks the benefits it has brought to the music industry. The platform has democratized music distribution, giving artists from all backgrounds a chance to be heard. This is a significant shift from the traditional model where only artists signed to major labels had a realistic chance of reaching a large audience【source】.
  • Oversupply of Music: The Spotify payout system is influenced by the enormous supply of music available. If millions of artists reduced the frequency of their uploads and avoided tactics like putting their tracks on repeat overnight, the payouts could potentially reflect a more balanced and fair distribution of revenue. To be fair, artists should avoid listening to their own music on Spotify.

Alternative Perspective

  • User Choice: If consumers disagree with Spotify’s model, they have the freedom to choose other platforms. However, it’s important to recognize the role Spotify has played in transforming the music industry and providing new opportunities for artists.

PART II
The music industry has seen a dramatic shift in the supply and demand curves. This change started in the 1990’s. In 1994, we introduced the first subscription streaming/download service in the world. By 1995, we had introduced the first pay-per-download service. At that time we were the first company to accept credit card payments after dealing directly with FirstData (Mastercard/Visa). By 1997, we determined it was more economical to give the music away for free. By 2000, we had over 40,000 songs in our catalog that are free to download/stream. BMI, ASCAP, and the RIAA all tried to stop us. They failed. It was during this time that Napster and other peer-to-peer services also made free music available. Spotify was the music industry’s answer.

Here is a summary of the economics:
The music industry has experienced a dramatic shift in its supply and demand curves since the 1990s. This transformation began in 1994 with the introduction of the first subscription streaming and download service, followed by the first pay-per-download service in 1995. These services were pioneering in their acceptance of credit card payments, facilitated through direct dealings with FirstData (Mastercard/Visa).

By 1997, it became evident that offering music for free was more economical, leading to a catalog of over 40,000 songs available for free download and streaming by 2000. Despite efforts from BMI, ASCAP, and the RIAA to halt these operations, they were unsuccessful. Concurrently, peer-to-peer services like Napster emerged, making free music widely accessible. Spotify later became the music industry’s response to this disruption.

The underlying economics of the music business shifted significantly, driven mainly by changes in the supply curve rather than demand. While demand for music has remained relatively stable, the advent of digital distribution allowed millions of new artists to release their music, dramatically increasing the supply. This surge in supply caused the price of music to plummet to near zero. Consequently, the reduction in music prices is not the fault of Spotify or any other platform, but rather a result of the vastly increased supply of music available online.

KingArthur.com
membrane.com

Conclusion

Vilifying Spotify for its business model can be seen as naive and a mistake, considering the platform’s contributions to the music industry. It has enabled countless artists to distribute their music widely and earn revenue, something that would have been much harder to achieve through traditional means. The Spotify payout is influenced by the vast supply of music. If millions of artists reduced the amount of music they upload and stopped using tactics like putting their tracks on repeat overnight, the payouts could be higher, reflecting a fairer distribution of revenue.

Sources

bookmark_borderConvincing a Climate Change Denier of Reality

By Daniel Brouse

Our climate model uses chaos theory in an attempt to adequately account for humans and forecasts a global average temperature increase of 9 degrees Celsius above pre-industrial levels. Everybody has the responsibility not to pollute. There are plenty of things you can do to help save the planet. Stop using fossil fuels. Consume less. Love more. Here is a list of additional actions you can take.

Convincing a climate change denier of the reality and urgency of the climate crisis can be challenging, but a strategic approach using clear, relatable, and credible information can be effective. Here are some steps to consider:

1. Personalize the Impact

People are often more convinced by information that directly affects them or their loved ones.

Example:

  • Extreme Weather Events: Discuss recent extreme weather events, such as the record heatwaves, wildfires, or hurricanes, and how these events have affected their local area or places they care about. Use data and visuals to show the increasing frequency and intensity of these events.
  • Health Impacts: Explain how climate change is affecting air quality, leading to respiratory issues, allergies, and other health problems. Highlight any local air quality alerts and their impacts on health.

2. Present Credible Scientific Evidence

Use data and statements from reputable scientific organizations and experts.

Example:

  • IPCC Reports: Refer to the Intergovernmental Panel on Climate Change (IPCC) reports, which are comprehensive reviews by thousands of scientists worldwide. Highlight key findings that show the human influence on climate change.
  • NASA and NOAA: Use data from NASA and the National Oceanic and Atmospheric Administration (NOAA) that show trends in global temperatures, sea-level rise, and shrinking ice sheets.

3. Economic and Security Arguments

Frame climate change in terms of its economic and national security impacts, which can be more persuasive for some individuals.

Example:

  • Economic Costs: Discuss the financial impact of climate change-related disasters. For instance, the billions of dollars spent on recovery from hurricanes, floods, and wildfires.
  • Job Creation: Highlight how investing in renewable energy and green technologies can create jobs and drive economic growth.
  • National Security: Cite statements from defense agencies and experts who warn that climate change poses significant risks to national and global security, leading to conflicts over resources and mass migrations.

4. Visual Evidence

Visuals can be more powerful than words. Use before-and-after images, graphs, and videos to illustrate the changes in the environment.

Example:

  • Glacier Retreat: Show time-lapse images of glaciers shrinking over the past few decades.
  • Sea Level Rise: Use maps and simulations that show the impact of rising sea levels on coastal communities.

5. Testimonials and Personal Stories

Personal stories from people affected by climate change can be very compelling.

Example:

  • Farmers and Fishermen: Share stories from farmers who are experiencing changes in growing seasons and crop yields or fishermen who are seeing changes in fish populations.
  • Residents of Impacted Areas: Use testimonials from residents of areas hit by severe weather events or rising sea levels.

6. Addressing Misconceptions

Directly address common misconceptions with clear, factual explanations.

Example:

  • Climate vs. Weather: Explain the difference between weather (short-term) and climate (long-term trends). Use analogies like comparing the daily fluctuations of the stock market (weather) to long-term economic growth (climate).
  • Historical Climate Change: Clarify that while the Earth’s climate has changed in the past, the current rate of change is unprecedented and largely driven by human activities.

References

  1. IPCC Reports
  2. NASA Global Climate Change
  3. NOAA Climate

Example Conversation

  • You: “Have you noticed how our summers are getting hotter and the winters less predictable? That’s climate change in action. Scientists from NASA and NOAA have been tracking these changes for decades.”
  • Denier: “But the climate has always changed.”
  • You: “True, but the rate at which it’s changing now is much faster. For example, the IPCC report shows that the current warming is about ten times faster than the average rate of ice-age-recovery warming. And it’s largely due to human activities like burning fossil fuels.”

By combining personal relevance, credible scientific evidence, economic implications, visual aids, personal stories, and addressing misconceptions, you can create a compelling argument to help a climate change denier understand the reality and urgency of the issue.

Some people appear numb or compassion-less about climate change for several reasons:

Psychological Distance

  1. Temporal Distance:
    • People perceive climate change impacts as happening in the distant future, reducing their sense of urgency and immediate concern .
  2. Spatial Distance:
    • Climate change effects are often seen as occurring in far-off places, affecting other people rather than one’s immediate environment .
  3. Social Distance:
    • Individuals might think climate change primarily impacts people who are different from them, such as those in different countries or socio-economic groups .

Cognitive Dissonance and Denial

  1. Cognitive Dissonance:
    • Confronting the reality of climate change can create psychological discomfort due to the conflict between awareness of the problem and the continuation of behaviors contributing to it. This can lead to denial or downplaying of the issue to reduce this discomfort .
  2. Denial and Defense Mechanisms:
    • Some people use denial as a defense mechanism to avoid the anxiety and fear associated with the overwhelming nature of climate change .

Lack of Awareness and Misinformation

  1. Information Deficit:
    • A lack of understanding or misinformation about climate change can lead to apathy. Many people might not fully grasp the science behind climate change or the severity of its impacts .
  2. Misinformation:
    • The spread of false information and climate change denial campaigns can confuse the public and diminish the perceived importance of the issue .

Psychological Barriers

  1. Perceived Inefficacy:
    • Feelings of helplessness or the belief that individual actions cannot make a difference can lead to disengagement. When people feel their efforts are futile, they are less likely to care or act .
  2. Optimism Bias:
    • Some individuals believe that technological advancements or future solutions will solve the problem without requiring immediate personal or societal changes .

Socio-Political Influences

  1. Political Ideology:
    • Political beliefs and affiliations significantly influence one’s stance on climate change. Conservative ideologies often correlate with skepticism about climate change, influenced by party lines and media sources .
  2. Economic Concerns:
    • Fear of economic repercussions, such as job losses in certain industries, can lead to resistance against acknowledging or addressing climate change .

Social Norms and Peer Influence

  1. Social Norms:
    • People tend to conform to the beliefs and behaviors of their social group. If climate change concern is not a norm within their community, they are less likely to prioritize it .
  2. Peer Influence:
    • The attitudes of peers and influential figures in one’s life can significantly impact one’s views on climate change. Lack of concern among peers can lead to similar attitudes .

References

  1. PsyPost – Temporal distance reduces concern about climate change
  2. Environmental Research Communications – Spatial distance affects climate change risk perception
  3. Climate Outreach – Climate change and social distance
  4. American Psychological Association – Cognitive Dissonance and Climate Change
  5. Psychology Today – Denial and Climate Change
  6. National Geographic – Lack of knowledge and climate change
  7. Nature – Misinformation and Climate Change
  8. ScienceDirect – Perceived Inefficacy and Climate Change
  9. Pew Research Center – Optimism Bias and Climate Change
  10. The Guardian – Political Ideology and Climate Change
  11. Forbes – Economic Concerns and Climate Change
  12. Journal of Environmental Psychology – Social Norms and Climate Change
  13. Harvard Business Review – Peer Influence and Climate Change

The Human Induced Climate Change Experiment

bookmark_borderUnderstanding Straight-Line Winds and Climate Change

By Daniel Brouse
May 18, 2024

Weather Like the Deadly Houston Windstorm Is Being Fueled in Part by Climate Change

Scientists have detected an increase since the 1980s in what are known as straight-line winds, and climate change is playing a significant role. These winds, which are often associated with severe thunderstorms, can reach speeds exceeding 100 mph and cause damage similar to that of a tornado, but they move along a straight path.

Understanding Straight-Line Winds

Straight-line winds, also known as derechos when they cover a particularly large area, are powerful, sustained winds that originate from downdrafts in thunderstorms. Unlike the rotating winds of a tornado, straight-line winds blow in a single direction, hence their name. These winds can flatten trees, knock down power lines, and cause extensive damage to buildings and infrastructure.

The Role of Climate Change

Recent studies indicate that climate change is contributing to an increase in the frequency and intensity of these wind events. The following factors explain how climate change is influencing straight-line winds:

  1. Increased Atmospheric Instability: As global temperatures rise, the atmosphere becomes more unstable. Warmer air holds more moisture, leading to more intense thunderstorms, which are a primary source of straight-line winds. The increased energy in the atmosphere enhances the formation of severe weather systems capable of producing strong downdrafts.
  2. Enhanced Convective Available Potential Energy (CAPE): CAPE is a measure of the energy available for convection, which is a key process in the formation of thunderstorms. Higher CAPE values are associated with more vigorous updrafts and downdrafts, resulting in stronger winds. Climate change is leading to higher CAPE values in many regions, contributing to more powerful straight-line winds.
  3. Changing Wind Patterns: Climate change is altering global wind patterns, which can influence the development and movement of severe weather systems. These changes can result in more frequent and intense straight-line wind events, particularly in areas that are becoming more prone to severe thunderstorms.

The Impact of Straight-Line Winds

The deadly Houston windstorm is a stark reminder of the destructive power of straight-line winds. The storm left a trail of devastation, with thousands of residents losing power and homes being damaged or destroyed. The aftermath of such storms can be particularly dangerous during extreme weather events like heatwaves, which are also becoming more common due to climate change.

Conclusion

As the climate continues to change, the occurrence of extreme weather events like straight-line winds is expected to increase. This poses significant challenges for communities, infrastructure, and emergency response systems. Understanding the role of climate change in these events is crucial for developing strategies to mitigate their impact and enhance resilience against future storms. Scientists and policymakers must work together to address the root causes of climate change and implement measures to protect vulnerable populations from the growing threat of severe weather.

What Can I Do?
Our climate model uses chaos theory in an attempt to adequately account for humans and forecasts a global average temperature increase of 9℃ above pre-industrial levels. Everybody has the responsibility not to pollute. There are plenty of things you can do to help save the planet. Stop using fossil fuels. Consume less. Love more. Here is a list of additional actions you can take.

How is All Real Estate at Risk From Climate Change?

The Human Induced Climate Change Experiment

bookmark_borderSurvey of Experts: Climate Crisis Going Past 2.5 Degrees

by Daniel Brouse

The Guardian reports, “Many of the scientists envisage a ‘semi-dystopian’ future, with famines, conflicts and mass migration, driven by heatwaves, wildfires, floods and storms of an intensity and frequency far beyond those that have already struck.”

In a recent survey of climate scientists, the consensus suggests that global warming is on track to exceed 2.5 degrees Celsius this century, with some projections indicating a rise of over 5 degrees.

“I foresee significant societal upheaval within the next five years,” stated Gretta Pecl from the University of Tasmania. “We’ll face overwhelming challenges as extreme events become the norm, disrupting food production and beyond. The future seems increasingly bleak.”

Peter Cox from the University of Exeter emphasized, “Climate change isn’t waiting to become dangerous at 1.5 degrees Celsius – it already poses severe risks. Surpassing 2 degrees Celsius won’t signal ‘game over,’ but the urgency for action is dire.”

Nathalie Hilmi, representing the Monaco Scientific Centre, echoed the sentiment, asserting, “Limiting warming to 1.5 degrees Celsius is imperative. We cannot afford to exceed this threshold.”

The experts unanimously stressed the urgent need for extensive preparations to safeguard communities from impending climate catastrophes. Leticia Cotrim da Cunha from the State University of Rio de Janeiro expressed deep concern, particularly regarding the potential human toll.

The 1.5 degrees Celsius target, intended to avert the worst impacts of the climate crisis, has served as a crucial reference point in global climate negotiations. However, with current policies setting the world on a trajectory for around 2.7 degrees Celsius of warming, the survey indicates widespread skepticism among IPCC experts regarding the likelihood of sufficient action to curb emissions.

Climate Scientist Survey 2024

The Human Induced Climate Change Experiment

bookmark_borderClimate Change: Ruled Against UK

Litigation seeking compensation for loss and damage caused by the actions of oil companies and governments has the potential to reshape global economics. In the past year, several legal rulings have held governments accountable for their role in exacerbating the climate crisis, signaling a shift in legal accountability and prompting broader discussions on environmental responsibility.

The latest example, on May 3, 2024, a High Court judge delivered a significant ruling, declaring the U.K. government’s actions unlawful in approving a climate plan aimed at meeting crucial emission reduction targets without sufficient evidence of its feasibility. This marked the second occasion in two years where the government’s primary climate strategy faced legal challenge and was deemed inadequate in aligning with legally-binding commitments to curb greenhouse gas emissions.

Justice Clive Sheldon’s decision, following a case brought forth by three environmental organizations, underscored the government’s failure to substantiate its approval of the Carbon Budget Delivery Plan from the previous year. The judge concluded that the government lacked justification and the plan was “simply not justified by the evidence.”

Climate Change Law Suits

bookmark_borderKenya’s Frequency and Intensity of Extreme Weather

By Daniel Brouse

Kenya’s first-ever cyclone, Cyclone Kenneth, made landfall in April 2019, bringing heavy rainfall and strong winds to parts of eastern Africa, including Kenya. While Kenya is not typically in the path of cyclones, the occurrence of Cyclone Kenneth was attributed to changing climate patterns in the Indian Ocean, which allowed the cyclone to form further south than usual.

Cyclone Kenneth highlighted the increasing vulnerability of African countries to extreme weather events, including tropical cyclones, due to climate change. Rising sea surface temperatures in the Indian Ocean, fueled by global warming, provide favorable conditions for cyclone formation and intensification. As a result, countries like Kenya may face heightened risks of cyclones and associated hazards, including heavy rainfall, flooding, and storm surges.

In addition to Cyclone Kenneth, Kenya experienced several historic floods in the past year, further underscoring the country’s susceptibility to climate-related disasters. These floods were attributed to various factors, including prolonged and intense rainfall, poor land management practices, deforestation, and inadequate infrastructure for flood control and drainage.

Climate change exacerbates the frequency and severity of extreme weather events, including floods, by altering rainfall patterns, increasing the intensity of storms, and raising sea levels. In Kenya, as in many other parts of the world, climate change is contributing to more frequent and intense rainfall events, leading to an increased risk of flooding and associated impacts on communities, infrastructure, agriculture, and ecosystems.

Addressing the impacts of climate change in Kenya requires a comprehensive approach that includes efforts to reduce greenhouse gas emissions, adapt to changing climate conditions, improve disaster preparedness and response capabilities, and enhance resilience at the local, national, and regional levels. International cooperation and support are also essential to assist vulnerable countries like Kenya in addressing the challenges posed by climate change and building a sustainable future for all.

In 2024, the toll of flood-related incidents in Kenya has been devastating, with approximately 210 lives lost. Government data reveals that over 165,000 individuals have been displaced from their homes, and nearly 100 people are reported missing. The second ever hurricane, Hidaya, is expected to make landfall by May 4, 2024.

The Human Induced Climate Change Experiment

bookmark_borderClimate Change: The External Forcing

“Response to external forcings” refers to how a system reacts or changes in response to external influences or drivers. In the context of climate science, external forcings typically refer to factors outside of the Earth’s climate system that can influence the climate. These forcings can include natural factors such as volcanic eruptions, solar radiation, and orbital variations, as well as human-induced factors such as greenhouse gas emissions, land use changes, and aerosol pollution.

When scientists study the Earth’s climate system, they analyze how it responds to these external forcings. For example, changes in greenhouse gas concentrations due to human activities can lead to alterations in the Earth’s energy balance, resulting in global warming and climate change. Similarly, volcanic eruptions can release aerosols into the atmosphere, which can temporarily cool the climate by reflecting sunlight back into space.

Understanding the response of the climate system to external forcings is crucial for predicting future climate trends, assessing the impacts of human activities on the environment, and informing policies aimed at mitigating climate change. It involves complex scientific modeling and analysis to quantify the relationships between external forcings and climate variables such as temperature, precipitation, and atmospheric circulation patterns.

Chaos theory offers insights into the complex dynamics of the Earth’s atmosphere, particularly regarding the interactions between different atmospheric teleconnection patterns and their response to external forcings such as greenhouse gas emissions. Chaos theory can help elucidate how seemingly minor changes in atmospheric circulation patterns can lead to significant and often unpredictable changes in weather patterns across North America.

bookmark_borderChaos Theory: Evolving Winter Atmospheric Teleconnection Patterns

By Daniel Brouse

  1. Teleconnections: Teleconnections refer to climate anomalies and patterns that occur over large distances and are often linked to each other. These connections can manifest as recurring climate patterns, such as El Nino and La Nina events, the North Atlantic Oscillation (NAO), and the Southern Oscillation (SO). Teleconnections can influence weather and climate conditions globally, impacting precipitation, temperature, and atmospheric circulation patterns.
    • El Nino and La Nina: These are phases of the El Nino-Southern Oscillation (ENSO) phenomenon, characterized by anomalous warming (El Nino) or cooling (La Nino) of sea surface temperatures in the tropical Pacific Ocean. These events can lead to widespread changes in weather patterns worldwide, affecting rainfall, temperatures, and storm activity.
    • North Atlantic Oscillation (NAO): The NAO is a climate pattern characterized by changes in atmospheric pressure differences between the Icelandic Low and the Azores High over the North Atlantic Ocean. It influences weather patterns in North America, Europe, and North Africa, impacting temperatures, storm tracks, and precipitation patterns.
    • Southern Oscillation (SO): The SO is closely related to ENSO and refers to the atmospheric component of the El Nino-Southern Oscillation system. It influences weather patterns across the globe, particularly in the tropical Pacific region.
  2. Chaos Theory: Chaos theory emphasizes the inherent complexity and unpredictability of dynamic systems, such as the Earth’s climate system. It recognizes that small changes in initial conditions can lead to significant and unpredictable outcomes over time. In the context of climate change, chaos theory underscores the nonlinear interactions between various components of the climate system, including the atmosphere, oceans, ice, and biosphere.
    • Sensitive Dependence on Initial Conditions: Chaos theory highlights the sensitivity of complex systems to initial conditions, where small variations can amplify and lead to divergent outcomes. In the climate system, this sensitivity can manifest as abrupt shifts, tipping points, and feedback loops, contributing to nonlinear responses to external forcings like greenhouse gas emissions.
    • Emergent Behavior: Complex systems exhibit emergent behavior, where collective interactions between individual components give rise to new and often unpredictable phenomena. Climate change can lead to emergent properties such as extreme weather events, shifts in climate regimes, and changes in ecosystem dynamics.
    • Nonlinear Dynamics: Climate systems often exhibit nonlinear dynamics, meaning that changes in one component can trigger nonlinear responses in other parts of the system. This complexity makes it challenging to accurately model and predict the long-term impacts of climate change.

The study, “Evolving winter atmospheric teleconnection patterns and their potential triggers across western North American-Patterns” reports:

We present a comprehensive analysis diagnosing the primary factors driving the observed changes in major atmospheric teleconnection patterns in the Northern Hemisphere winter, including the Pacific North American pattern (PNA), North Atlantic Oscillation (NAO), and North American winter dipole (NAWD), with particular focus on their roles in shaping anomalous weather across North America. Our investigation reveals a consistent influence of the NAWD over seven decades, contrasting with fluctuating impacts from PNA and minor impacts from NAO. In particular, an emergent negative correlation between the NAWD and PNA, signaling a shifted phase of teleconnection patterns, is identified. Such a relationship change is traced to enhanced upper-level ridges across western North America, reflecting a reinforced winter stationary wave. Through attribution analysis, we identify greenhouse gas emissions as a probable driver for the northward drift of the Asia-Pacific jet core, which, aided by orographic lifting over the Alaskan Range, subsequently amplifies the winter stationary wave across western North America. This work emphasizes the pronounced effect of human-induced global warming on the structure and teleconnection of large-scale atmospheric circulation in the Northern Hemisphere winter, providing vital perspectives on the dynamics of current climate trends.

Chaos theory offers insights into the complex dynamics of the Earth’s atmosphere, particularly regarding the interactions between different atmospheric teleconnection patterns and their response to external forcings such as greenhouse gas emissions. Chaos theory can help elucidate how seemingly minor changes in atmospheric circulation patterns can lead to significant and often unpredictable changes in weather patterns across North America.

The analysis highlights the interplay between major atmospheric teleconnection patterns in the Northern Hemisphere winter, including the Pacific North American pattern (PNA), North Atlantic Oscillation (NAO), and North American winter dipole (NAWD). These patterns are known to influence weather conditions over vast regions and are sensitive to external drivers such as greenhouse gas emissions.

Chaos theory suggests that even small perturbations in the atmosphere, such as changes in temperature or pressure, can lead to nonlinear responses and amplify into larger-scale changes in weather patterns. In this case, the study identifies a consistent influence of the NAWD over several decades, indicating a robust relationship between this teleconnection pattern and anomalous weather across North America.

The emergence of a negative correlation between the NAWD and PNA, signaling a shifted phase of teleconnection patterns, is particularly noteworthy. This shift reflects a complex interplay of atmospheric dynamics, including the amplification of winter stationary waves across western North America.

Moreover, chaos theory underscores the role of human-induced global warming as a probable driver for these changes in atmospheric circulation. Greenhouse gas emissions are identified as a key factor contributing to the northward drift of the Asia-Pacific jet core, which, in turn, amplifies the winter stationary wave across western North America. This highlights the interconnectedness of human activities and Earth’s climate system, with potentially far-reaching consequences for weather patterns and climate trends.

Chaos theory provides a framework for understanding the intricate and often nonlinear relationships between atmospheric teleconnection patterns, external forcings, and the dynamics of current climate trends. By applying chaos theory principles, researchers can gain vital perspectives on the complex interactions shaping Earth’s climate system and inform efforts to mitigate and adapt to climate change.

Chaos Theory and Climate Systems

bookmark_borderThe Decline of Penn’s Sylvania

By Daniel Brouse

Penn’s Sylvania
Pennsylvania derives its name from the land grant bestowed upon William Penn. Penn’s grant, known as “sylvania,” translates to “forest” in Latin. Prior to the arrival of European settlers, the region was predominantly covered by vast expanses of dense forests, with a wide range of biodiversity and inhabited by indigenous peoples who relied on the land for sustenance and cultural practices.

In the 17th and 18th centuries, European settlers began to clear land for agriculture and settlement, leading to widespread deforestation in Pennsylvania. The demand for timber and wood products grew rapidly as the population expanded and industries such as shipbuilding, construction, and manufacturing developed. Logging became a prominent economic activity in Pennsylvania, with vast quantities of timber harvested. By the 19th century, Pennsylvania had become one of the leading timber-producing states in the United States, with extensive logging operations throughout the region. The emergence of the lumber industry brought prosperity to many communities but also led to widespread environmental degradation, including soil erosion, loss of biodiversity, and disruption of watershed systems.

As concerns grew over the sustainability of logging practices and the conservation of natural resources, efforts were made to regulate and manage forest resources more effectively. In the late 19th and early 20th centuries, the conservation movement gained momentum, leading to the establishment of state and federal agencies tasked with overseeing forestry and conservation efforts.

A Troubling Decline
In Pennsylvania, the once lush and verdant tree canopy is now facing a troubling decline, as the old growth trees succumb to the relentless pressures of human activities. The consequences of this ecological imbalance reverberate through the forest, as vines empowered by the thinning canopy are able to reach higher.

As these vines ascend to new heights, they cover and kill the venerable trees below. The intricate balance of nature is disrupted, as the loss of the old growth trees impacts biodiversity, soil stability, and wildlife habitats.

The gradual encroachment of vines into the upper reaches of the forest canopy represents a poignant symbol of the broader environmental challenges facing Pennsylvania and beyond. It serves as a stark reminder of the interconnectedness of all living beings and the urgent need for stewardship and conservation to preserve the natural wonders that enrich our lives.

ABOUT U.S. Temperate Zones
Climate change is significantly impacting the temperate zones in the United States in several ways:

  1. Shifts in Temperature: Temperate zones are experiencing changes in temperature patterns, with increases in both average temperatures and the frequency of extreme heat events. Winters are becoming milder, and summers are growing hotter, leading to shifts in growing seasons and ecosystem dynamics.
  2. Altered Precipitation Patterns: Climate change is causing alterations in precipitation patterns, including changes in rainfall intensity, frequency, and distribution. Some regions within temperate zones may experience more frequent and intense rainfall events, leading to increased flooding and soil erosion, while others may face more prolonged periods of drought, impacting water resources and agriculture.
  3. Changes in Ecosystems: The distribution and composition of ecosystems within temperate zones are being disrupted by climate change. Species ranges are shifting, and migration patterns are changing as plants and animals respond to altered temperature and precipitation conditions. This can lead to mismatches in timing between species interactions, such as flowering and pollination, or disruptions in food webs.
  4. Impacts on Agriculture: Climate change is posing challenges to agriculture in temperate zones, affecting crop yields, pest and disease dynamics, and the availability of suitable growing conditions. Heat stress, drought, and extreme weather events can damage crops and reduce agricultural productivity, impacting food security and economic livelihoods.
  5. Increased Risk of Wildfires: Warmer temperatures and drier conditions are contributing to an increased risk of wildfires in temperate zones, particularly in regions with dense vegetation and susceptible to drought. Wildfires can have devastating consequences for ecosystems, communities, and air quality, posing risks to human health and safety.
  6. Threats to Human Health: Climate change in temperate zones can exacerbate health risks associated with extreme heat events, air pollution, and the spread of vector-borne diseases. Vulnerable populations, such as the elderly, children, and individuals with pre-existing health conditions, may face increased risks of heat-related illnesses and respiratory problems.

Overall, climate change is reshaping the environmental, social, and economic landscapes of temperate zones in the United States, underscoring the need for proactive measures to mitigate its impacts and enhance resilience in affected regions.

* Our climate model / experiment employs chaos theory to comprehensively consider human impacts and projects a potential global average temperature increase of 9℃ above pre-industrial levels. Global warming is a consequence of elevated thermal energy in the climate system, which comprises various subsystems. Chaos theory underscores the intricate and nonlinear nature of dynamic systems. Human well-being is compromised above a 1.5-degree temperature rise, rendering much of the Earth uninhabitable. A 9-degree Celsius increase would bring the Earth close to a wet-bulb temperature incapable of sustaining human life.

Tree Extinction Due to Human Induced Environmental Stress

The Human Induced Climate Change Experiment

.

bookmark_borderExtreme Weather and Violent Rain

by Daniel Brouse

Between April 1 and 4, Southeastern Pennsylvania experienced another severe weather event attributed to atmospheric rivers and strong winds. Rainfall accumulation exceeded 3 inches, accompanied by wind gusts ranging from 35 to 45 mph. Tragically, two individuals lost their lives in unrelated incidents, one in Montgomery County and the other in Delaware County, when trees collapsed onto their vehicles.

Part of the The Philadelphia Violent Rain Experiment
The Greater Philadelphia Area serves as our focal point for studying non-coastal violent rain events. Although situated 78 miles from the nearest coast, Philadelphia has experienced a surge in violent rainstorms since 2021, with each episode yielding more precipitation than the typical monthly average. In addition to enduring Nor’easters and tropical storms from the Southeast, Philadelphia is increasingly subjected to deluges originating from the Gulf of Mexico.

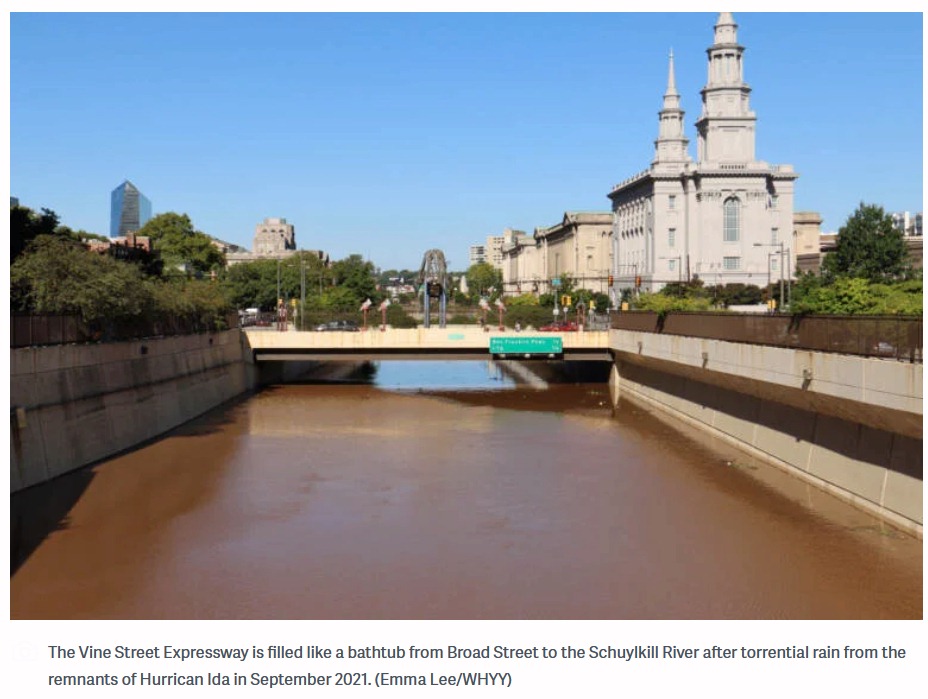
Vine Street Expressway Flooded

Hurricane Ida in the summer of 2021 is a good example. Because of the 85 degrees Fahrenheit Gulf of Mexico ocean temperature, Ida rapidly gained strength right before it made landfall jumping from a Category 1 to a Category 4 storm. The warm air allowed more moisture to be carried as rain. The storm was so large that it was able to pick up more moisture from the Atlantic Ocean. After destroying parts of Florida, the ocean moisture was carried inland and dumped over places like Pennsylvania and New York. Ida caused record flood damage in parts of Pennsylvania. The Philadelphia Inquirer reported, “The remnants of Hurricane Ida destroyed or damaged hundreds of homes in Southeastern Pennsylvania and caused more than $100 million in public infrastructure damage across the state.” There were more deaths in the Northeastern USA than where the storm made landfall in Louisiana. The New York Times reported, “The remnants of Hurricane Ida caused flash flooding and a number of deaths and disrupted transit across parts of New York and New Jersey. The storm killed at least 43 people in New York, New Jersey, Pennsylvania and Connecticut and left more than 150,000 homes without power.” Ida’s Philadelphia area destruction included 5 deaths, 7 tornadoes, record flooding, hundreds of water rescues, and “one incredibly soggy mess.” The violent rain in Philadelphia was so extreme that the main road across the city from the Delaware River to the Schuylkill River, the Vine Street Expressway, was turned into a canal. “You could’ve swam from 22nd Street to about 15th Street,” said Justin Galbreath, a district maintenance manager at the Pennsylvania Department of Transportation. As climate change intensifies, the frequency of Vine Street becoming a river will likely increase until such time as it becomes permanent.

The train derailment in Plymouth Meeting (July 17, 2023), the eleven vehicles swept away, and the seven people drowned by flood waters in Washington Crossing (July 15, 2023) were caused by a deluge of rain and flash flooding. “In my 44 years, I’ve never seen anything like it,” Upper Makefield Fire Chief Tim Brewer said. “When the water came up, it came up very swiftly. We do not think that anybody drove into it, that they were actively on that road when it happened.” CBS news reported, “Over 6 inches of rain in an hour caused the flash flooding according to Brewer. The fire department was dispatched in that area for a lightning strike and just by happenstance they found 11 cars. Eight people were rescued from the cars and two from the creek.” In July and December of 2023, extreme rainfall resulted in sinkholes being exposed in the carbonate rock under Route 202 in nearby King of Prussia, PA.

In September of 2023, the Philadelphia Inquirer reported, “The remnants of Tropical Storm Ophelia soaked the entire Philadelphia region with episodic downpours on Saturday, the first day of fall, conspiring to incite 60-mph wind gusts at the Shore and high-tide flooding that closed numerous roads in beach and back-bay towns.” There were up to 8 inches of rain recorded throughout the Philadelphia region over the three day event.

The winter of 2023 saw near weekly atmospheric river flash flooding events. On January 9, the Greater Philadelphia Region incurred an historic winter tropical violent rain event. CBS news reported, “If it feels like it’s been an abnormally rainy few weeks, you’re right. Normal rainfall totals between Dec. 1 and Jan. 9 amount to about 4.78 inches. Between December 2023 and Tuesday, we’d already recorded more than 9 inches of rain, an amount normally recorded in December, January and February combined.” The January 9 storm brought over 4 inches of rain to many areas. The Delaware River peaked at its highest level ever. There were hurricane strength winds with wind gusts over 70mph.

On March 23, 2024, Philadelphia witnessed its wettest March day on record. The rain gauge at the airport measured over 3 inches of rainfall, with parts of New Castle County, Delaware, also receiving over 3 inches. Some areas in Gloucester County and Camden County, New Jersey, recorded rainfall exceeding 4 inches. The precipitation observed on that day was roughly equivalent to the typical rainfall for the entire month. A young girl was swept away by the rapidly rising and swift moving waters of the Chester Creek in Delaware County, PA.

On the same day, an atmospheric river event brought heavy rains to Brazil’s Rio de Janeiro state, resulting in at least nine fatalities, with Petropolis being the hardest hit. A staggering 270 mm (11 inches) of rain fell within 24 hours, significantly impacting the region and leading to numerous incidents, including landslides and house collapses.

The Human Induced Climate Change Experiment