bookmark_borderIt’s the Service, Stupid: Understanding the Real U.S. Economy

By Daniel Brouse
April 17, 2025

One of the most fundamental misconceptions of Trumpenomics is the belief that the United States is—or should be—a manufacturing-first economy. In reality, the U.S. has evolved into a service-based powerhouse and is now the world’s largest exporter of services, including finance, healthcare, education, software, intellectual property, and other knowledge-driven industries.

This misunderstanding leads to flawed policies, especially regarding trade and tariffs. By focusing solely on manufacturing, Donald Trump’s economic rhetoric and calculations ignore the true engine of American growth: its service sector. Consequently, trade deficits and labor dynamics are misrepresented, giving the public a distorted view of global economic relationships.

Moreover, the claim that American jobs have been “shipped overseas” doesn’t stand up to scrutiny. The vast majority of high-paying jobs in the U.S.—from tech and logistics to finance and retail—were never exported. Companies like Microsoft, Meta, Amazon, Apple, Nvidia, Tesla, and Walmart generate millions of high-wage, service-based and technology-driven jobs that never originated as U.S. manufacturing positions in the first place. These firms pay some of the highest wages in the country, often without union representation, and their core operations remain solidly domestic.

Many of these companies outsource some manufacturing to countries with a comparative advantage—not to “steal” American jobs, but because the U.S. never had a competitive edge in those areas to begin with. Attempting to resurrect those jobs now through protectionist measures only undermines U.S. competitiveness and innovation.

Labor policy should be forward-facing. The labor movement must pivot from defending obsolete jobs to championing education, reskilling, and innovation. As with the buggy whip—once essential, now archaic—progress depends on adaptation, not nostalgia.

The truth is clear: America’s economic future lies not in reindustrialization, but in continuing to lead the global service economy. Failing to recognize this does more than hurt economic efficiency—it risks steering the nation backward just when it needs to charge forward. By eroding global confidence in the U.S. as a reliable trading partner, Trump risks permanently weakening the dollar and undermining America’s ability to finance its debt at sustainable levels.

Trumpenomics: The Decline of the US

bookmark_borderWTO Warns of Global Trade Slump as U.S. Tariff Policies Hit North America Hardest

By Daniel Brouse
April 16, 2025

The World Trade Organization (WTO) highlighted significant concerns regarding the impact of U.S. tariff policies on the global economy, with North America experiencing the most pronounced negative effects.​

Global Trade Outlook Deteriorates

The WTO has revised its 2025 forecast for global merchandise trade, now predicting a 0.2% decline, a sharp downgrade from the previous estimate of 3.0% growth. This adjustment is primarily attributed to escalating U.S. tariffs under President Donald Trump and the intensifying trade disputes, particularly with China.

North America Faces Significant Trade Contraction

The WTO reports that North America is expected to bear the brunt of these trade tensions, with projections indicating a 12.6% decrease in exports and a 9.6% reduction in imports. These figures suggest a substantial contraction in trade activity within the region.

Potential for Deeper Economic Impact

Should the U.S. implement its most severe proposed tariffs, the WTO warns that global trade could contract by up to 1.5%, potentially leading to broader economic downturns. The organization emphasizes that such measures could have long-term implications, including a potential decoupling of the U.S. and Chinese economies, which might shrink global GDP by up to 7%.

Call for Multilateral Engagement

WTO Director-General Ngozi Okonjo-Iweala has urged member countries to engage in dialogue and utilize the organization’s dispute resolution mechanisms to address trade disagreements. She cautions against unilateral tariff implementations, highlighting the risk of triggering retaliatory measures that could exacerbate global economic challenges.

In summary, the WTO’s analysis underscores the significant risks posed by current U.S. tariff policies, particularly for North America, and calls for collaborative efforts to mitigate potential adverse effects on the global economy.

Trumpenomics: The Decline of the US

bookmark_borderCracked Safe Haven: Historic Deviations in U.S. Treasury Bonds

By Daniel Brouse
April 16, 2025

Exceeding a standard deviation means that a data point is significantly different from the average — a statistical red flag.

In finance or economics:

  • A move of 1 standard deviation is unusual but not rare.

  • 2 or more indicates extreme behavior — often signaling stress, instability, or systemic change.

When U.S. Treasury bonds — historically the world’s most stable asset — move multiple standard deviations, it’s not just noise. It suggests deep structural shifts in fiscal policy, market confidence, or macroeconomic expectations.

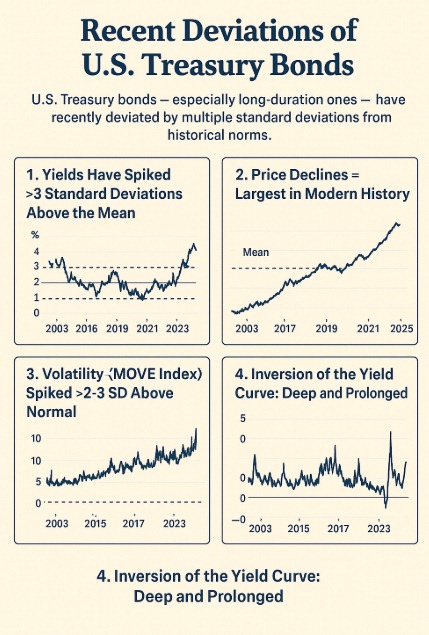
U.S. Treasury bonds — especially long-duration ones like the 10-year and 30-year Treasuries — have recently deviated by multiple standard deviations from historical norms in several key dimensions:

Historic Deviations in U.S. Treasury Bonds

1. Yields Have Spiked >3 Standard Deviations Above the Mean

  • As of late 2023 and early 2024, 10-year Treasury yields rose to around 4.5%–5%, levels 3+ standard deviations above the post-2008 average (~2%).

  • 30-year yields followed a similar pattern.

  • This is a massive deviation in historical bond market terms, which are usually stable and mean-reverting.

 This is a “once-in-a-generation” spike — the bond market equivalent of a hundred-year flood.

2. Price Declines = Largest in Modern History

  • Bond prices move inversely to yields.

  • The Bloomberg U.S. Treasury Index logged a historic drawdown (over –15%) in 2022–2023 — the worst since the 1780s in real terms.

  • That decline represents a >4 standard deviation move in price terms — practically unheard of in government bond history.

3. Volatility (MOVE Index) Spiked >2–3 SD Above Normal

  • The MOVE Index (bond market’s version of the VIX) soared past 160 in 2023.

  • Its long-term average is around 80–100.

  • A reading above 150 is a 3-sigma event — indicating extreme stress and uncertainty.

4. Inversion of the Yield Curve: Deep and Prolonged

  • The 2-year vs. 10-year yield inversion (short-term yields higher than long-term) has persisted at extreme levels — >1 standard deviation deeper and longer than historical precedent.

  • This inversion is a classic recession signal, but now it’s part of a structurally altered interest rate environment.

Summary: What’s Askew in U.S. Treasury Bonds


Metric Deviation from Norm Std. Dev. Estimate
10-yr Yield Sharp rise +3 to +4 SD
Treasury Price Index Historic loss –4+ SD
MOVE Volatility Index Sustained high volatility +2 to +3 SD
Yield Curve Inversion Depth Longest & deepest in decades >1 SD

Why It Matters

  • Bonds are usually the “safe haven” — but now they’re chaotic, cracked, and misaligned.

  • This upends traditional risk models used by banks, pensions, and governments.

  • It’s also a signal of fiscal fragility — markets demanding higher compensation for lending to the U.S.

The Big Question: What If the Dollar Loses Its Reserve Status?

Ultimately, the darkest scenario is no longer unthinkable: What happens if the U.S. dollar loses its status as the world’s reserve currency?

This would unleash a profound economic reset, marked by:

  • Exploding U.S. borrowing costs

  • A collapse in consumer purchasing power

  • Global capital flight from U.S. assets

  • Severe contraction in both trade and credit

  • Domestic political and economic instability unlike anything in modern history

Conclusion: We Are In the Experiment Now

Capital Preservation During Trumpenomics

The Inevitable Collapse: How Trump’s Policies and Climate Neglect Will Reshape the Economy

Trumpenomics: The Decline of the US

bookmark_borderClimate Change: Rate of Acceleration

By Daniel Brouse and Sidd Mukherjee
August 25, 2023
Update: 2025

How Fast Are Humans Causing the Climate to Change?

When we began our experiments in the 1990s, we believed the time scale for significant climate change was measured in millennia. If climate change progressed linearly, that assumption would hold. However, by the late ’90s, our findings revealed a non-linear pattern of change. Climate impacts were accelerating exponentially, not gradually.

Doubling time—the period required for a quantity to double—is a key feature of exponential growth. By 2020, data showed the doubling time for certain anthropogenic climate impacts had dropped dramatically, from 100 years to just 10 years. For instance, sea level rise increased from about 1.5 mm/year to over 3 mm/year. If this trend continues, we could be facing sea level increases of one foot per year by 2050.

Where:

  • = Doubling time
  • = Time
  • = Growth rate

Extreme weather events are also intensifying and becoming more frequent. A rule-of-thumb derived from the 2023 Canada wildfires illustrates this:

  • 50% more intense
  • 7x more likely to occur

These multipliers likely extend to hurricanes, droughts, heatwaves, atmospheric rivers, and sea-level-related flooding.

If the doubling time remains at 10 years, within the next decade, extreme events could be twice as intense and 14 times more likely. Should doubling time shrink to 5 years, by 2034 we may see 200% intensity with a 28x increase in occurrence.

2024 Update: Rapid Acceleration Confirmed

According to NASA, global average sea level rose by approximately 0.3 inches (0.76 cm) from 2022 to 2023. When we first wrote this paper in 2023, we foresaw a 10-year doubling period. Shockingly, new observations suggest a further contraction of the doubling period to just 2 years.

Sidd commented, “I suspect this is linked to the large jump in sea surface temperature last year, perhaps because of the restriction on sulfur in marine fuel. The top of the ocean warmed quickly and expanded. Let’s see if it is sustained.”

Indeed, 2023 was not only the hottest year on record overall but also the warmest for global oceans. A study in Advances in Atmospheric Sciences found that the upper 2,000 meters of the ocean gained 15 zettajoules more heat in 2023 than in 2022. This thermal expansion accounts for roughly half of all sea-level rise.

How Rapidly Is Climate Change Accelerating?

Answer: Far more rapidly than anticipated.

In summer 2023, earth’s surface temperatures averaged over 3°C above pre-industrial levels—double the Paris Agreement’s 1.5°C ceiling. Scientists agree that a 2°C rise will trigger tipping points and feedback loops. Once triggered, carbon stored in permafrost, forests, and other reservoirs is released, further intensifying warming. This chain reaction—dubbed the “Domino Effect”—reduces doubling time even more and could push temperatures from 3°C to 6°C above pre-industrial levels.

Humans cannot thrive at 1.5°C above pre-industrial temperatures. At 6°C, human survival itself becomes unlikely.

Testimonies from 2023 Events

Hawaii Governor Josh Green:
“We’ve had six fire emergencies this August alone—equal to the number we had from 1953 to 2003. That’s how fast things are changing. Climate change is here. We are in the midst of it—with a hotter planet and fiercer storms.”

Dr. Caroline Holmes, British Antarctic Survey:
“What we’re seeing right now is so far outside what we’ve observed previously. We expected change, but not this much, and not this fast.”

Jeff Boyne, National Weather Service Climatologist:
“The planet is warming so fast that climate normals now require updating every 10 to 15 years—ENSO regions every 5 years.”

Walter Meier, National Snow and Ice Data Center:
“It’s so far outside anything we’ve seen, it’s almost mind-blowing.”

Zeke Hausfather, Berkeley Earth:
“September was, in my professional opinion as a climate scientist, absolutely gobsmackingly bananas.”

Scientific Support

Dr. James E. Hansen’s recent paper Global Warming Acceleration: Impact on Sea Ice confirms our theory. His analysis shows that climate sensitivity is far higher than IPCC projections and that existing models underestimate key feedbacks. At current emissions levels, Hansen warns warming could reach or exceed 7°C by 2100, drastically increasing the risk of crossing irreversible tipping points.

Conclusion

The rate of climate change acceleration is no longer a question—it is a reality. With sea level rise, extreme weather, and temperature anomalies all growing exponentially, urgent action is required. Mitigating feedback loops and preventing cascading tipping points must become immediate global priorities if we are to preserve a habitable planet.

URGENT CLIMATE WARNING
Our latest climate model — now incorporating complex social-ecological feedback loops within a dynamic, non-linear system — projects that global temperatures could rise by up to 9°C (16.2°F) within this century. This far exceeds earlier estimates, which predicted a 4°C rise over the next thousand years, and signals a dramatic acceleration of warming.

At this level of heating, large regions of the planet will become uninhabitable due to extreme heat, sea level rise, agricultural collapse, and mass migration. Critically, parts of the U.S. are already experiencing wet-bulb temperatures approaching or exceeding 31°C (87.8°F) — a physiological limit beyond which the human body can no longer regulate its internal temperature, even in the shade with ample water.

This is no longer a distant threat. The climate system is entering a phase of compound risk and cascading collapse — and we are already seeing the early signs.

Immediate, radical mitigation and adaptation efforts are now essential to preserve habitable zones, food systems, and public health.

Tipping points and feedback loops are parts of an equation that determine the rate of acceleration in climate change. When one tipping point is breached and triggers a cascade of others, the resulting chain reaction is known as the Domino Effect.

The Human Induced Climate Change Experiment

bookmark_borderFeedback Loops: How They Accelerate Global Warming

By Daniel Brouse and Sidd Mukherjee

In the 1990s, the Membrane Domain initiated groundbreaking research on human-induced climate change, challenging the prevailing linear models of global warming. Our research introduced a nonlinear, exponential model—akin to the shape of a bathtub curve or hockey stick—which has since been repeatedly confirmed by real-world data.

At the heart of this acceleration are feedback loops, also known in climate science as positive feedback mechanisms. These are processes where an initial change in a system leads to additional changes that reinforce and amplify the original effect, setting off a self-reinforcing cycle. Though technically termed “positive,” their consequences for the planet are overwhelmingly negative.

Arctic Feedback Loops: The Ice-Albedo Crisis

One of the most well-documented feedback loops involves the melting of Arctic sea ice. Ice and snow reflect sunlight (a property called albedo), helping keep the planet cool. But as global temperatures rise and ice melts, darker ocean surfaces are exposed. These surfaces absorb more heat, further warming the oceans, accelerating ice loss, and releasing trapped greenhouse gases—especially methane, a gas more than 80 times more potent than CO₂ over a 20-year period.

A 2022 study published in Nature found the Arctic is warming nearly four times faster than the global average since 1979. That warming feeds into multiple simultaneous loops:

  • Ice-Albedo Loop: Loss of reflectivity speeds up warming.

  • Ocean Heating Loop: Warmer oceans melt more ice.

  • Methane Release Loop: Thawing permafrost and seafloor methane seeps intensify greenhouse effects.

Snow-Albedo and Greenland’s Darkening Ice Sheet

Another feedback loop is the snow-albedo loop. A warmer atmosphere leads to more rain and less snow. Less snowfall means less surface reflectivity, which leads to increased heat absorption and more warming.

In Greenland, NASA has tracked how the ice sheet has been darkening over the past two decades. During warmer summers, fresh snow disappears, exposing older, impurity-laden snow and larger snow grains that absorb more sunlight. The result: accelerated melt and rising sea levels.

Wildfires, Lightning, and Brown Carbon

A dangerous and expanding set of feedback loops involve wildfires, lightning, and brown carbon:

  • Warmer temperatures lead to more lightning, which sparks more forest fires.

  • Forest fires release vast amounts of CO₂ and brown carbon (a form of organic carbon with low albedo), further warming the atmosphere.

  • Brown carbon settles on ice and snow, darkening surfaces and accelerating melt.

According to Forests at Risk Due to Lightning Fires, 77% of forest fires in intact forest regions outside the tropics are now started by lightning. The number of strikes is expected to rise by 11–33% per degree of warming.

Prof. Sander Veraverbeke, Vrije Universiteit Amsterdam, warns:

“Thousands of lightning strikes in remote forests can spark hundreds of small fires. These merge into mega-fires—blazes the size of small countries. Once they reach this scale, they’re nearly impossible to stop.”

The Canadian wildfires of 2023 exemplify a crossed tipping point: they released more CO₂ than the annual emissions of all but three countries. In some places, permafrost is now burning year-round.

Permafrost Thaw and the Methane Bomb

Permafrost, long considered a stable carbon sink, is thawing rapidly, releasing methane and CO₂ into the atmosphere. This creates a powerful and terrifying loop:

  • Warming thaws permafrost.

  • Thawed permafrost emits methane and CO₂.

  • These emissions intensify warming.

  • Which thaws more permafrost.

This “methane bomb” effect could release hundreds of gigatons of carbon, pushing the climate system into uncharted territory.

Water Vapor: The Master Feedback Loop

The most dominant feedback loop is water vapor. As CO₂ warms the Earth, the atmosphere can hold more moisture. Water vapor itself is a potent greenhouse gas, amplifying the greenhouse effect. This leads to more warming, more evaporation, and thus, more water vapor.

This also intensifies precipitation events. Studies like A Harder Rain Is Falling and The Reign of Violent Rain show that storms are becoming more extreme, more sudden, and more destructive—another feedback loop fueled by warming.

Summary of Major Feedback Loops


Feedback Loop Mechanism Amplifying Effect
Ice-Albedo Melting ice exposes darker surfaces More heat absorption, more ice melt
Water Vapor Warmer air holds more moisture Increased greenhouse effect
Permafrost Thaw Thawing releases methane and CO₂ More warming, more thawing
Vegetation Loss Fewer plants absorb CO₂ More CO₂ in the atmosphere
Brown Carbon Deposits on snow reduce albedo Accelerated melt and warming
Forest Fires Fires release CO₂ and dark particles Warmer temps trigger more fires
Lightning More warming increases lightning More fire ignition events

Conclusion: The Dangerous Dance Between Feedback and Tipping Points

Feedback loops are not just theoretical—they are active, compounding, and interlinked. Many of them are already accelerating the breakdown of Earth’s climate systems.

When feedback loops interact with tipping points—critical thresholds beyond which irreversible change occurs—they can trigger cascading effects. These Domino Effects can cause widespread ecological collapse and rapid shifts in climate much faster than models predict.

Understanding these loops is not just an academic exercise. It’s a survival imperative. Stopping emissions is no longer enough—we must now act to halt the self-reinforcing feedbacks that threaten to run out of control.

URGENT CLIMATE WARNING
Our latest climate model — now incorporating complex social-ecological feedback loops within a dynamic, non-linear system — projects that global temperatures could rise by up to 9°C (16.2°F) within this century. This far exceeds earlier estimates, which predicted a 4°C rise over the next thousand years, and signals a dramatic acceleration of warming.

At this level of heating, large regions of the planet will become uninhabitable due to extreme heat, sea level rise, agricultural collapse, and mass migration. Critically, parts of the U.S. are already experiencing wet-bulb temperatures approaching or exceeding 31°C (87.8°F) — a physiological limit beyond which the human body can no longer regulate its internal temperature, even in the shade with ample water.

This is no longer a distant threat. The climate system is entering a phase of compound risk and cascading collapse — and we are already seeing the early signs.

Immediate, radical mitigation and adaptation efforts are now essential to preserve habitable zones, food systems, and public health.

Tipping points and feedback loops are parts of an equation that determine the rate of acceleration in climate change.

The Human Induced Climate Change Experiment

bookmark_borderTipping Points and the Domino Effect

By Daniel Brouse and Sidd Mukherjee
September 2022 – August 2023 (Updated April 2025)

Understanding Tipping Points

Tipping points and feedback loops are key factors in determining the rate of acceleration of climate change. When one tipping point is breached and triggers others to fall, the result is known as the Domino Effect.

To explain: push a glass slowly toward the edge of a table. Eventually, no matter how cautious you are, it will reach a critical point where it tips over and falls. Once the tipping point is crossed, the fall is inevitable—regardless of your intentions or beliefs.

Climate tipping points operate the same way. They are not a matter of opinion, but of science. Once breached, they lead to rapid, self-perpetuating change that is difficult—often impossible—to reverse.

What Are Climate Tipping Points?

Climate tipping points mark thresholds in Earth’s systems beyond which change becomes self-sustaining. These shifts push the climate into a new and often irreversible state—without requiring further human influence.

Many of these tipping points have already been crossed. For instance:

  • Methane released from beneath melting Arctic ice cannot be re-sequestered.

  • Alpine glaciers formed over 25,000 years ago are gone and will not return for millennia.

  • Permafrost is thawing across the Northern Hemisphere, from Alaska to Siberia, unleashing carbon and methane, destabilizing landscapes, and destroying ecosystems.

The Iberdrola Group reports, “Melting Siberian permafrost is turning tundra into muddy, barren terrain, starving local wildlife. Water bodies vanish as their bases thaw, worsening drought conditions.”

These are not isolated incidents. They mark the formation of positive feedback loops—like methane release accelerating further warming, which causes more methane to be released. The cycle feeds itself.

Evidence of Crossed Tipping Points

In 2019, Professor Tim Lenton of the University of Exeter warned:

“A decade ago we identified a suite of potential tipping points in the Earth system. Now we see evidence that over half of them have been activated… It is no longer responsible to wait and see.”

Some already-active or dangerously close tipping points include:

  • Greenland and East Antarctic Ice Sheet collapse

  • Mountain glacier loss

  • Atlantic Meridional Overturning Circulation (AMOC)

  • Amazon rainforest dieback

  • Arctic sea ice loss

  • Boreal forest degradation

  • Permafrost thaw

  • Warm-water coral bleaching

  • West Antarctic Ice Sheet instability

AMOC Tipping Point Crossed?
Until recently, the collapse of the AMOC was projected centuries away. But in July 2023, Nature Communications published “Warning of a forthcoming collapse of the Atlantic Meridional Overturning Circulation.” The data now projects AMOC collapse around 2050 under current emissions scenarios.

This collapse could accelerate sea level rise along the U.S. East Coast, intensify storms in Europe, and increase drought in West Africa. Prof. Stefan Rahmstorf warned:

“Climate history shows AMOC changes have led to some of the most abrupt and extreme temperature shifts. We must avoid disrupting it at all costs.”

Feedback Loops and Cascading Tipping Points

In Climate Change: How Long Is “Ever”?, we wrote:

“Extreme weather will increase. Coastlines will vanish. The most troubling shift, however, is the emergence of feedback loops—where plants and carbon sinks die off, accelerating warming independently of human activity.”

Sidd Mukherjee noted:

“That’s just one study. The window is between 2025 and 2095. I suspect we’ll be seeing many unpleasant surprises before then.”

The Domino Effect
When one tipping point triggers another, the domino effect begins. For example:

  • Melting mountain glaciers contribute to sea level rise.

  • This rise disrupts ocean circulation (AMOC).

  • AMOC disruption weakens rainfall in the Amazon.

  • Amazon dieback reduces carbon sequestration, amplifying global warming.

The Journal Science study “Triggering Multiple Climate Tipping Points” confirms:

“Even 1°C of global warming—the level we’ve already exceeded—risks triggering multiple tipping points.”

Each tenth of a degree beyond this increases the risk dramatically. Yet the world is on track for 2–3°C of warming—well above the Paris Agreement’s 1.5°C goal.

Cascading Crisis: Tipping Points Triggering Tipping Points

Climate scientist Sidd Mukherjee warned:

“Remember: these thresholds come with error bars. What we think might tip at 1.5°C may already be tipped at 1°C.”

This appears to be happening now.

For example:

  • Sea ice loss exposes darker ocean surfaces.

  • These absorb more heat, leading to more ice loss.

  • This heat also accelerates methane release from thawing permafrost.

  • Thawing permafrost releases yet more methane, feeding the loop.

In July 2023, the global temperature briefly reached 3°C above pre-industrial levels—an unprecedented and alarming milestone.

Conclusion: The Window is Closing

Adapted from Exceeding 1.5℃ Global Warming Could Trigger Multiple Climate Tipping Points (Sept. 2022):

We are now living with the reality of crossed tipping points. Some systems—like AMOC, Arctic sea ice, and permafrost—may already be in irreversible decline. These shifts will affect the Earth for thousands of years, regardless of future emissions cuts.

The imperative is clear: We must act not only to reduce emissions, but to halt the cascade of tipping points before they spiral out of control.

Tipping points and feedback loops are parts of an equation that determine the rate of acceleration in climate change.

The Human Induced Climate Change Experiment

bookmark_borderDeviation, Cracked Fractals, Climate, and Economics

by Daniel Brouse
April 14, 2025

Cracked Fractals & U.S. Climate/Fiscal Policy

The U.S. economy and climate systems are exhibiting the erratic behavior of complex systems approaching critical thresholds — resembling “cracked fractals,” those chaotic, fragile patterns that form when dynamic systems near collapse. These structures are not just visual metaphors; they represent branching futures, fragmented stability, and points beyond which recovery may no longer be possible.

At the same time, key economic and climate indicators — including the federal deficit, disaster recovery costs, housing unaffordability, and insurance risk exposure — are now 2 to 3 standard deviations above historical norms. In statistical terms, this suggests we are far outside the “normal range” of fluctuation — a danger signal flashing red across multiple sectors.

These deviations, when interpreted through the lens of chaos theory and nonlinear dynamics, signal profound instability in both natural and economic systems.

What Are Cracked Fractals?

A “cracked fractal” describes a breakdown in the typical structure of a complex system. Unlike traditional fractals that are self-similar and stable within bounds, cracked fractals emerge when stress fractures the system’s underlying attractor — the set of conditions it returns to over time.

This breakdown often occurs when:

  • The system is pushed past a critical threshold (bifurcation point),

  • Feedback loops amplify instability,

  • The original symmetry or balance can no longer be maintained.

In climate science, this might manifest as rapid shifts in ocean currents or runaway feedbacks in polar ice melt. In economics, it could be a sovereign debt spiral, liquidity collapse, or the disintegration of monetary confidence.

Standard Deviations: Statistical Red Flags

A standard deviation is a statistical tool used to measure the dispersion of data from its average. When indicators deviate by 2 or more standard deviations from the mean, they are considered extreme outliers — rare events with serious implications.

In a normal distribution:

  • 68% of values lie within 1 standard deviation,

  • 95% within 2,

  • 99.7% within 3.

So when key indicators consistently exceed these bounds, it’s not a fluke — it’s a structural failure in progress.

Real-World Examples of Outlier Behavior (2024–2025)

1. Inflation Volatility

Core inflation has fluctuated wildly since 2021 — sometimes 2–3 standard deviations above long-term norms. These shifts have been driven by:

  • Pandemic-induced supply chain shocks,

  • Energy market instability from geopolitical conflict,

  • Erratic or delayed monetary responses.

2. Federal Deficit (as % of GDP)

The U.S. deficit has ballooned to nearly 7% of GDP in fiscal year 2024 — a figure more than two standard deviations above historical peacetime averages. This debt is increasingly difficult to finance amid rising interest rates.

3. Housing Unaffordability

Home price-to-income ratios have exploded. In cities like San Francisco and Austin, the median home now costs more than 10x median income — well beyond the historical norm of 3–4x and more than 2 standard deviations above long-term affordability trends.

4. Stock Market Overvaluation

The S&P 500’s Shiller CAPE ratio is hovering near levels seen only before the Great Depression and the Dot-Com crash. Valuations are now 2–3 standard deviations above the 150-year average.

5. Corporate Debt Overhang

Non-financial corporate debt as a percent of GDP is near all-time highs. Many firms are increasingly reliant on rolling over existing debt at higher rates — a fragile position vulnerable to shocks.

6. Climate-Driven Insurance Losses

U.S. insured losses from climate disasters — wildfires, floods, hurricanes — are now regularly exceeding $100 billion per year. These losses are now normalized, rather than considered “black swan” events. In actuarial terms, that’s multiple standard deviations away from historical climate stability.

Fractals, Chaos Theory, and Tipping Points

Chaos theory deals with systems that are deterministic but highly sensitive to initial conditions — where tiny changes can lead to vastly different outcomes. This “butterfly effect” describes how once-stable systems can become chaotic.

Cracked Fractal
Cracked Fractal

Cracked fractals emerge near bifurcation points — thresholds beyond which the system evolves in an entirely new direction, often unpredictably. In climate systems, these bifurcations could be:

  • The sudden collapse of the Atlantic Meridional Overturning Circulation (AMOC),

  • Massive methane release from permafrost,

  • Shifts in the jet stream or monsoon patterns.

In the economy, these might manifest as:

  • Sudden dollar devaluation,

  • Foreign dumping of U.S. Treasury debt,

  • Collapse of consumer demand due to runaway inflation or debt.

Chaos Meets Climate: A Dual Collapse?

The real danger is that these systems — climate and economy — are not isolated. They are interacting.

  • Climate disasters strain public budgets and private insurance systems.

  • Economic fragility reduces the capacity to respond to climate emergencies.

  • Environmental destruction undermines long-term productivity and food security.

This mutual reinforcement may lead to a compound crisis, accelerating both fiscal and ecological collapse. Each system may be a cracked fractal — but together, they risk triggering a global phase shift into uncharted territory.

Conclusion: A Fractured Future

Humanity is now at a critical junction — a bifurcation point — where the complex systems governing life, economy, and climate are diverging into new, unstable paths.

Unless structural reforms are made — including coordinated climate action, debt restructuring, and transition away from carbon-heavy growth models — we may be entering a prolonged period of instability marked by:

  • Market dislocations,

  • Sovereign debt crises,

  • Mass migration and food insecurity,

  • Potential breakdowns in democratic governance.

If left unaddressed, the question is no longer if these systems will fracture, but how violently and how soon.

The cracked fractal is not just a metaphor — it’s a warning.

URGENT CLIMATE WARNING
Our latest climate model — now incorporating complex social-ecological feedback loops within a dynamic, non-linear system — projects that global temperatures could rise by up to 9°C (16.2°F) within this century. This far exceeds earlier estimates, which predicted a 4°C rise over the next thousand years, and signals a dramatic acceleration of warming.

At this level of heating, large regions of the planet will become uninhabitable due to extreme heat, sea level rise, agricultural collapse, and mass migration. Critically, parts of the U.S. are already experiencing wet-bulb temperatures approaching or exceeding 31°C (87.8°F) — a physiological limit beyond which the human body can no longer regulate its internal temperature, even in the shade with ample water.

This is no longer a distant threat. The climate system is entering a phase of compound risk and cascading collapse — and we are already seeing the early signs.

Immediate, radical mitigation and adaptation efforts are now essential to preserve habitable zones, food systems, and public health.

WET-BULB TEMPERATURES

Wet-bulb temperatures above 31°C (87.8°F) are extremely dangerous — at these levels, the human body cannot cool itself through sweating, even in the shade, leading to potentially fatal heat stress within hours. While these thresholds have historically been rare outside the tropics, parts of the U.S. are now beginning to approach or breach this limit during extreme heat events — something that used to be considered virtually impossible in the U.S. climate.

Here are the U.S. regions most at risk and already showing wet-bulb temperatures exceeding 31°C or very close — often 2–3 standard deviations above historical norms:

 1. South Texas & Gulf Coast (Brownsville, Corpus Christi, Houston)

  • Already observed wet-bulb temperatures > 31°C, especially during heatwaves with high humidity and stagnant air.

  • This region is closest in climate to subtropical zones, with high Gulf moisture and intense solar heating.

  • Notable Event: July 2023 saw Brownsville record a wet-bulb of 31.2°C, nearing human survivability thresholds.

2. Louisiana, Mississippi & Coastal Alabama

  • High humidity from the Gulf + high temps create perfect storm conditions for wet-bulb extremes.

  • New Orleans and Baton Rouge have clocked wet-bulb temps around 30.5°C to 31.0°C in recent summers.

  • Trend: Average summer humidity and nighttime minimum temps have increased significantly since the 1980s.

3. Florida (Miami, Tampa, Fort Myers, and inland Everglades)

  • Very high baseline humidity and increasing urban heat island effects are pushing wet-bulb temps near critical thresholds.

  • Miami-Dade’s urban core can hit 30.5°C wet-bulb, with some inland areas (Everglades edge) hitting 31°C under stagnant conditions.

4. Mississippi River Valley & Midwest (in isolated events)

  • While not traditionally at risk, heat dome events have caused spikes in wet-bulb readings in Illinois, Missouri, and Iowa.

  • Wet-bulbs of 29.5°C–30.5°C were observed during July 2023 under extreme dew points (~80°F) and triple-digit heat.

5. Southwest Deserts (Phoenix, Las Vegas, Death Valley) — Dry Heat, but Changing

  • Typically hot but dry, these regions have avoided extreme wet-bulb temps historically.

  • However, monsoonal moisture and climate shifts are making 30°C+ wet-bulb temps more common — especially during nighttime heatwaves when humidity is trapped.

Climate Collapse Will Break Capitalism

The Decline of Economic Power and the Ascent of Environmental Reality

The Destructive Legacy of Trump’s Climate and Economic Policies

Trumpenomics: The Decline of the US

State of the Climate Crisis 2025

Updates

The Human Induced Climate Change Experiment

bookmark_borderThe Demise of the Dollar and U.S. Exceptionalism

by Daniel Brouse
April 13, 2025

Economic Collapse Ends the Era of Mass Consumption, Capitalism, and Fossil Fuel Dependence

In 2017 and 2018, many economists warned of rising inflation and interest rates due to Donald Trump’s economic, environmental, and social policies — warnings that were largely dismissed at the time. Few believed the U.S. dollar, the linchpin of global finance, could lose its status as the world’s reserve currency. That confidence, once deeply rooted in the strength of U.S. institutions and global leadership, is now unraveling.

Trump’s Debt-Driven Economics: A Personal Philosophy Gone National

In office, Donald Trump mirrored his personal business model on a national scale: borrow excessively and sidestep repayment. Having declared bankruptcy over six times, Trump’s track record raised serious concerns about his approach to fiscal responsibility. That approach translated into:

  • Massive tax cuts without corresponding spending reductions.

  • Explosive deficit growth, pushing the national debt beyond the size of the U.S. economy.

  • Crowding out private investment as government borrowing soared, pushing up interest rates.

The result was an era of artificially inflated growth fueled by unsustainable debt and reckless financial policies.

Weakening the Dollar: Trade Wars and Protectionist Failures

Trump’s “Make America Great Again” agenda, anchored in economic nationalism, inflicted direct damage on the U.S. dollar’s global standing. His administration’s use of tariffs, trade barriers, and unilateral withdrawal from international agreements led to:

  • Erosion of trust in the U.S. as a stable trading partner.

  • Increased costs for imported goods, contributing to persistent inflation.

  • Undermining the predictability and liquidity of global trade, which the U.S. dollar heavily relies upon.

A reserve currency depends not only on economic strength but on political stability, institutional reliability, and global trust. Trump’s policies weakened all three pillars.

When Trade War Meets Credit War

What was once a hypothetical scenario — simultaneous trade and credit wars — has become reality in Trump’s second term.

In Trump 1.0, the groundwork was laid: shredding trade agreements, attacking global institutions, and retreating from multilateral leadership. In Trump 2.0, that playbook has scaled up into a full-blown economic experiment.

This time, the effects are no longer speculative. They are materializing in real time.

Tariffs are not just taxes on goods. They are also blows to global liquidity and trust. Countries that earn fewer dollars from exports to the U.S. have fewer dollars to invest back into U.S. Treasuries and assets. That’s how a trade war becomes a credit war.

Early Warning Signs of Systemic Breakdown

The early tremors of this dual war are already visible:

  • Bond market liquidity is vanishing as fewer international buyers participate.

  • Foreign demand for U.S. Treasuries is declining, despite rising yields.

  • Global central banks are diversifying reserves away from the dollar.

  • Gold, commodities, and non-dollar assets are surging as safe havens.

  • Interest rates are climbing, not because of growth, but because of risk.

This creates a dangerous feedback loop: less trade, fewer dollars abroad, reduced Treasury demand, higher U.S. borrowing costs, and ultimately tighter credit across the economy.

Collateral Damage: The U.S. Housing Market and Mortgage-Backed Securities

Trump’s policies are also destabilizing a once-resilient cornerstone of the U.S. financial system: the mortgage-backed securities (MBS) market.

As foreign central banks accumulate fewer dollars, their purchases of U.S. MBS and Treasuries decline. This reduces liquidity and drives up borrowing costs for American households.

Simultaneously, domestic strain is rising. FHA mortgage delinquencies have reached 11%, and investors in the secondary mortgage market are offloading debt at 5–10% discounts to raise cash—signaling a broader crisis of confidence.

The Unsustainable Status Quo: Debt, Decline, and Desperation

The U.S. government’s rising debt, coupled with shrinking foreign capital inflows, will make refinancing more difficult. As a result, the U.S. may be forced to do something it hasn’t done in nearly a century: balance its budget.

That prospect threatens to upend decades of U.S. economic expansion. It could lead to:

  • A collapse in the standard of living.

  • Reduced life expectancy as healthcare, infrastructure, and social services are gutted.

  • Exploding property taxes and insurance costs, with annual increases potentially exceeding 100% in a high-inflation environment.

With few tools left, the U.S. could resort to the nuclear option: hyperinflation. Turning trillions of dollars in debt into billions via inflation would devastate consumers, retirees, and anyone on a fixed income. It would also destroy the credibility of the dollar.

A Pyrrhic Victory? The Painful Path to Environmental Sustainability

Ironically, there may be a sliver of hope in this economic unraveling. If Trump’s economic collapse ends the era of mass consumption, over-leveraged capitalism, and fossil fuel dependence, it could reduce global emissions and slow the pace of climate change.

A forced degrowth scenario—where economic contraction leads to lower carbon output—might offer the time humanity needs to adapt, innovate, and survive. But it would come at enormous cost: to livelihoods, stability, and America’s global role.

Conclusion: Exceptionalism Undone

The U.S. dollar’s fall from dominance, combined with unprecedented political and fiscal recklessness, is dismantling the illusion of American exceptionalism. Once the anchor of global finance, the U.S. is now showing signs of becoming a net liability to the world economy.

The question is no longer whether the dollar can fall—but whether it can be saved. And if it cannot, what comes next for a nation built on the myth of infinite credit, endless growth, and unquestioned supremacy?

* WARNING * — Our updated climate model, now integrating complex social-ecological factors as part of a dynamic and non-linear system, shows that global temperatures could rise by up to 9°C within this century — far beyond previous predictions of a 4°C rise over the next thousand years. This level of warming will render much of the world uninhabitable within this century.

Climate Collapse Will Break Capitalism

The Destructive Legacy of Trump’s Climate and Economic Policies

Trumpenomics: The Decline of the US

State of the Climate Crisis 2025


bookmark_borderDollar Outflows, Fed Policy, and Foreign Mortgage Holdings Amid Economic Strain

by Daniel Brouse
April 13, 2025

Over the past three months, global capital flows, Federal Reserve policy, and the health of U.S. mortgage-backed securities have each come under renewed pressure as economic uncertainty deepens. The confluence of a weakening dollar, rising international disinvestment, and domestic credit strains is redefining the outlook for U.S. financial stability. This article examines three interrelated developments shaping the current landscape: the movement of cash out of dollar-denominated assets, the Federal Reserve’s role in currency and credit stabilization, and the evolving status of U.S. mortgage debt in foreign portfolios.

I. Capital Flight from the Dollar: A Three-Month Trend

In recent months, capital has been steadily flowing out of U.S. dollar-denominated assets into foreign currencies and non-dollar investment vehicles. This shift has accelerated due to waning investor confidence in U.S. fiscal discipline and monetary policy, compounded by a volatile geopolitical environment.

As of early April 2025:

  • The U.S. Dollar Index dropped below 100 for the first time since July 2023, down 2.7% in just one week and 7.6% year-to-date.

  • In January 2025, net capital outflows from the U.S. reached $48.8 billion, reversing inflows seen in late 2024.

  • The euro and Canadian dollar gained notable strength, with repatriation flows and currency hedging strategies pushing the loonie to a four-month high.

Simultaneously, central banks have continued diversifying their reserves:

  • The U.S. dollar’s share of global foreign exchange reserves has fallen to 57.4%, its lowest level since 1994, with increased holdings in euros, yuan, and gold.

These movements reflect broader skepticism toward U.S. fiscal direction and a growing appetite for global alternatives that offer more stable returns or diversified geopolitical exposure.

II. The Federal Reserve’s Response: Balance Sheet Maneuvers and Liquidity Safeguards

In an effort to manage the dollar’s decline and stabilize financial conditions, the Federal Reserve has taken several notable steps. Although it has not directly intervened in foreign exchange markets, its recent balance sheet and interest rate decisions indicate a shift toward cautious support for dollar stability.

In March 2025, the Fed announced it would:

  • Reduce the pace of its balance sheet runoff, decreasing the monthly cap on Treasury redemptions from $25 billion to just $5 billion starting in April.

  • Maintain the cap on agency debt and mortgage-backed securities at $35 billion, with excess payments being reinvested in Treasurys.

  • Hold interest rates steady at 4.25% to 4.5%, while continuing to offer overnight repurchase operations to preserve liquidity with a $500 billion ceiling.

These measures aim to preserve Treasury market liquidity while ensuring the financial system remains well-functioning amid deteriorating external confidence. However, the Fed’s efforts are complicated by inflationary pressures tied to trade policies and ongoing credit tightening.

III. Foreign Holdings of U.S. Mortgage Debt and the Strain on the Secondary Market

Another fault line is emerging in the mortgage finance sector, where both international and domestic stressors are reshaping the market.

As of mid-2024:

  • Foreign investors held roughly $1.635 trillion in U.S. asset-backed securities (ABS), including mortgage-backed securities (MBS).

  • This represents 12.6% of the $12.982 trillion in long-term U.S. debt securities held abroad.

  • Major foreign holders of U.S. MBS include Japan ($253 billion), Canada ($190 billion), and the Cayman Islands ($107 billion).

Recent months have seen rising unease in the secondary mortgage market. The credit tightening cycle, paired with new tariffs and trade-related uncertainty, has made private credit assets—including MBS—less liquid and more volatile:

  • Investors are increasingly selling private credit and MBS in the secondary market at 5–10% discounts below par to raise cash.

  • Mortgage delinquencies among FHA borrowers have surged to 11%, underscoring the financial vulnerability of lower-income households.

These developments suggest that foreign investors are not only rebalancing away from U.S. government debt but also reassessing their exposure to U.S. housing-linked assets, which are increasingly seen as high-risk due to domestic economic fragility and policy unpredictability.

Conclusion: A System Under Strain

Taken together, the weakening of the dollar, strategic shifts in Federal Reserve policy, and erosion of investor confidence in U.S. mortgage debt paint a picture of an economic system under significant strain. As trade and credit tensions continue to weigh on global sentiment, the U.S. financial system faces growing pressure from both external capital flight and internal market stress. In this environment, maintaining liquidity, credibility, and policy coherence will be essential for preventing further destabilization of core financial markets.

Capital Preservation During Trumpenomics

The Inevitable Collapse: How Trump’s Policies and Climate Neglect Will Reshape the Economy

Trumpenomics: The Decline of the US

bookmark_borderThe Race Against Time: Climate Crisis vs. the United States

by Daniel Brouse
April 12, 2025

Abstract
Humanity stands at a historic crossroads where the accelerating pace of climate change threatens to overtake both our capacity for response and the viability of the global economic system itself. Recent models indicate that without immediate intervention, climate change could cause the collapse of capitalism as we know it—potentially as soon as 2050. At the same time, U.S. political developments—particularly Trump-era trade, fiscal, and environmental policies—may unintentionally hasten this collapse. The central question becomes: Will the U.S. economic system implode before climate change forces its hand, or has irreversible damage already been done?

I. Climate Change: From Hypothesis to Imminent Catastrophe

In the 1990s, we proposed a hypothesis: that climate change would not follow a linear trajectory but would instead accelerate non-linearly—driven by feedback loops such as polar ice melt, permafrost thaw, ocean acidification, and carbon release from soil and forests. Over the following decades, this hypothesis evolved into an established scientific theory, now widely accepted by the international scientific community.

Through collaboration with a physicist from Ohio State University, we observed a startling trend in the “doubling time” of climate impacts. Originally pegged at around 100 years, this timeframe has since shrunk to 10 years, and now—alarmingly—approaches just 2. That means climate-related damages could be 64 times worse a decade from now than they are today. These aren’t worst-case scenarios; they are conservative models assuming no further acceleration.

Our latest models integrate not only geophysical systems but also social, political, and economic feedback loops. The results are grim: we now forecast a potential 9°C rise in global temperatures within this century—a rate that would make much of the planet uninhabitable and render large-scale human migration and system failure unavoidable.

II. A New Threat Emerges: Trumpenomics and the War on Global Stability

Ironically, the Trump administration—through its aggressive trade, credit, and isolationist policies—has accelerated the very breakdown of capitalism that climate change is expected to cause.

The imposition of widespread tariffs, especially those based on falsified “reciprocal” trade deficits, has triggered not just a trade war, but a credit war. This combination has never before been tested in modern economic history. During Trump’s first term, the stage was set. Now, in his second term, the global economy is being subjected to a real-time, uncontrolled experiment.

The administration’s “drill, baby, drill” energy policy, paired with unprecedented regulatory rollbacks, has only deepened the climate crisis. Yet, from an economic systems perspective, it is the trade and credit dislocations that may deliver the first major blow.

III. Global Trade, Capital Flows, and the Liquidity Death Spiral

Most people think of tariffs as mere taxes on goods. But in today’s complex financial system, their impact extends far beyond the shipping yard.

When the U.S. imports less, foreign exporters earn fewer dollars. This reduces their ability to invest in U.S. Treasuries—the bedrock of the global financial system. As demand for Treasuries falls, yields rise, borrowing costs spike, and credit conditions tighten. This sets off a self-reinforcing liquidity crisis, undermining everything from consumer lending to corporate investment.

The risk is real and growing: a scenario where the U.S. dollar loses its global reserve status is no longer the stuff of academic theory. Should this occur, the fallout would include:

  • Exploding U.S. borrowing costs

  • A collapse in consumer purchasing power

  • Capital flight from U.S. markets

  • Severe contraction in both trade and credit

  • Domestic political and social unrest on a scale not seen in modern history

IV. The Tipping Point: Will Climate Collapse or Economic Collapse Win the Race?

The economic trajectory of the U.S. under Trump’s policies suggests that a post-capitalist transition may be triggered by domestic fiscal instability rather than climate catastrophe alone. In other words, the United States may be the first nation to economically implode under the dual weight of environmental and self-inflicted economic collapse.

Complicating matters, the U.S. is simultaneously dealing with aging infrastructure, mounting national debt, deteriorating public health, climate-related disasters, and rising political extremism—all of which erode resilience and reduce the chances of a coordinated national response.

This raises a chilling question: Will the collapse of the U.S. economy accelerate faster than climate change itself—or are we already too late to avoid either fate?

The U.S. dollar’s decline from global dominance — driven by unprecedented political dysfunction and fiscal recklessness — is unraveling the myth of American exceptionalism. Once the cornerstone of international finance, the United States now risks becoming a net liability to the world economy. Paradoxically, this economic unraveling may carry a sliver of hope. If Trump’s economic collapse marks the end of mass consumption, over-leveraged capitalism, and fossil fuel dependency, it could trigger a sharp drop in global emissions and slow the pace of climate change. Such a forced degrowth scenario–where contraction curbs carbon output–might buy humanity precious time to adapt, innovate, and survive. But this path would come at a steep cost: to livelihoods, political stability, and America’s standing in the world.

Conclusion: What Comes After?

Regardless of which crisis arrives first, one outcome is increasingly likely: the U.S. standard of living will fall sharply, and life expectancy may follow. Whether that post-collapse society can still be sustainable—or even enjoyable—will depend on the decisions we make in the next few years.

Our only hope is to treat this as a true “race against time” and respond with urgency, humility, and collective will. The future depends not just on science and economics, but on whether we can choose survival over ideology, cooperation over conflict, and truth over convenience.
The Human Induced Climate Change Experiment