bookmark_borderColorado River Running Dry

NASA reports:

A new study by scientists from NASA and the University of California, Irvine, has found that over 75 percent of the water loss in the drought-stricken Colorado River Basin since late 2004 came from underground resources. The extent of groundwater loss may pose a greater threat to the water supply of the western United States than previously thought.

This study is the first to quantify the amount that groundwater contributes to the water needs of western states. According to the U.S. Bureau of Reclamation, the federal water management agency, the basin has been suffering from prolonged, severe drought since 2000 and has experienced the driest 14-year period in the last hundred years.

The research team used data from NASA’s Gravity Recovery and Climate Experiment (GRACE) satellite mission to track changes in the mass of the Colorado River Basin, which are related to changes in water amount on and below the surface. Monthly measurements in the change in water mass from December 2004 to November 2013 revealed the basin lost nearly 53 million acre feet (65 cubic kilometers) of freshwater. That’s almost double the volume of the nation’s largest reservoir, Nevada’s Lake Mead. More than three-quarters of the total — about 41 million acre feet (50 cubic kilometers) — was from groundwater.

“We don’t know exactly how much groundwater we have left, so we don’t know when we’re going to run out,” said Stephanie Castle, a water resources specialist at the University of California, Irvine, and the study’s lead author. “This is a lot of water to lose. We thought that the picture could be pretty bad, but this was shocking.”

Scale in the sky
Water above ground in the basin’s rivers and lakes is managed by the U.S. Bureau of Reclamation, and its losses are documented. Pumping from underground aquifers is regulated by individual states and is often not well documented.

“There’s only one way to put together a very large-area study like this, and that is with satellites,” said senior author Jay Famiglietti, senior water cycle scientist at JPL on leave from the University of California, Irvine, where he is an Earth-system science professor. “There’s just not enough information available from well data to put together a consistent, basin-wide picture.”

Famiglietti said GRACE is like having a giant scale in the sky. Within a given region, the change in mass due to rising or falling water reserves influences the strength of the local gravitational attraction. By periodically measuring gravity regionally, GRACE reveals how much a region’s water storage changes over time.

The Colorado River is the only major river in the southwest part of the United States. Its basin supplies water to about 40 million people in seven states, and irrigates roughly four million acres of farmland.

Water lifeline
“The Colorado River Basin is the water lifeline of the western United States,” said Famiglietti. “With Lake Mead at its lowest level ever, we wanted to explore whether the basin, like most other regions around the world, was relying on groundwater to make up for the limited surface-water supply. We found a surprisingly high and long-term reliance on groundwater to bridge the gap between supply and demand.”

Famiglietti noted that the rapid depletion rate will compound the problem of short supply by leading to further declines in streamflow in the Colorado River.

“Combined with declining snowpack and population growth, this will likely threaten the long-term ability of the basin to meet its water allocation commitments to the seven basin states and to Mexico,” Famiglietti said.

The study has been accepted for publication in the journal Geophysical Research Letters, which posted the manuscript online July 24. Coauthors included other scientists from NASA’s Goddard Space Flight Center, Greenbelt, Maryland, and the National Center for Atmospheric Research, Boulder, Colorado. The research was funded by NASA and the University of California.

bookmark_borderClimate-related Health Risks

The World Health Organization calls for stronger action on climate-related health risks:

“The evidence is overwhelming: climate change endangers human health,” says Dr Margaret Chan, WHO Director-General. “Solutions exist and we need to act decisively to change this trajectory.”

Previously unrecognized health benefits could be realized from fast action to reduce climate change and its consequences. For example, changes in energy and transport policies could save millions of lives annually from diseases caused by high levels of air pollution. The right energy and transport policies could also reduce the burden of disease associated with physical inactivity and traffic injury.

Measures to adapt to climate change could also save lives around the world by ensuring that communities are better prepared to deal with the impact of heat, extreme weather, infectious disease and food insecurity.

Cholera, malaria and dengue highly sensitive to weather and climate

WHO and its partners highlight the importance of acting now to help protect health in the present as well as the future. The health community is working hard to improve its capacity for surveillance and control of infectious diseases such as cholera, malaria and dengue, which are highly sensitive to weather and climate.

Climate change is already causing tens of thousands of deaths every year from shifting patterns of disease, from extreme weather events, such as heat-waves and floods, and from the degradation of water supplies, sanitation, and impacts on agriculture, according to the most recent WHO data.

“Vulnerable populations, the poor, the disadvantaged and children are among those suffering the greatest burden of climate-related impacts and consequent diseases, such as malaria, diarrhoea and malnutrition, which already kill millions every year”, notes Dr Flavia Bustreo, WHO Assistant Director-General, Family, Women’s and Children’s Health. “Without effective action to mitigate and adapt to the adverse effects of climate change on health, society will face one of its most serious health challenges,” she says.

“But the good news is that reducing climate change can yield substantial and immediate health benefits” says Dr Maria Neira, WHO Director, Department of Public Health, Environmental and Social Determinants of Health. “The most powerful example is air pollution, which in 2012 was responsible for 7 million deaths – one in eight of all deaths worldwide. There is now solid evidence that mitigating climate change can greatly reduce this toll,” she adds.

bookmark_borderEbola Virus Disease

The World Health Organization (WHO) believes the ebola outbreak is more severe than first thought. Because of fear and lack of education, many cases are going unreported. Ebola has a high instance of death due to bleeding from orifices.

“Ebola virus disease is a severe, often fatal illness and one of the world’s most virulent diseases. The infection is transmitted by direct contact with the blood, body fluids and tissues of infected animals or people. During an outbreak, people at higher risk of infection are health workers, family members and others in close contact with sick people and anyone who has died from Ebola. People who are ill with the disease need to receive expert care in appropriate facilities. Ebola outbreaks can devastate families and communities, but the infection can be controlled through the use of recommended protective measures. WHO is coordinating a global response to the latest outbreaks in Africa.”

  • Ebola virus disease (EVD), formerly known as Ebola haemorrhagic fever, is a severe, often fatal illness in humans.
  • EVD outbreaks have a case fatality rate of up to 90%.
  • EVD outbreaks occur primarily in remote villages in Central and West Africa, near tropical rainforests.
  • The virus is transmitted to people from wild animals and spreads in the human population through human-to-human transmission.
  • Fruit bats of the Pteropodidae family are considered to be the natural host of the Ebola virus.
  • Severely ill patients require intensive supportive care. No licensed specific treatment or vaccine is available for use in people or animals.

bookmark_borderWritten In Stone

In the early 1950’s a Canadian wrote a four-letter word in stone:

Between 1950 and 1952, a bored weatherman, stationed north of Hudson
Bay, left a monument that neither government nor time can eradicate.
Using a bulldozer abandoned by the Air Force, he spent two years and
great effort pushing boulders into a single word.

It can be seen from 10,000 feet, silhouetted against the snow.
Government officials exchanged memos full of circumlocutions (no Latin
equivalent exists) but failed to word an appropriation bill for the
destruction of this cairn, that wouldn’t alert the press and embarrass
both Parliament and Party.

It stands today, a monument to human spirit. If life exists on other
planets, this may be the first message received from us.
— The Realist, November, 1964.

bookmark_borderStrange July Weather

NASA reports that North America weather patterns for July 2014 were upside down:

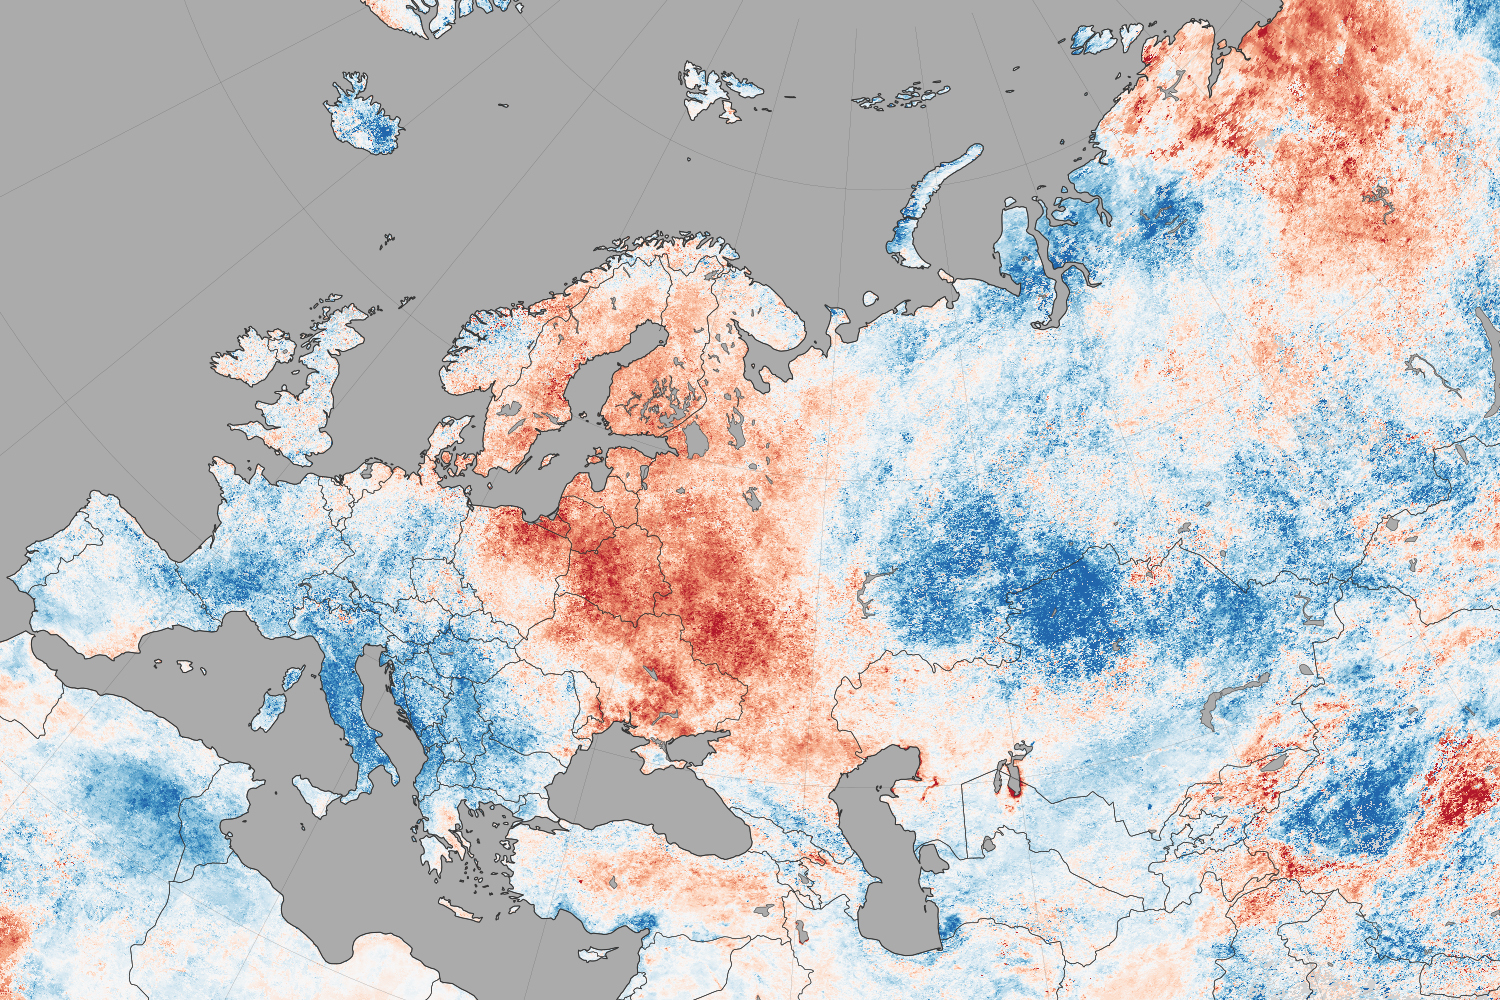
If you live in the northern hemisphere, the past few weeks have been strange. In places where it should be seasonably hot—the eastern and southern United States and western Europe—it’s just been warm. In places where weather is usually mild in the summer—northern Europe, the Pacific coast of North America—it has been ridiculously hot.

Records for high temperatures (mid-30s°C, mid-90s°F) were approached or broken in Latvia, Poland, Belarus, Estonia, Lithuania, and Sweden in late July and early August. Searing temperatures also dried out forests and fueled wildfires in Siberia; in the U.S. states of Oregon, Washington, and California; in the Canadian provinces of British Columbia, Alberta, and Northwest Territories; and even in Sweden. At the same time, cool air moved from high northern latitudes into much of the U.S., setting record-low daytime and nighttime temperatures as far south as Florida and Georgia. Temperatures dropped to the winter-like levels in the mountains of Tennessee.

The maps on this page shows land surface temperature (LST) anomalies for July 27–August 3, 2014. They were built from data collected by the Moderate Resolution Imaging Spectroradiometer (MODIS) on NASA’s Aqua satellite, and the 2014 data is compared to the average for the same week as observed from 2005–2013. You can visit NASA Earth Observations for a view of temperature anomalies for the entire month of July.

Unusual July Temperatures

Color bar for Unusual July Temperatures

Observed by satellites uniformly across the entire globe, land surface temperatures are a measure of the amount of infrared energy (thermal radiance) emitted by Earth’s surface as it is heated by daylight and cooled in the dark of night. LSTs are sometimes referred to as land “skin” temperatures, and indeed they are a reflection of how hot a surface would feel to the touch. LST anomalies, as shown on this page, are not absolute temperatures; instead, they show how much temperatures were above or below the average. The darkest reds show areas that were as much as 10°C (20°F) above the norm; blues show areas that were below normal; light gray depicts areas with incomplete data (often due to cloud cover, such as in the area of the Indian monsoon); dark gray is ocean.

Meteorologists saw several possible and related causes for the heat waves and cooling patterns. High pressure systems over Scandinavia and northern Russia, as well as over the Pacific Northwest of North America, allowed stable air masses to build up heat domes and “block” incoming fronts that could bring changes in winds, precipitation, and temperatures. These blocking patterns worked together with unusual bends and meanders in the jet stream, which took on a see-sawing north-south pattern over the northern hemisphere. The jet moved air northward over the Pacific Ocean and warmed northwest Canada and the west coast of the U.S.; it dove south from cooler areas of Canada into the central and eastern U.S.; and it drove warm Atlantic air north into northern Europe. The jet took a similar north-south zig-zag in western and eastern Siberia. This pattern is more common in winter than in summer.

bookmark_borderResearch

Research, n:
Consider Columbus:
He didn’t know where he was going.
When he got there he didn’t know where he was.
When he got back he didn’t know where he had been.
And he did it all on someone else’s money.

bookmark_borderConsequences Of Climate Change

NASA scientists warn:

Global climate change has already had observable effects on the environment. Glaciers have shrunk, ice on rivers and lakes is breaking up earlier, plant and animal ranges have shifted and trees are flowering sooner.

Effects that scientists had predicted in the past would result from global climate change are now occurring: loss of sea ice, accelerated sea level rise and longer, more intense heat waves.

Scientists have high confidence that global temperatures will continue to rise for decades to come, largely due to greenhouse gasses produced by human activities. The Intergovernmental Panel on Climate Change (IPCC), which includes more than 1,300 scientists from the United States and other countries, forecasts a temperature rise of 2.5 to 10 degrees Fahrenheit over the next century.

According to the IPCC, the extent of climate change effects on individual regions will vary over time and with the ability of different societal and environmental systems to mitigate or adapt to change.

The IPCC predicts that increases in global mean temperature of less than 1.8 to 5.4 degrees Fahrenheit (1 to 3 degrees Celsius) above 1990 levels will produce beneficial impacts in some regions and harmful ones in others. Net annual costs will increase over time as global temperatures increase.

“Taken as a whole,” the IPCC states, “the range of published evidence indicates that the net damage costs of climate change are likely to be significant and to increase over time.” 1

Below are some of the regional impacts of global change forecast by the IPCC:

  • North America: Decreasing snowpack in the western mountains; 5-20 percent increase in yields of rain-fed agriculture in some regions; increased frequency, intensity and duration of heat waves in cities that currently experience them.2
  • Latin America: Gradual replacement of tropical forest by savannah in eastern Amazonia; risk of significant biodiversity loss through species extinction in many tropical areas; significant changes in water availability for human consumption, agriculture and energy generation.3
  • Europe: Increased risk of inland flash floods; more frequent coastal flooding and increased erosion from storms and sea level rise; glacial retreat in mountainous areas; reduced snow cover and winter tourism; extensive species losses; reductions of crop productivity in southern Europe.4
  • Africa: By 2020, between 75 and 250 million people are projected to be exposed to increased water stress; yields from rain-fed agriculture could be reduced by up to 50 percent in some regions by 2020; agricultural production, including access to food, may be severely compromised.5
  • Asia: Freshwater availability projected to decrease in Central, South, East and Southeast Asia by the 2050s; coastal areas will be at risk due to increased flooding; death rate from disease associated with floods and droughts expected to rise in some regions.6

Global Climate Change: Recent Impacts7

Phenomena Likelihood that trend occurred in late 20th century
Cold days, cold nights and frost less frequent over land areas Very likely
More frequent hot days and nights Very likely
Heat waves more frequent over most land areas Likely
Increased incidence of extreme high sea level * Likely
Global area affected by drought has increased (since 1970s) Likely in some regions
Increase in intense tropical cyclone activity in North Atlantic (since 1970) Likely in some regions

* Excluding tsunamis, which are not due to climate change.

Global Climate Change: Future Trends8

Phenomena Likelihood of trend
Contraction of snow cover areas, increased thaw in permafrost regions, decrease in sea ice extent Virtually certain
Increased frequency of hot extremes, heat waves and heavy precipitation Very likely to occur
Increase in tropical cyclone intensity Likely to occur
Precipitation increases in high latitudes Very likely to occur
Precipitation decreases in subtropical land regions Very likely to occur
Decreased water resources in many semi-arid areas, including western U.S. and Mediterranean basin High confidence

bookmark_borderRamadan

Ramadan is the ninth month of the Islamic calendar; Muslims worldwide observe this as a month of fasting. Ramadan is a time of deep reflection for Muslims worldwide. “While fasting from dawn until sunset, Muslims refrain from consuming food, drinking liquids, smoking, and engaging in sexual relations; in some interpretations Muslims also refrain from other behavior which could be perceived as sinful such as swearing, engaging in disagreements, listening to music and procrastination.”

Chapter 2, Revelation 185 of the Quran states:

The month of Ramadan is that in which was revealed the Quran; a guidance for mankind, and clear proofs of the guidance, and the criterion (of right and wrong). And whosoever of you is present, let him fast the month, and whosoever of you is sick or on a journey, a number of other days. Allah desires for you ease; He desires not hardship for you; and that you should complete the period, and that you should magnify Allah for having guided you, and that perhaps you may be thankful.[Quran 2:185]