bookmark_borderPolar Amplification and the Collapse of Climate Stability: How Shrinking Temperature Gradients Are Driving Extreme Weather

By Daniel Brouse and Sidd Mukherjee
December 1, 2025

The rapid escalation of extreme weather across the planet is not random—it is tied directly to one of the clearest signatures of anthropogenic climate change: polar amplification, the phenomenon in which the Arctic and Antarctic warm much faster than the global average. The resulting shrinkage in the temperature gradient between the equator and the poles is destabilizing the fundamental circulation systems that have governed Earth’s climate for thousands of years.

This loss of contrast—once the engine of atmospheric order—is now ushering in a new era of climatic chaos.

How Polar Amplification Destabilizes the Planet

Normally, large temperature differences between the tropics and the poles help maintain a fast, well-organized jet stream in the upper atmosphere and a powerful ocean circulation in the North Atlantic known as the Atlantic Meridional Overturning Circulation (AMOC). These systems work together to redistribute heat, prevent stagnation, and maintain seasonal predictability.

But as the Arctic warms nearly four times faster than the global average, and as the Antarctic undergoes record ice loss, these temperature gradients are collapsing.

Two Major Climate Systems Have Now Crossed Tipping Points

Recent observations indicate that:

1. The Jet Stream
Once strong and relatively stable, the jet stream is weakening and meandering. With less temperature contrast to drive it, the flow now stalls, buckles, and forms persistent “omega blocks” and polar vortex leaks that trap extreme weather in place.

2. The AMOC
Freshwater from accelerating Arctic melt is disrupting the sinking of salty, dense water in the North Atlantic—a key driver of the AMOC. Multiple studies now show significant weakening, with early-stage collapse signatures emerging.

Both systems now oscillate directly over the North and Mid-Atlantic United States. Pennsylvania, situated beneath these interacting instabilities, has become a frontline example of climate volatility.

Pennsylvania: A Case Study in Rapid Climate Whiplash

In recent years—and especially in 2025—Pennsylvania has experienced dramatic climate swings that would have been statistically implausible just decades ago.

  • A record-wet spring driven by atmospheric rivers brought weeks of torrential rainfall.
  • This was followed almost immediately by drought conditions and repeated heat domes.
  • By late autumn, a stalled polar vortex plunged temperatures across much of the United States while drought re-emerged across the region.

These contradictions reflect a climate no longer anchored by stable circulation but instead governed by chaotic oscillations.

Rossby Waves: The Engine of Weather Extremes

Rossby waves—large meanders in the jet stream—are now amplified by polar warming. Their exaggerated loops trap weather systems, leading to:

  • Prolonged floods
  • Stalled heat domes
  • Flash droughts
  • Severe cold outbreaks

This “hydrologic whiplash” is a textbook example of nonlinear climate acceleration.

Late 2025: Polar Regions Show Record-Breaking Instability

As of November 2025, climate monitoring agencies report extreme conditions at both poles:

Antarctica

  • Lowest November sea ice extent on record
  • Regions near the Amundsen and Bellingshausen seas recorded extreme above-average temperatures
  • Large portions of ice shelves continue unprecedented thinning

Arctic

  • Second-warmest November ever recorded
  • Third-lowest November sea ice extent
  • Atmospheric temperatures soared above historical norms from Alaska to Siberia

These are not anomalies—they are acceleration signals.

Extreme Events of 2025 Illustrate a System in Breakdown

Hurricane Melissa: A New Benchmark for Rapid Intensification

Melissa ranks among the most explosively intensifying hurricanes in Atlantic history.

  • Winds doubled from 70 mph to 140 mph in only 18 hours
  • One of the fastest 24-hour intensification rates ever observed
  • Warm waters and decreased wind shear—both outcomes of climate warming—created ideal conditions

Rapid intensification is becoming the rule, not the exception.

Asia’s Twin Cyclone Catastrophe: A Rare and Deadly Event

The November 2025 rainstorms and landslides across Southeast Asia now rank among the region’s most devastating disasters in decades.

Severity Highlights:

  • Death toll exceeds 1,150 across Indonesia, Sri Lanka, Thailand, Malaysia, the Philippines, and Vietnam
  • Hat Yai, Thailand recorded 335 mm (13 in) of rain in a single day—the highest in 300 years
  • Cyclone Senyar formed in the Malacca Strait, only the second cyclone ever documented there
  • Infrastructure collapse affected over four million people
  • Catastrophic flooding and landslides followed back-to-back typhoons and monsoon rains

The rarity of these events reflects a system moving into previously uncharted territory.

The Broader Picture: A Climate System Entering Nonlinear Instability

What we are now witnessing is the combined outcome of:

  • Shrinking equator-to-pole temperature gradients
  • Jet stream destabilization
  • AMOC weakening
  • Accelerated polar melt
  • Intensification of Rossby waves
  • Record-breaking sea surface temperatures
  • Cascading feedback loops and tipping-point interactions

This is not simply “more extreme weather.” It is the emergence of a chaotic, nonlinear climate regime in which extremes intensify, persist, and compound in ways early climate models never captured.

The climate is no longer shifting gradually—it is reorganizing.

* Our probabilistic, ensemble-based climate model — which incorporates complex socio-economic and ecological feedback loops within a dynamic, nonlinear system — projects that global temperatures are becoming unsustainable this century. This far exceeds earlier estimates of a 4°C rise over the next thousand years, highlighting a dramatic acceleration in global warming. We are now entering a phase of compound, cascading collapse, where climate, ecological, and societal systems destabilize through interlinked, self-reinforcing feedback loops.

What Can I Do?
The single most important action you can take to help address the climate crisis is simple: stop burning fossil fuels.

Tipping points and feedback loops drive the acceleration of climate change. When one tipping point is toppled and triggers others, the cascading collapse is known as the Domino Effect.
The Human Induced Climate Change Experiment

bookmark_borderUpdate: Tree Extinction Due to Human-Induced Environmental Stress

by Daniel Brouse & Sidd Mukherjee

(Originally titled: “Foliage Spoilage & the Trees’ Canopy Collapse”)
A study by The Membrane Domain (2005–ongoing)

I. Overview

Long-term field observations, remote-sensing data, and new climate–biosphere models now converge on a disturbing conclusion: Earth’s forests are undergoing rapid, nonlinear decline driven by a cascading series of human-induced stressors. The interacting effects of pollution, drought, extreme weather, pest outbreaks, wildfire acceleration, and climate feedback loops have pushed multiple forest biomes into sink-to-source transitions, where forests emit more carbon than they absorb.

What began in 2001 as a study of visible canopy loss has evolved into documentation of a global systemic collapse. Satellite evidence confirms that large forest regions—including the African tropical moist broadleaf biome—have already shifted from net carbon sinks to net sources in a period of only seven years (Mensah et al. 2025). Similar transitions are now observed in boreal forests, peatlands, and other major carbon reservoirs.

These processes are not isolated. They are coupled, mutually reinforcing feedback loops capable of accelerating tree mortality on timescales far faster than traditional models predicted.

II. Sampling of Contributing Variables

A. Pollution

Pollution remains the most significant driver of global tree decline—and the most underestimated. Because pollution affects air, water, soil chemistry, and atmospheric chemistry simultaneously, its effects manifest through multiple pathways.

At the center of the problem is tropospheric ozone, a toxic oxidant produced by combustion byproducts (NOₓ, VOCs, methane). Ground-level ozone:

  • damages foliage and suppresses photosynthesis
  • reduces stomatal conductance and growth
  • diminishes drought and heat tolerance
  • increases vulnerability to pests, pathogens, and wildfire

Field and global datasets show that ozone pollution is responsible for a substantial portion of current forest mortality. A 2024 tropical forest analysis found that human-derived ozone has reduced net primary productivity (NPP) by ~17% since 2000, significantly weakening the tropical carbon sink.

Further reading:

  • The Dangers of Tropospheric Ozone
  • Tropospheric Ozone = Bad Ozone
  • The Ozone Know Zone
  • Gasoline Plus Ethanol Equals Bad Ozone

Ozone interacts with other pollutants—including nitrogen deposition, particulate matter, and acidifying compounds—to accelerate canopy loss and soil nutrient depletion. Thermal pollution (heat from combustion and urban surfaces) additionally increases ozone formation rates.

B. Water Stress

1. Drought

Recent decades have experienced unprecedented drought frequency and severity. Lower water tables, heat waves, and multi-year moisture deficits weaken root systems and diminish trees’ ability to withstand pests and disease.

2. Excess Rain / Acid Rain

Conversely, excessive rainfall—often more acidic and chemically reactive—damages leaves, alters soil pH, and dissolves essential micronutrients. Acid fog and cloudwater have been documented causing widespread leaf necrosis.

Both extremes—too little and too much water—are now more common due to climate change’s amplification of the hydrological cycle.

Further reading:
Will Tree Species Survive Climate Change?

C. Pests

1. Insects and Worms

Tree mortality from insects such as gypsy moths and borers has long been understood, but recent collapses in insect biodiversity (~80% declines) and changes in soil invertebrates are novel phenomena linked to warming and acidification.
Bee population losses create critical pollination failures. Worm colonization in previously worm-free northern forests has transformed soil structure and nutrient cycling, contributing to tree decline.

2. Invasive Species

A proliferation of invasive insects and plants—including ailanthus, Asian longhorn beetle, emerald ash borer, and persistent non-native earthworms—has destabilized forest ecosystems.

3. Short, Warm Winters

Warmer winters dramatically reduce larval mortality. USDA data:

  • At –17.8 °C: only 5% of emerald ash borer larvae die
  • At –34 °C: 98% mortality

These lethal cold thresholds are now rarely reached in many northern regions.

4. Deadwood Decomposition Feedback

A Nature study shows that insects contribute to ~29% of global deadwood carbon emissions, releasing ~10.9 Gt of carbon annually, comparable to or exceeding fossil-fuel emissions.

Examples:

  • Emerald Ash Borer
  • Whitebark Pine Beetle
  • Worm Invasion
  • Beetlemania
  • Utah Beetles

D. Climate Change Feedback Loops

Pollution, drought, heat, and pests each contribute to mortality—but it is the feedback between them that drives runaway decline.

Key climate feedback loops affecting trees:

  1. Warming → drought + heat waves → tree death → reduced carbon sink → more warming
  2. Ozone formation → reduced NPP → increased atmospheric CO₂ → enhanced warming
  3. Wildfires → massive GHG release + ozone production → more warming → more fires
  4. Permafrost thaw → CO₂ and CH₄ release → accelerated warming → boreal forest die-off

The Tree Extinctions scientific warning states that one-third of global tree species are now threatened with extinction, risking ecosystem collapse.

Wildfires as Accelerating Forces

Warming has intensified wildfire seasons globally. Highlights:

  • Australia (2019–2020): 24 million hectares burned; ecosystems that had not burned for 35,000 years were consumed
  • Northwestern U.S. & Canada (2021): record wildfire extent
  • Three of the last five U.S. years: >10 million acres burned
  • Canada 2023–2024: largest fires in modern history, releasing massive permafrost carbon

Hotter temperatures → more fires → fewer forests → more carbon emissions → hotter temperatures.

By 2070, ~2 billion people may live in Saharan-like heat zones (PNAS).

III. Example: The Decline of Penn’s Sylvania

Pennsylvania (“Penn’s Woods”) once embodied dense, towering forest ecosystems. Today, long-term observational data show:

  • rapid loss of older canopy trees
  • increased vine domination of the mid- and upper canopy
  • widespread ozone damage
  • drought-related stress
  • invasive species pressures
  • reduced winter chill
  • declining biodiversity

When canopy giants fall, light floods the understory, triggering explosive vine expansion that further suppresses regrowth. Trees, rooted in place, cannot migrate northward fast enough to escape rising temperatures and altered precipitation.

Pennsylvania’s decline mirrors global trends in temperate and boreal forests.

IV. Conclusion

Human activities—pollution, fossil combustion, land use, and climate alteration—are driving an accelerating cycle of tree mortality. Tropospheric ozone, previously underestimated in its global effect, now appears to be one of the dominant controls on forest health and productivity. When combined with drought, pests, invasive species, and wildfires, the result is a self-reinforcing, exponential decline in global forest stability.

Tree mortality accelerates global warming; warming accelerates further tree mortality.
This is no longer a linear problem—it is a cascading climate-biosphere emergency.

Immediate mitigation of fossil-fuel emissions, ozone precursors, and land-use drivers is essential if Earth’s forests—and the ecosystems and climate stability they support—are to survive the 21st century.

SOURCES
World Meteorological Organization (WMO) — Annual & special reports (2024–2025)


  • Global Carbon Project — Global Carbon Budget (2024–2025)

  • “Loss of tropical moist broadleaf forest has turned Africa’s forests from a carbon sink into a source,” Nature (2025).

  • R. (2025). “Evolution of Shear-Zone Fractures Presages the Disintegration of Thwaites Eastern Ice Shelf,” Adv. Earth & Space Sci., doi:10.1029/2025JF008352.

  • Hansen, J., Kharecha, P., & Morgan, D. (2025). “Global Warming Acceleration: Impact on Sea Ice” — data-driven analysis confirming acceleration of forcing trends. (Author manuscript/report.)

  • Lancet Countdown on Health and Climate Change — Annual report (2024–2025).

  • Natural Resources Canada — Coverage of Canada’s 2023 wildfires and permafrost/fire interactions (2023–2024).
  • “The contribution of insects to global forest deadwood decomposition,” Nature (2021).

  • IPCC AR6 and Assessment Reports — working group findings on forcings, feedbacks and sea-level projections.

  • NOAA — Sea level, extreme weather, and climate monitoring datasets (Tide gauge, satellite altimetry).
  • NASA — Ocean heat content and cryosphere monitoring pages (sea ice, glaciers, ice-sheet mass balance).

  • World Health Organization — Air pollution and health (PM2.5, ozone) statistics and reports.

  • Aviva / GallagherRE / Zurich — Industry reports and estimates on insured losses from extreme weather (2013–2024).

  • Membrane Domain — “Systemic Collapse” (Brouse & Mukherjee notes and working reports).

  • Membrane Domain — “The Dangers of Tropospheric Ozone: A Silent Threat to Health and the Environment.”

  • Mensah, A., et al. (2025). “Africa forest sink-to-source transition (2007–2017).” Scientific Reports / Nature family (see Nature link above).

  • Peer-reviewed studies and reviews on permafrost thaw, methane release, and boreal fire feedbacks (selected PNAS, Nature, Science articles, 2018–2025).

  • Trees and Deforestation

    The Human Induced Climate Change Experiment

    bookmark_borderTipping Into the Collapse Zone: How Feedback Loops Are Transforming Earth’s Carbon Sinks Into Carbon Sources

    By Daniel Brouse & Sidd Mukherjee
    November 30, 2025


    Introduction: The Carbon Sink Collapse Has Begun

    Earth’s major carbon sinks — forests, permafrost, and peatlands — have long buffered humanity from the full force of climate change. That buffer is now failing. Evidence from satellite data, field measurements, atmospheric chemistry, and wildfire emissions shows that multiple ecosystems are crossing tipping points simultaneously. These shifts are not gradual; they are driven by nonlinear feedback loops that accelerate greenhouse gas release and destabilize the climate system.

    Human activity is the root cause of this transition. Fossil fuel combustion, deforestation, land degradation, and pollution have combined to weaken and reverse the natural carbon balance, turning once-stable sinks into net greenhouse gas emitters of both CO₂ and methane.

    The emerging reality is stark: Earth’s biosphere is no longer reliably absorbing carbon — it is amplifying climate change.


    Africa’s Carbon Sink Reversal: A Planetary Warning

    A landmark 2025 study published in Nature, Loss of tropical moist broadleaf forest has turned Africa’s forests from a carbon sink into a source, provides a crucial data point in this global shift.

    Key findings include:

    • African forests and woody savannas historically served as a major carbon sink.
    • 2007–2010: Biomass increased by +439 ± 66 Tg yr⁻¹.
    • 2010–2015: Biomass shifted to a net loss of –132 ± 20 Tg yr⁻¹.
    • 2015–2017: Net biomass loss continued at –41 ± 6 Tg yr⁻¹.
    • Tropical moist broadleaf forest deforestation was the primary driver.
    • Shrub encroachment in savannas offered only limited offsetting gains.

    The transition from sink to source occurred within a decade — far faster than conventional climate models predicted.

    The authors warn that achieving the Glasgow Leaders’ Declaration and updating Nationally Determined Contributions under the Paris Agreement will require far more ambitious global deforestation policies, as the decline of natural carbon sinks is widening the emissions gap.


    Runaway Feedback Loop #1: Permafrost Collapse and Year-Round Fire

    Permafrost melt is one of the clearest demonstrations of how climate feedback loops exceed linear expectations.

    Old assumption:
    Permafrost would thaw gradually over millennia, releasing CO₂ and CH₄ slowly.

    Observed reality:
    Large swaths of permafrost are thawing abruptly, collapsing into mud, and — in an unprecedented development — burning year-round.

    Wildfires in high-latitude peat soils are now releasing carbon on a scale once thought impossible in this century. Data from Canada’s record-shattering 2023 wildfire season confirms that its forests have become net carbon sources for the first time on record.
    (See: Natural Resources Canada, 2023)

    New Scientific Unknowns Introduced by Permafrost Fire

    • Combustion releases CO₂ rapidly, accelerating warming.
    • Some methane ignites and is converted to CO₂ — a minor “natural flaring” effect.
    • Much methane escapes unburned.
    • The ratio of burned vs. unburned methane remains poorly constrained.

    The key point: permafrost carbon feedbacks are releasing greenhouse gases orders of magnitude faster than legacy climate models projected.


    Runaway Feedback Loop #2: Tropospheric Ozone and the Collapse of Biospheric Productivity

    Climate feedbacks are not limited to warming. The chemistry of fossil fuel combustion creates secondary pollutants that directly attack the biosphere. One of the most dangerous is tropospheric ozone — a potent phytotoxin.

    Ozone’s Role in Accelerating Ecosystem Collapse

    • Reduces plant growth by 10–40% across many species.
    • Causes direct tissue damage to leaves and roots.
    • Weakens resistance to drought, pests, pathogens, and heat.
    • Leads to premature mortality in trees and crops.
    • Drives reductions in Net Primary Productivity (NPP) of 20–70% in sensitive regions.
      (See: Ground-Level Ozone and Carbon Drawdown, membrane.com)

    This is not hypothetical. Global forests have shifted from carbon sinks to net carbon sources for the past two consecutive years, driven by ozone stress, wildfire emissions, and drought compounds.

    Field Evidence From Pennsylvania

    Our two-decade field study (2003–2025) shows:

    • Old-growth trees have lost ~40% of foliage over multi-year intervals.
    • Canopy height has declined by ~33%.
    • Mortality rates have accelerated dramatically.

    These findings mirror global NPP declines and highlight ozone as an underrecognized driver of biospheric collapse.


    The Feedback Web: How Warming, Ozone, Wildfire, and Ecosystem Death Reinforce Each Other

    The feedback loops described here are tightly interconnected:

    1. Fossil fuel combustion → increases CO₂ + ozone precursors.
    2. Ozone → reduces plant productivity → lowers carbon uptake.
    3. Warming + drought → increase wildfire frequency.
    4. Wildfires → emit CO₂ + ozone precursors → produce more ozone.
    5. Permafrost fires → add CO₂ and CH₄ at record rates.
    6. Methane release → accelerates warming → further ozone formation.

    This is not a linear sequence — it is a self-reinforcing network of processes, each amplifying the others. Earth’s regulatory systems are being destabilized simultaneously, pushing the planet toward a state of compound, cascading instability.


    Crossing the Threshold Into Nonlinear Climate Behavior

    Linear projections drastically underestimate the risk. Nonlinear systems behave differently:

    • Thresholds can be crossed abruptly.
    • States can shift rapidly and irreversibly.
    • Small additional forcings can trigger large-scale transformations.
    • Feedbacks can synchronize and accelerate together.

    The collapse of forests, the thawing of permafrost, and the rise of global ozone stress reflect active tipping points, not future ones.

    The Climate Trajectory Is Compressing

    Processes once believed to unfold over centuries are now occurring within decades — or even years. Feedbacks once considered “theoretical” are already reshaping Earth’s atmosphere, hydrology, and ecosystems.

    This is the central scientific question of our time:
    How quickly, and through what pathways, will runaway feedbacks redefine Earth’s climate system?

    Our research focuses on quantifying these acceleration rates and mapping the tipping dynamics that will determine the future of human civilization.


    Additional References

    http://membrane.com/global_warming/Systemic-Collapse.html
    http://membrane.com/global_warming/Ozone-Low-Level.html
    http://membrane.com/global_warming/Amazon-Collapse.html
    http://membrane.com/global_warming/Nonlinear-Dominoes-of-Climate-Collapse.html
    http://membrane.com/trees/
    http://membrane.com/trees/death-by-ozone.html

    bookmark_borderThe Collapse Point: How Climate Change Is Breaking Insurance — and Capitalism With It

    by Daniel Breouse / November 26, 2025

    As extreme weather accelerates, humanity is nearing a tipping point where insurance — and the economic system built upon it — may no longer function. One of the world’s largest insurers, Allianz SE, has issued an unusually blunt warning: the climate crisis is destabilizing global capitalism from within, and the breakdown has already begun.

    Allianz board member Gunther Thallinger, who also chairs the company’s investment board, argues that rising temperatures and worsening climate disasters are pushing many risks past the limits of insurability. And when insurance fails, everything built on top of it — mortgages, real estate markets, infrastructure investment, business lending, and even municipal budgets — begins to unravel.

    His message is simple and grim:
    “Heat and water destroy capital.”

    Flooded homes lose value. Overheated cities become uninhabitable. Billion-dollar infrastructure corrodes, warps, or burns. Entire asset classes are degrading in real time.

    The consequences ripple far beyond insurance claims. They threaten the foundational assumptions of modern capitalism itself.

    A Financial System on the Brink

    The planet is currently on track for 2.2°C to 3.4°C of warming — well beyond the thresholds that insurers, governments, and markets are designed to withstand. Global temperatures have already surpassed 1.5°C and are projected to blow past 3°C within a decade.

    At that level of heating:

    • The number and severity of disasters become too frequent to price.
    • Extreme losses arrive faster than insurers can rebuild capital.
    • Governments cannot bail out the private sector at the required scale.
    • Entire regions become economically nonviable.

    The numbers already paint the picture of an economy under siege:

    • $2 trillion in climate-related damages from 2013–2023 (Aviva).
    • $400 billion in 2024 alone (Gallagher RE).
    • A fivefold increase in annual weather-related losses in Europe since the 1980s.

    Insurers like Zurich now openly state that achieving net-zero emissions by 2050 is essential to prevent systemic collapse.

    Thallinger’s warning:
    We may not have until 2050.

    In California, major carriers have already stopped writing home insurance in fire-prone regions. In Florida, companies are fleeing as storm intensities shred actuarial models. These are not hypotheticals — they are the first cracks in the global financial foundation.

    When the Math Breaks Down

    Insurance only works when the risks are measurable and the premiums remain affordable. Climate change destroys both conditions.

    Thallinger is explicit:

    “As temperatures rise to 1.5°C, 2°C, 3°C, insurers will no longer be able to offer coverage. The premiums required exceed what people or companies can pay. This is already happening.”

    If insurance fails:

    • Banks cannot issue mortgages.
    • Developers cannot secure financing.
    • Cities cannot bond infrastructure.
    • Home values collapse.
    • Industries become stranded.
    • Governments face spiraling bailout demands they cannot meet.

    This is the hidden climate tipping point — a systemic failure that happens quietly, through spreadsheets and canceled policies, before it erupts into a full-blown economic crisis.

    What the Industry Says Must Happen (and Why It Isn’t Happening)

    Klaus-Peter Röhler, another Allianz board member, outlines what is required to keep insurance viable:

    1. Massive prevention and adaptation

    Climate-resilient building codes, flood defenses, and infrastructure upgrades.
    Europe has completed only 5% of its planned flood protection projects.
    At the current pace, it will take 100 years to finish.

    2. Risk-based pricing

    Political pressure often forces insurers to keep premiums artificially low — a recipe for insolvency. Without prices that reflect real risk, insurers collapse sooner.

    3. Government stop-loss support for extreme events

    Governments should backstop only the rarest, most catastrophic disasters — not routine damage that should be prevented through better planning.

    No country has successfully implemented this triad.
    Some, notably the United States, demonstrate what happens when policymakers block these measures:

    • California: Wildfire risk makes coverage unavailable at any price.
    • Florida: Storm losses and dysfunctional regulation have triggered an insurance exodus.
    • State-run bailout insurers are failing under the load.

    The lesson is clear: Insurability is not guaranteed.
    It must be preserved — and it is being lost region by region.

    What Happens Next

    Allianz emphasizes that policyholders, governments, and insurers all have roles to play — but adaptation can only delay collapse if emissions continue rising.

    Without rapid decarbonization:

    • More regions will become uninsurable.
    • Financial shocks will cascade into housing, banking, and municipal finance.
    • Capitalism, which relies on pricing risk, will have no mechanism to allocate it.
    • Entire coastal and heat-exposed regions could lose economic viability.

    We are approaching a world in which the question will not be whether people can afford insurance — but whether insurance can afford people.

    The Real Tipping Point Isn’t Just Environmental — It’s Economic

    Climate change is often framed as a humanitarian crisis or an environmental challenge. It is far more than that.

    It is a capital destruction engine operating on a planetary scale.

    Insurance is simply the first part of the system to falter, because it is the first to directly feel the mathematical impossibility of infinite losses on a finite balance sheet. But what follows is not limited to insurers:

    • Mortgage markets fail.
    • Municipal bond markets seize up.
    • Infrastructure investment dries out.
    • Property values collapse.
    • Supply chains face continuous disruption.
    • Governments pick up costs they cannot bear.
    • Capitalism enters an unmanageable risk spiral.

    Unless warming is rapidly halted, we will cross a line where risk can no longer be transferred, financed, or recovered.

    That is the collapse point.

    * Our probabilistic, ensemble-based climate model — which incorporates complex socio-economic and ecological feedback loops within a dynamic, nonlinear system — projects that global temperatures are becoming unsustainable this century. This far exceeds earlier estimates of a 4°C rise over the next thousand years, highlighting a dramatic acceleration in global warming. We are now entering a phase of compound, cascading collapse, where climate, ecological, and societal systems destabilize through interlinked, self-reinforcing feedback loops.

    What Can I Do?
    The single most important action you can take to help address the climate crisis is simple: stop burning fossil fuels.

    Tipping points and feedback loops drive the acceleration of climate change. When one tipping point is toppled and triggers others, the cascading collapse is known as the Domino Effect.

    The Human Induced Climate Change Experiment

    bookmark_borderSudden Sea Level Pulses: How “Cork Release” Ice-Sheet Failures Could Rapidly Reshape Global Coastlines

    By Daniel Brouse and Sidd Mukherjee

    November 25, 2025

    Introduction: The Shift From Gradual to Abrupt Sea Level Rise

    Sea level rise (SLR) is one of the most revealing indicators of the accelerating pace of climate change. A century ago, global SLR was doubling roughly every 100 years. Ten years ago the doubling time had collapsed to a decade. By 2023, the doubling time had plunged to only two years.

    This extraordinary acceleration led us to focus on a much more dangerous and poorly modeled phenomenon:

    Sudden Sea Level Pulses (SSLPs) — rapid, stepwise jumps in sea level triggered by abrupt ice-sheet failures, subglacial “cork release” events, and ice-shelf structural collapse.

    These pulses are not hypothetical. They are beginning to occur.

    Examples include:

    • Greenland Subglacial Flood: A massive outburst where trapped meltwater burst through the ice, demonstrating the potential for sudden hydrofracture.
    • Alaska’s Mendenhall Glacier Outburst: A glacial flood that produced rapid, dangerous water-level increases downstream.

    A detailed overview is archived at:
    http://membrane.com/global_warming/Greenland-Ouburst.html

    These events reveal something ice-sheet models have not yet fully integrated: meltwater can accumulate beneath ice until pressure surpasses structural integrity, causing the ice surface to fail catastrophically — a “cork release.” When this occurs at scale, sea levels can jump not millimeters per year, but multiple feet per year.

    Why This Matters: The Risk of Abrupt, Multi-Foot Sea Level Jumps

    The public still imagines sea level rise as a slow, linear process. But the Earth system does not behave linearly. When hydrofracture and ice-cliff collapse become common, we could face:

    • Multi-foot sea level increases within a single decade
    • 1–3 feet of rise within a single year in extreme pulse scenarios
    • Little or no time for adaptation in cities like Miami, New York, Mumbai, Lagos, and Shanghai

    Current global climate models fail to incorporate most “cork release” pathways because:

    • Subglacial water transport is poorly mapped
    • Meltwater storage and pressurization are not well parameterized
    • Ice-shelf fracture mechanics are only partially resolved
    • Positive feedback loops — such as meltwater-driven lubrication and ice-cliff collapse — are not modeled dynamically

    The Greenland outburst events show that ice sheets can undergo abrupt, nonlinear failures — far faster than infrastructure, economies, or governance systems can adapt.

    Sidd summarized it best:

    “Under-ice hydrology is hard to observe… but once enough pressure builds, ice doesn’t melt — it fractures.”

    Antarctica: The System Most Likely to Produce Catastrophic Pulses

    While Greenland contributes meaningfully to long-term SLR, Antarctica is the critical risk for abrupt sea level pulses.

    The East Antarctic Ice Sheet (EAIS)

    • Holds ~170 feet of potential sea level rise
    • Once thought stable for millennia
    • Now showing early signs of warming-driven destabilization
    • Marine-based sectors may begin collapsing this century

    The West Antarctic Ice Sheet (WAIS)

    • Highly vulnerable
    • Resting on retrograde (downward-sloping) bedrock
    • Warm ocean water is eroding the shelves from below
    • Pinning points are failing, which removes the natural “brakes”

    Sidd’s assessment:

    Greenland: “Effectively lost,” 100–300 years, +20 ft
    West Antarctica: Likely collapse within decades to ~100 years, +10 ft

    Total plausible rise by 2125: 20–30 feet, with the possibility of sudden pulses:

    “We could dawdle along at half an inch a year, then see a few years at a foot per year.”

    New Evidence: The Impending Failure of Thwaites Eastern Ice Shelf (TEIS)

    In November 2025, Advancing Earth and Space Sciences published a landmark study:
    “Evolution of Shear-Zone Fractures Presages the Disintegration of Thwaites Eastern Ice Shelf”
    (https://agupubs.onlinelibrary.wiley.com/doi/10.1029/2025JF008352)

    The TEIS is a keystone structure. Once it collapses, the glacier behind it — the “Doomsday Glacier” — will accelerate dramatically. The study found:

    Key Findings

    1. Long-term shear fracturing (2002–2017):
      Large fractures formed parallel to flow as the shelf strained against its pinning point.
    2. Recent explosive tensile fracturing (2017–2022):
      Smaller, orthogonal fractures began proliferating, indicating that structural integrity is failing.
    3. Dynamic destabilization:
      Satellite and GPS data reveal velocity perturbations rippling across the shelf as fractures expand — a sign of imminent collapse.
    4. Transition of the pinning point from stabilizer to destabilizer:
      Echoing Benn et al. (2022), the pinning point now increases fracture stress instead of reducing it.
    5. Self-reinforcing feedback loop:
      The shelf appears to be entering the “damage-acceleration-damage” feedback proposed by Lhermitte et al. (2020), a hallmark of impending disintegration.

    What This Means

    When TEIS collapses — an event many glaciologists now expect within years to a decade — Thwaites Glacier could:

    • accelerate dramatically
    • initiate ice-cliff collapse
    • trigger multi-foot sea level pulses within short timescales

    This is the largest currently unfolding structural failure in the cryosphere.

    Cork-Release Events: A Distinct Class of Tipping Point

    We define a “cork release” event as:

    A sudden failure of ice or subglacial pressure systems causing rapid, high-volume discharge of water or ice into the ocean.

    These events include:

    • subglacial lake drainage
    • rapid ice-shelf collapse
    • meltwater-driven hydrofracture
    • ice-cliff structural failure

    Unlike gradual melt, cork-release events:

    • are nonlinear
    • occur suddenly
    • accelerate with warming
    • have global consequences within months to years
    • are triggered by thresholds that are difficult to predict

    This makes them one of the most dangerous — and least modeled — climate feedbacks.

    Conclusion: The Urgent Need to Model Abrupt Sea Level Change

    The climate system is not simply warming. It is accelerating, destabilizing, and producing events far outside historical norms. Sea level rise will not be a smooth curve; it will be stepwise, punctuated by abrupt pulses.

    To prepare for what is coming, climate science and adaptation planning must incorporate:

    • ice-shelf fracture dynamics
    • under-ice hydrology
    • subglacial pressurization
    • ice-cliff collapse physics
    • nonlinear feedbacks
    • sudden sea level pulse scenarios

    Human systems are built for gradual change. The cryosphere is not.

    The question is no longer if abrupt sea level pulses will occur — but how soon, how large, and how many.

    * Our probabilistic, ensemble-based climate model — which incorporates complex socio-economic and ecological feedback loops within a dynamic, nonlinear system — projects that global temperatures are becoming unsustainable this century. This far exceeds earlier estimates of a 4°C rise over the next thousand years, highlighting a dramatic acceleration in global warming. We are now entering a phase of compound, cascading collapse, where climate, ecological, and societal systems destabilize through interlinked, self-reinforcing feedback loops.

    What Can I Do?
    The single most important action you can take to help address the climate crisis is simple: stop burning fossil fuels. There are numerous actions you can take to contribute to saving the planet. Each person bears the responsibility to minimize pollution, discontinue the use of fossil fuels, reduce consumption, and foster a culture of love and care. The Butterfly Effect illustrates that a small change in one area can lead to significant alterations in conditions anywhere on the globe. Hence, the frequently heard statement that a fluttering butterfly in China can cause a hurricane in the Atlantic. Be a butterfly and affect the world.

    → “Solutions to the Fossil Fuel Economy and the Myths Accelerating Climate and Economic Collapse.“

    Tipping points and feedback loops drive the acceleration of climate change. When one tipping point is toppled and triggers others, the cascading collapse is known as the Domino Effect.

    The Human Induced Climate Change Experiment

    bookmark_borderThe Non-Linear Acceleration of Climate Change: Evidence, Confirmation, and the Emerging Domino Effect

    By Sidd Mukherjee and Daniel Brouse
    November 22, 2025

    In the 1990s, we developed what became known as The Non-Linear Acceleration Hypothesis—the proposition that climate change is not progressing linearly but is accelerating exponentially. Working together, with Sidd’s background as a Doctor of Physics from Ohio State and my own experimental and observational analyses, we produced the foundational evidence for this theory. By the early 2000s, our work had evolved into a recognized climate framework, validated repeatedly through independent replication and supported by an expanding body of empirical data. Over the decades, this body of confirmation has solidified into the scientific consensus we see today.

    Shrinking Doubling Times and Escalating Impacts

    One of the most compelling indicators of nonlinear acceleration is the dramatic contraction of the doubling time of climate impacts—the interval in which damage effectively doubles due to interacting feedback processes. In the mid-20th century, the doubling time was on the order of 100 years. By the early 2000s, it had fallen to 10 years, and recent analyses show that it has now plunged to approximately 2 years.

    This means that the impacts of climate change today are twice as severe as they were two years ago. If the doubling time remains constant, they will be four times worse in two years, eight times worse in four years, and potentially sixty-four times worse within a decade. These estimates are conservative; the doubling period continues to shorten as feedbacks intensify. With no meaningful global mitigation underway, the trajectory is unmistakable and vastly more catastrophic than previously projected.

    Hansen’s Confirmation of the Acceleration Hypothesis

    We have long regarded Dr. James E. Hansen as one of the principal founders of modern climate science. In April 2025, Hansen’s paper Global Warming Acceleration: Impact on Sea Ice provided a direct, data-driven confirmation of our hypothesis. His analysis demonstrated that global warming is accelerating, and that climate sensitivity is higher than IPCC estimates, fundamentally altering expectations for 21st-century warming.

    Hansen concluded that IPCC models underestimate both climate sensitivity and key feedback processes. Under current emissions levels, he projects that warming by 2100 is likely to exceed 7°C, dramatically raising the probability of crossing multiple climate tipping points.

    In November 2025, Hansen, Kharecha, and Morgan published Warning! This “Colorful Chart” Is Censored by IPCC, offering further confirmation.

    Accelerated Forcing Growth

    Their analysis centers on a chart showing the five-year running mean of the annual increase in greenhouse gas forcing. Over the past 15 years, they find that the rate of increase has surged to ~0.5 W/m² per decade—far higher than IPCC projections. This acceleration is not reflected in IPCC scenarios and is fundamentally incompatible with its claims of remaining “pathways” to 1.5°C or 2°C.

    Implications for Climate Scenarios

    • Current forcing trajectories align closely with RCP 8.5, the high-end “business-as-usual” pathway.
    • They diverge sharply from RCP 2.6, the scenario often used for policy optimism.
    • Achieving RCP 2.6 today would require $2.4–5 trillion per year using current technology.
    • RCP 2.6 also presumes unrealistic levels of biomass burning plus carbon capture, which Hansen calls politically and practically unviable.

    Critique of IPCC’s Modeling and Transparency

    Hansen and colleagues argue that the IPCC relies too heavily on Integrated Assessment Models (IAMs), which they describe as opaque “dark boxes”—tools that embed assumptions that are rarely examined in public-facing science.

    They highlight that:

    • Scientists have not adequately communicated the severity of accelerating forcings.
    • Carbon pricing is vastly more effective than prescriptive international agreements.
    • Missed opportunities since the Montreal Protocol have allowed forcings to climb unchecked.
    • Early COP negotiations excluded nuclear power from the Clean Development Mechanism—a decision they view as scientifically indefensible.

    Climate Sensitivity and Near-Term Risk

    Hansen’s findings, along with related analyses, suggest climate sensitivity in the range of 4–5°C per CO₂ doubling, substantially above many IPCC estimates. They warn that without extraordinary action within the next 5–10 years, Earth could be locked into a high-warming trajectory that destabilizes major climate systems.

    Strengths of Hansen’s Argument

    • Data-driven approach grounded in measured forcings with ~10% uncertainty.
    • Clear policy relevance connecting forcing to cost, mitigation feasibility, and economic risk.
    • Strong emphasis on accelerating risk, consistent with observed feedback behavior.
    • Valid critique of IAM transparency, echoing long-standing concerns within the scientific community.

    Broader Implications

    If Hansen et al. are correct, the window for avoiding catastrophic warming is significantly narrower than models suggest. Their work underscores the need for:

    • Greater transparency in climate modeling
    • Rapid implementation of carbon pricing
    • Reevaluation of technological pathways
    • Public communication that aligns with empirical reality

    Their findings also increase the urgency of addressing the accelerating feedback loops we identified decades ago.

    The Domino Effect: Cascading Tipping Points

    Building on nonlinear thermodynamics and chaos theory, we now know that climate tipping points are not isolated events—they interact. As major systems destabilize, they trigger secondary failures, creating a cascade of compounded impacts.

    Our recent synthesis of 2024–2025 data shows:

    • CO₂ concentrations, fossil fuel emissions, and global temperatures all reached record highs.
    • Natural carbon sinks are beginning to convert into carbon sources.
    • Feedbacks across ice loss, ocean circulation, albedo decline, and atmospheric chemistry are synchronizing.
    • These interactions are driving what we call the Domino Effect—a system-wide cascade that threatens global habitability within this century.

    * Our probabilistic, ensemble-based climate model — which incorporates complex socio-economic and ecological feedback loops within a dynamic, nonlinear system — projects that global temperatures are becoming unsustainable this century. This far exceeds earlier estimates of a 4°C rise over the next thousand years, highlighting a dramatic acceleration in global warming. We are now entering a phase of compound, cascading collapse, where climate, ecological, and societal systems destabilize through interlinked, self-reinforcing feedback loops.

    What Can I Do?
    The single most important action you can take to help address the climate crisis is simple: stop burning fossil fuels. There are numerous actions you can take to contribute to saving the planet. Each person bears the responsibility to minimize pollution, discontinue the use of fossil fuels, reduce consumption, and foster a culture of love and care. The Butterfly Effect illustrates that a small change in one area can lead to significant alterations in conditions anywhere on the globe. Hence, the frequently heard statement that a fluttering butterfly in China can cause a hurricane in the Atlantic. Be a butterfly and affect the world.

    → “Solutions to the Fossil Fuel Economy and the Myths Accelerating Climate and Economic Collapse.“

    Tipping points and feedback loops drive the acceleration of climate change. When one tipping point is toppled and triggers others, the cascading collapse is known as the Domino Effect.

    The Human Induced Climate Change Experiment

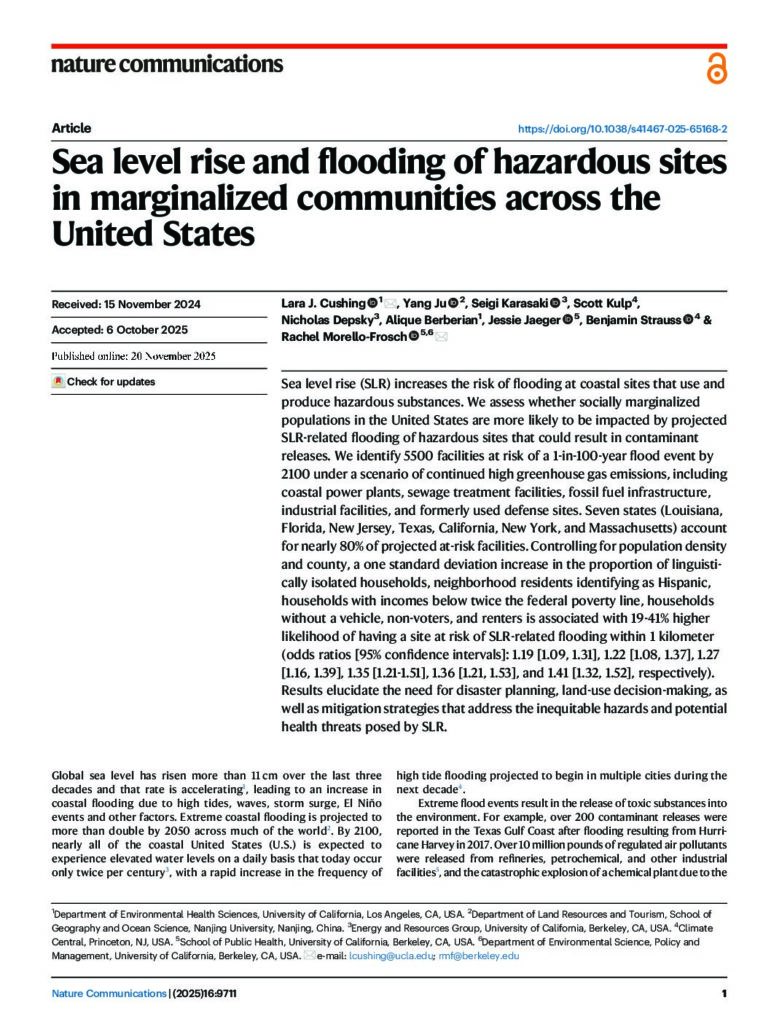
    bookmark_borderFlooding at Coastal Sites That Use and Produce Hazardous Substances

    Sea level rise and flooding of hazardous sites in marginalized communities across the United States
    Published in Nature / 20 November 2025

    Sea level rise (SLR) increases the risk of flooding at coastal sites that use and produce hazardous substances. We assess whether socially marginalized populations in the United States are more likely to be impacted by projected SLR-related flooding of hazardous sites that could result in contaminant releases. We identify 5500 facilities at risk of a 1-in-100-year flood event by 2100 under a scenario of continued high greenhouse gas emissions, including coastal power plants, sewage treatment facilities, fossil fuel infrastructure, industrial facilities, and formerly used defense sites. Seven states (Louisiana, Florida, New Jersey, Texas, California, New York, and Massachusetts) account for nearly 80% of projected at-risk facilities. Controlling for population density and county, a one standard deviation increase in the proportion of linguistically isolated households, neighborhood residents identifying as Hispanic, households with incomes below twice the federal poverty line, households without a vehicle, non-voters, and renters is associated with 19-41% higher likelihood of having a site at risk of SLR-related flooding within 1 kilometer.

    Flooding at Coastal Sites That Use and Produce Hazardous Substances

    Flooding at Coastal Sites That Use and Produce Hazardous Substances

    bookmark_borderThe Physics Behind the 252-mph Gust: Why Hurricane Melissa Signals a New Era of Extreme Storms

    By Daniel Brouse / November 19, 2025

    Hurricane Melissa recorded a 252 mph wind gust, which shatters the previous highest record of 248 mph from Typhoon Megi in 2010, according to UCAR.

    If you’re interested in flow dynamics… this is the highest verified hurricane wind speed ever recorded on Earth.

    Climate change is increasing both the frequency and the intensity of extreme systems because the added thermal energy in the climate system does not stay as “heat” — it expresses itself through non-linear atmospheric dynamics. Warmer oceans load storms with more latent heat, more moisture, and stronger pressure gradients. That extra energy then appears as faster wind velocities, more violent updrafts, tighter eyewalls, and explosive rapid intensification cycles that didn’t occur at today’s frequency in the past.

    In other words, we aren’t just “warming the air.”
    We’re supercharging the fundamental physics of storms — momentum, turbulence, vorticity, and flow — which is why records like this are being broken more often and with greater severity.

    The atmosphere is running on a different set of rules now — not because anyone “believes” in climate change, but because the math and the measurements leave no room for debate.

    Start with the simplest fact in atmospheric science:
    A warmer atmosphere holds about 7% more water vapor per 1°C of warming. That’s not a theory — that’s the Clausius–Clapeyron relation, a physical law.

    We’ve warmed the planet more than 1°C already. That means storms today have 10–15% more moisture available, which translates directly into dramatically more energy and more violent rain.

    Now connect this to flow dynamics:

    1. Violent Rain: Mass × Velocity = Momentum

    Raindrop size is increasing. Raindrop count is increasing.
    And storms are producing higher wind velocities, which accelerate the droplets further.

    Momentum p=mv.

    More mass → more momentum.
    More velocity → more momentum.
    More momentum → more turbulence, more kinetic energy, more destructive power.

    This isn’t speculation — it’s measurable.

    2. Energy Release: Latent Heat

    That extra water vapor carries enormous latent heat.
    When it condenses, it releases energy that intensifies updrafts, pressure gradients, and storm organization. This creates:

    • faster strengthening
    • more explosive rainfall rates
    • more dangerous mesoscale convective systems
    • more catastrophic flash floods

    This is why storms that used to drop 1–3 inches now dump 5–15 inches in a day.

    3. Flow Dynamics After Rainfall

    Once water hits the ground, the physics get even more brutal.

    Force scales with the square of velocity (v²).

    A 40 mph flow has 16× the force of a 10 mph flow.
    And water is ~800× denser than air.

    That is why modern flash floods move cars, rip out culverts, scour foundations, and carve out roads in seconds.

    4. What You’re Calling “Not Climate Change”

    The real world says otherwise:

    • Record-breaking rainfall events are happening at 4× the historical rate.
    • “1,000-year floods” are now occurring every few years.
    • Storms are intensifying faster and producing higher peak rainfall.
    • Several regions have already documented rainfall rates once considered meteorologically impossible.

    This isn’t politics.
    This isn’t a belief system.
    This is physics — and we are watching it unfold in real time.

    So yes… Climate change. Absolutely climate change.

    Footnotes

    NCAR has confirmed the 252 mph dropsonde gust in Hurricane Melissa as legitimate. Yes — it’s the highest ever recorded by a dropsonde and essentially tied with Cyclone Olivia’s 253 mph gust measured with ground instruments.

    But focusing on whether it’s 1 mph higher or lower is meaningless in context. A 1 mph difference is statistically irrelevant when you’re dealing with storms undergoing record-breaking rapid intensification, unprecedented energy transfer, and historic drops in barometric pressure. These are the metrics that matter scientifically — and they’re the ones that are changing fastest.

    The real story isn’t the bragging rights of a single gust measurement.
    It’s that we are now routinely seeing:

    • extreme pressure falls that used to be once-in-a-lifetime events,
    • rapid intensification windows that defy past climatology,
    • and nonlinear energy spikes driven by warm SSTs and excess atmospheric moisture.

    Melissa’s 252 mph gust is just one data point in a larger pattern: tropical cyclones are entering regimes of intensity that were virtually unknown in the pre-warming climate.

    Recent Papers

    The Human Induced Climate Change Experiment

    bookmark_borderThe Physics of Violent Rain: Turning Ordinary Storms Into Catastrophic Events

    by Daniel Brouse and Sidd Mukherjee
    November 18, 2025

    We’ve been working specifically on the physics of what we now call violent rain, and once you fully understand latent heat, the entire climate system reveals a deeper and far more alarming complexity. Latent heat is not just a chapter in a textbook; it is the engine behind much of Earth’s atmospheric power. But the energy budget is only the entry point. The way that energy manifests — through momentum, turbulence, pressure gradients, and flow dynamics — is some of the most elegant, and now increasingly dangerous, mathematics in climate science.

    The fatal mistake many people make is equating “global warming” strictly with warmer temperatures. The additional heat does not simply remain as heat. It is continually exchanged, transformed, and expressed throughout the climate system. It reappears as massive increases in atmospheric moisture, sharper pressure differentials, explosive updrafts, and an atmosphere filled with stored potential energy waiting for the right trigger to be released.

    A warmer atmosphere can hold about 7% more water for every 1°C of warming. Over the full temperature anomaly we are now entering, this increased capacity nearly doubles the amount of moisture available to A warmer atmosphere can hold about 7% more water for every 1°C of warming. Over the full temperature anomaly we are now entering, this increased capacity nearly doubles the amount of moisture available to storms. This is not theoretical — it is already transforming rainfall dynamics worldwide. Parts of the world, especially the poles, are now experiencing temperature anomalies that remain more than 22°C above normal for extended periods, supercharging atmospheric moisture and destabilizing global circulation patterns.

    One of the most overlooked consequences of this added energy is the rise in both raindrop size and raindrop count. Larger droplets fall faster, strike harder, and inject more energy into the air column, intensifying turbulence. Upon impact with the ground, they deliver far more kinetic energy than raindrops did even a generation ago. Using the momentum relation p = mv:

    • As mass increases, momentum increases.
    • As velocity increases, momentum increases.

    More momentum means more turbulence, more kinetic energy, and more destructive rainfall.

    People already sense this intuitively — the louder impact of rain on roofs, water bouncing higher off pavement, and downpours that feel physically heavier — but few connect these sensations to the underlying physics.

    The destructive power of violent rain actually begins before the drops reach the ground. As storms intensify, raindrops become larger and wind velocities rise, accelerating them horizontally and vertically. Because both m (mass) and v (velocity) increase, each raindrop carries significantly more momentum than in past climates.

    Stronger horizontal winds effectively act as a second gravitational pull, increasing the angle and force of impact. This is why wind-driven rain can sting the skin, shred crops, strip leaves from trees, and erode soils far more quickly than vertical rainfall alone. The increased velocity also injects more energy into the air column, amplifying turbulence, updraft strength, and pressure gradients — processes that feed storm intensification.

    Once the water reaches the ground, flow dynamics dominate. Force scales with the square of velocity (v²), and density multiplies that force dramatically:

    • A 20 mph wind exerts 4× the force of a 10 mph wind.
    • A 40 mph wind exerts 16× the force.
    • A 60 mph wind exerts 36× the force.

    Now apply the same physics to water, which is ~800 times denser than air:

    • A shallow 10 mph sheet of runoff exerts 800× the force of a 10 mph wind.
    • At 20 mph, the force becomes 3,200×.
    • At 40 mph — common in debris-laden flash floods — the force jumps to 12,800×.

    When storms produce larger raindrops and faster-moving rain, driven by extreme heat anomalies and stronger wind fields, the resulting flows carry exponentially greater destructive potential. This is why hillsides fail more quickly, roads wash out more often, and floodwaters rise and accelerate with far greater violence in a warming climate — and why these events are unfolding years to decades ahead of earlier projections.

    As rainfall intensity spikes, so do these destructive flow forces. This is why modern storms overwhelm culverts, stormwater systems, levees, dams, and hillside soils. It’s why slopes liquefy, bridges scour, and infrastructure collapses in events that used to be considered “routine.”

    The mathematics is beautiful — but the consequences are devastating. Violent rain is not a metaphor — it is the physical expression of a climate system carrying far more energy, mass, and momentum than it did just a few decades ago. And every additional fraction of a degree adds more fuel to that system.

    For anyone watching closely, the evidence is not abstract. It’s outside your window.

    The Climate Crisis: Violent Rain | Extreme Weather Events | Insurance | Soil | Updates

    The Human Induced Climate Change Experiment

    bookmark_borderThe Climate Has Entered a Runaway Phase: Why “1.5°C” No Longer Describes Our Reality

    By Daniel Brouse and Sidd Mukherjee
    November 17, 2025

    Q: What is happening with climate change?
    A: It is accelerating at an exponential rate — far faster than the public narrative or old models suggest.

    For years, the world was taught to focus on “holding global warming to 1.5°C.” But that number has quietly become meaningless. Not only have we likely crossed it already, the real danger is not the temperature itself — it is the tipping points that crossing that threshold has set in motion. These tipping points have triggered cascading, self-reinforcing feedback loops that are now reshaping Earth’s systems with unprecedented speed.

    We are not approaching a climate crisis.
    We are living inside its accelerating phase.

    Why the “Global Average Temperature” Is a Misleading Metric

    A global average masks extremes — the very extremes that dictate human survival.

    A 3°C rise in the global mean may sound manageable, but that average blends together oceans, land, and atmosphere. Because oceans absorb ~90% of excess heat and warm far more slowly, they artificially depress the global mean. Meanwhile, the land and atmosphere — the parts humans inhabit — are warming far faster.

    And nowhere is this clearer than at the poles.

    The Arctic: 20× Faster Warming and Localized Surges Above 22°C

    The Arctic is not warming at “four times” the global rate — it is already warming at more than 20 times the global rate in certain intervals, with localized anomalies exceeding 22°C above historical norms.

    This is the engine room of planetary destabilization.

    Why does this matter?

    1. The moisture multiplier

    For every 1°C increase, the atmosphere can hold 7% more moisture.
    At +22°C anomalies, Arctic air can now hold:

    22 × 7% = 154% more moisture

    This surplus water vapor fuels:

    • dramatically faster sea level rise

    • explosive increases in extreme rainfall

    • larger, faster, more destructive raindrops

    • intensifying storms, hurricanes, and atmospheric rivers

    Momentum of falling rain scales with mass × velocity; velocity and wind damage scale with the square of flow speed; water is 800× denser than air. The result is a nonlinear explosion in destructive power.

    2. Accelerated feedback loops

    An Arctic 20× hotter than average accelerates:

    • loss of sea ice

    • albedo collapse

    • permafrost thaw

    • methane release

    • stratospheric moisture injections

    • atmospheric and oceanic circulation disruption

    These amplify global warming on a time-compressed schedule: not centuries, but years to decades

    Oceans: Silent Heat Storage With Catastrophic Potential

    A deep-ocean analysis revealed that even the abyss is warming.
    A mere 0.1°C increase in deep-ocean temperature represents a staggering accumulation of heat. If redistributed to land, that heat would equate to ~35°C of warming — incompatible with human life.

    In 2025, the entire Pacific is 1.6°C above average, a six-sigma anomaly — virtually impossible under natural variability. This is a planetary red alert.

    Two Critical Thresholds

    1.5°C – Tipping point activation

    ≈9°C – Human survivability limit for land and air temperatures

    Both are being breached rapidly in localized regions.

    Cascading Feedbacks: A System Moving Toward Runaway Behavior

    In just ten days of July 2025, the U.S. saw:

    • hundreds of flash floods

    • multiple “1-in-1,000-year” rainfall events

    • widespread infrastructure failures across multiple states

    This isn’t “bad weather.”
    This is an unstable climate system undergoing phase transition.

    Permafrost: From Slow Thaw to Permanent Fire

    Old models assumed gradual thaw over millennia.

    Reality:

    • formerly frozen landscapes now burn year-round

    • methane and CO₂ release is orders of magnitude faster

    • vast carbon stores are now entering the atmosphere on human timescales

    • fires may partially “flare” methane into CO₂ — but the overall emissions surge is catastrophic

    The real uncertainty isn’t if this feedback accelerates warming; it’s how fast and how far it will go.

    Ozone: The Overlooked Feedback Harming Ecosystems and Humans

    Combustion doesn’t only emit CO₂ — it forms tropospheric ozone, a potent plant toxin.

    Ozone exposure:

    • reduces plant growth 10–40%

    • kills sensitive species

    • weakens forests and crops

    • makes ecosystems more vulnerable to drought, heat, pests, and fire

    Global forests — the planet’s lungs — have already shifted from carbon sinks to carbon sources.

    In our Pennsylvania field site, old-growth trees have lost:

    • ~40% of foliage since 2003

    • ~33% of canopy height

    This mirrors global patterns of vegetation decline and reduced carbon uptake.

    And ozone harms humans directly:

    • triggers asthma

    • increases cardiovascular stress

    • causes premature death

    • disproportionately affects children and the elderly

    The ozone-wildfire-warming feedback loop is now one of the strongest multipliers of climate instability.

    A Planet in Nonlinear Transition

    These are not distant projections.
    These are real-time runaway feedbacks already visible across ecosystems, oceans, and the atmosphere.

    The climate system is now governed by compound nonlinear interactions:

    • Arctic amplification

    • ocean heat accumulation

    • ozone stress

    • runaway wildfires

    • permafrost collapse

    • accelerating hydrological extremes

    Each amplifies the others in ways models struggle to capture.

    The central scientific question is no longer:

    “Will feedback loops accelerate warming?”

    It is now:

    “How much time is left before cascading feedbacks overwhelm natural and human systems?”

    Our research is focused on precisely this:
    mapping the speed, scale, and irreversibility of climate feedbacks — and determining how close Earth is to thresholds that will define the trajectory of human civilization.