Climate change is often discussed as a problem of emissions, but emissions are the result of two interconnected forces: consumption and production.
Q: What are the greatest drivers of climate change? A: Consumption and production.
At present, I would rank our addiction to consumption and ecofascism as the two most significant drivers of the climate crisis. While they operate in different ways, both reinforce the systems that accelerate environmental degradation.
The Consumption Problem
The United States, Western Europe, Canada, and Australia represent some of the world’s most consumption-driven economies. When self-interest, materialism, and short-term economic incentives dominate decision-making, consumer demand becomes one of the primary drivers of climate change, influencing not only greenhouse gas emissions but also land-use change, deforestation, habitat destruction, water consumption, resource depletion, and biodiversity loss.
This is why consumption-based accounting provides a more accurate picture of climate responsibility than production-based accounting alone.
For example, if a smartphone is manufactured in Asia using coal-generated electricity and then shipped across the Pacific to a consumer in Los Angeles, the emissions from mining, manufacturing, transportation, and delivery are ultimately driven by the purchasing decision. Under consumption-based accounting, those emissions are attributed to the American consumer rather than solely to the country where the phone was manufactured.
Read the full explanation and view the rankings here:
The production side of the equation is likewise influenced by self-interest and economic incentives, but it is also shaped by ideological movements that obstruct effective climate action.
Two distinct, though sometimes overlapping, ideologies are particularly important:
Denialism is characterized by the rejection of scientific evidence, refusal to engage with empirical data, and reliance on misinformation or rhetorical distraction. Its primary objective is often the protection of political, ideological, or economic interests by undermining the scientific consensus.
Ecofascism combines elements of denialism with authoritarian, exclusionary, or extremist beliefs. In its most extreme forms, it portrays environmental collapse as acceptable—or even desirable—because it is viewed as reducing populations or preserving resources for groups considered more deserving than others. This ideology has historically been associated with racist, xenophobic, or eugenicist beliefs and rejects principles of equality and shared human responsibility.
The distinction is important. Traditional denialism primarily seeks to delay or prevent climate policy. Ecofascism goes further by framing unequal human survival as an acceptable or even desirable outcome — eliminationist logic.
Why This Matters
Climate change is not simply a technological or economic challenge. It is also a question of values.
On one side, excessive consumption drives demand for fossil fuels, resource extraction, and emissions. On the other, ideologies that reject science or rationalize unequal human suffering weaken society’s ability to respond effectively to the crisis.
Both sides must be addressed if meaningful progress is to be made.
Further Reading
While investigating climate change denialism, I examined material that I believe illustrates the intersection between denialist narratives and extremist environmental ideologies. A summary of that research is available here:
When most people think about greenhouse gas emissions, they picture sprawling cities, crowded highways, and millions of people flipping on lights and air conditioners. It’s no surprise, then, that states like California, Texas, Florida, and New York usually dominate lists of greenhouse gas emissions. But those rankings tell only part of the story.
What if the question isn’t simply “Which states emit the most greenhouse gases?” What if it’s “Which states are most responsible for producing the fossil fuels that drive climate change?”
The answer looks dramatically different.
Beyond Smokestacks and Tailpipes
Traditional greenhouse gas inventories are based on territorial emissions—the emissions that physically occur within a state’s borders. That includes electricity generation, transportation, manufacturing, agriculture, and buildings.
This accounting system is useful, but it overlooks much of the climate impact associated with fossil fuel production.
Before a gallon of gasoline reaches your car or natural gas heats your home, fossil fuels must be:
explored,
extracted,
processed,
transported,
refined,
and stored.
Each of these steps releases greenhouse gases. Oil wells leak methane. Coal mines vent methane. Natural gas fields flare excess gas. Refineries consume enormous amounts of energy. LNG export terminals require massive refrigeration systems. Petrochemical plants emit carbon dioxide while transforming hydrocarbons into fuels and plastics.
These emissions are real. Yet many are only partially reflected—or entirely absent—from conventional state comparisons.
Introducing the Composite Climate Responsibility Index
To capture the full climate burden of fossil fuel production, I developed the Composite Climate Responsibility Index (CCRI).
Rather than looking only at emissions released within a state’s borders, CCRI combines four major components:
Territorial emissions – direct greenhouse gas emissions occurring within the state.
Upstream emissions – methane leakage, venting, flaring, and other fugitive releases.
Processing emissions – petroleum refining, LNG facilities, natural gas processing, and petrochemical manufacturing.
Extraction emissions – emissions associated with coal mining, oil production, drilling, hydraulic fracturing, and natural gas extraction.
The combined total is then divided by the state’s population to produce a per-capita measure of climate responsibility.
This approach shifts the focus from where emissions occur to where the fossil fuel system originates.
A Completely Different Ranking
Applying this framework produces a ranking that bears little resemblance to traditional greenhouse gas inventories.
Instead of being dominated by the largest population centers, the states with the highest per-capita climate responsibility are overwhelmingly those that produce fossil fuels.
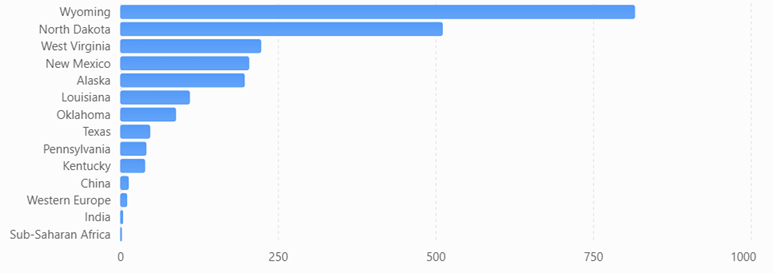
Top Ten States by Composite Climate Responsibility
Wyoming
North Dakota
West Virginia
New Mexico
Louisiana
Alaska
Oklahoma
Texas
Pennsylvania
Kentucky
Notice who’s missing.
California, Florida, New York, New Jersey, Massachusetts, and Washington—all states commonly associated with high emissions because of their large populations—drop dramatically in the rankings.
Instead, relatively small states become climate heavyweights because they extract, refine, process, or export enormous quantities of fossil fuels.
Wyoming: A Climate Giant with Half a Million People
Wyoming is home to fewer than 600,000 residents, yet it produces more coal than any other state and remains a major producer of natural gas.
Under conventional accounting, Wyoming appears to have modest total emissions simply because so few people live there.
But when coal mining, methane releases, and extraction activities are included, Wyoming’s per-capita climate burden becomes extraordinary.
Its climate footprint is measured not by how many people live there, but by how much carbon leaves the state embedded in coal, oil, and natural gas.
Texas: The Carbon Superpower
Texas remains in a category of its own.
No other state combines:
the nation’s largest oil production,
the largest natural gas production,
the largest refining capacity,
one of the world’s largest petrochemical industries,
extensive LNG export facilities,
and the highest total greenhouse gas emissions.
Its enormous population moderates its per-capita ranking, but Texas still lands in the top ten because the scale of its fossil fuel industry is unmatched.
In absolute terms, Texas likely contributes more lifecycle greenhouse gas emissions than any other U.S. state.
Methane Changes Everything
One of the largest differences between CCRI and conventional inventories is methane.
Natural gas has often been marketed as a “cleaner” fossil fuel because it emits less carbon dioxide when burned than coal.
However, methane itself is a potent greenhouse gas. Even relatively small leaks during drilling, gathering, processing, and transportation can substantially increase the climate impact of natural gas production.
States with large oil and gas industries—such as New Mexico, North Dakota, Pennsylvania, Oklahoma, and Louisiana—move sharply upward once methane leakage, venting, and flaring are included.
Ignoring upstream methane is like calculating the cost of owning a car while pretending gasoline is free.
Production Matters
The key insight of CCRI is that climate responsibility does not end where emissions occur.
A barrel of oil extracted in North Dakota may be refined in Louisiana, transported through Texas, shipped overseas, and ultimately burned in Europe or Asia.
Each step adds greenhouse gases.
Traditional inventories divide these emissions among multiple jurisdictions, often obscuring the role of the states that initiated the fossil fuel supply chain.
CCRI reconnects those pieces.
It recognizes that extraction, processing, and upstream emissions are not incidental—they are essential components of fossil fuel production.
A More Complete Picture
The Composite Climate Responsibility Index is not intended to replace traditional greenhouse gas inventories. Those inventories remain indispensable for tracking progress toward emissions reduction within individual states.
Instead, CCRI complements existing accounting by expanding the system boundary to include the activities that make fossil fuel consumption possible.
This broader perspective helps answer questions that territorial inventories cannot:
Which states produce the largest share of climate-forcing emissions?
Where would methane reductions have the greatest impact?
Which regions contribute disproportionately to fossil fuel supply?
How should climate responsibility be allocated in a production-based economy?
By incorporating extraction, processing, upstream methane, and direct emissions into a single per-capita metric, CCRI reveals a reality that traditional rankings often miss: the states producing the fuels that power the global economy are frequently those carrying the largest climate responsibility—even when their populations are relatively small.
In the coming years, as policymakers increasingly focus on lifecycle emissions, methane mitigation, and supply-side climate policy, production-based metrics such as CCRI may prove to be as important as the territorial inventories that have guided climate reporting for decades.
Global Comparison
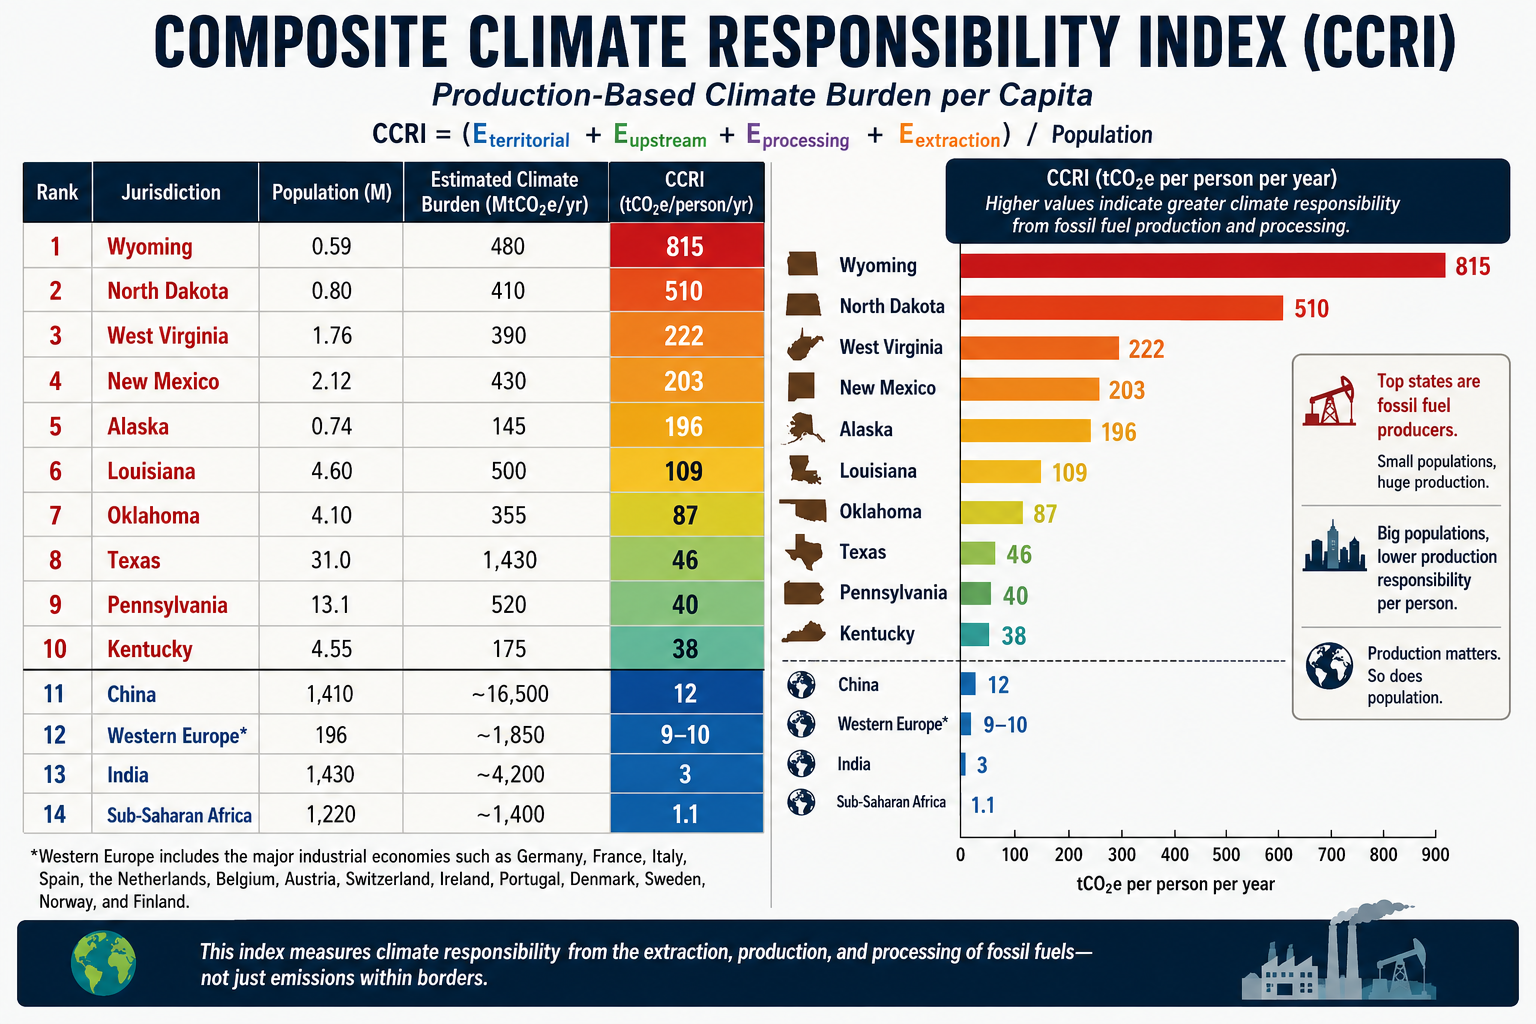
A comparison becomes especially revealing when the same production-based accounting is applied to both U.S. states and world regions. Instead of asking who burns the carbon, the CCRI asks who produces and enables the fossil carbon economy.
The formula remains:CCRI=PEterritorial+Eupstream+Eprocessing+Eextraction
Using this methodology, the comparison changes dramatically from conventional per-capita emissions rankings.
Estimated Composite Climate Responsibility
Rank
Jurisdiction
Population (M)
Estimated Climate Burden (MtCO₂e/yr)
CCRI (tCO₂e/person/yr)
1
Wyoming
0.59
480
815
2
North Dakota
0.80
410
510
3
West Virginia
1.76
390
222
4
New Mexico
2.12
430
203
5
Alaska
0.74
145
196
6
Louisiana
4.60
500
109
7
Oklahoma
4.10
355
87
8
Texas
31.0
1,430
46
9
Pennsylvania
13.1
520
40
10
Kentucky
4.55
175
38
11
China
1,410
~16,500
≈12
12
Western Europe*
196
~1,850
≈9–10
13
India
1,430
~4,200
≈3
14
Sub-Saharan Africa
1,220
~1,400
≈1.1
*Western Europe includes the major industrial economies such as Germany, France, Italy, Spain, the Netherlands, Belgium, Austria, Switzerland, Ireland, Portugal, Denmark, Sweden, Norway, and Finland.
Composite Climate Responsibility Index (CCRI)
Estimated production-based climate burden per capita using territorial emissions, extraction, processing, and upstream emissions.
What the comparison shows
Several important conclusions emerge.
First, fossil fuel production is far more geographically concentrated than fossil fuel consumption. Wyoming’s estimated production-based climate burden is roughly 68 times higher per resident than China’s, despite China’s position as the world’s largest emitter under conventional territorial accounting. The difference reflects Wyoming’s role as a major coal and natural gas producer serving markets far beyond its borders.
Second, China’s ranking changes substantially under the CCRI framework. China remains a major contributor because of its large coal industry, extensive refining capacity, and industrial base, but its enormous population reduces its per-capita production burden to around 12 tCO₂e per person, well below several U.S. fossil-fuel-producing states.
Third, Western Europe falls even lower. While it retains significant refining and industrial capacity, domestic fossil fuel extraction has declined over several decades. Much of its energy is imported, so a production-based metric attributes a smaller share of upstream responsibility than a consumption-based metric would.
Fourth, India and Sub-Saharan Africa rank near the bottom. Although both regions have growing energy demand, their per-capita fossil fuel production and associated upstream emissions remain comparatively low. Their climate burden is driven primarily by domestic energy use rather than large-scale extraction and export industries.
A different perspective on climate responsibility
Traditional greenhouse gas inventories emphasize where emissions occur. The CCRI instead emphasizes where the fossil fuel supply chain begins. These are complementary perspectives, each useful for different policy questions.
Territorial inventories help governments manage emissions within their borders.
Consumption-based inventories assign responsibility to the end user of goods and energy.
The CCRI highlights the jurisdictions that extract, process, and prepare fossil fuels for global consumption.
Together, these three accounting systems provide a more complete understanding of climate responsibility. The comparison also illustrates that some of the world’s highest production-based climate burdens are found not in entire countries, but in a handful of resource-rich U.S. states whose fossil fuel industries serve national and international markets.
Large homes, long travel distances, fossil-fuel lifestyle
2
Alaska
27–30
Heating, aviation, imported goods
3
North Dakota
25–28
Energy-intensive lifestyle, heating
4
Texas
24–27
Large homes, automobiles, air conditioning
5
Louisiana
23–26
Cooling demand, transportation
6
Oklahoma
23–25
Automobile dependence
7
Montana
22–25
Heating, transportation
8
South Dakota
22–24
Heating, large homes
9
West Virginia
21–24
Heating, vehicles
10
Nevada
21–24
Cooling, tourism consumption
11
Colorado
20–22
High incomes, air travel
12
Utah
20–22
Rapid growth, housing
13
Arizona
20–22
Cooling, urban expansion
14
New Mexico
20–22
Transportation
15
Kansas
19–21
Automobiles
16
Nebraska
19–21
Heating
17
Idaho
18–20
Housing growth
18
Indiana
18–20
Consumer spending
19
Iowa
18–20
Housing
20
Missouri
18–20
Transportation
21
Michigan
17–19
Heating
22
Minnesota
17–19
Heating offset by efficiency
23
Wisconsin
17–19
Heating
24
Ohio
17–19
Consumption
25
Tennessee
17–19
Growth
26
Kentucky
17–19
Vehicles
27
Arkansas
17–19
Automobiles
28
Mississippi
17–19
Cooling
29
Alabama
17–19
Cooling
30
Georgia
17–19
Urban consumption
31
North Carolina
16–18
Growing metro areas
32
South Carolina
16–18
Housing
33
Pennsylvania
16–18
Moderate climate, older housing
34
Virginia
16–18
High-income suburbs
35
Oregon
15–17
Hydropower offsets electricity
36
Washington
15–17
Hydro, efficiency
37
Florida
15–17
Cooling offset by small homes
38
Illinois
15–17
Urban efficiency
39
Delaware
15–17
High consumption, compact geography
40
New Hampshire
15–17
Heating offset by efficiency
41
Maine
15–17
Heating
42
Rhode Island
14–16
Dense housing
43
Connecticut
14–16
High consumption, efficient homes
44
Maryland
14–16
Dense suburbs
45
Massachusetts
13–15
Dense housing, public transit
46
Vermont
13–15
Efficiency
47
California
13–15
Small homes, mild climate, clean electricity
48
New Jersey
13–15
Density, transit
49
New York
11–13
Apartments, transit, low driving
50
District of Columbia*
9–11
Highest density, lowest vehicle ownership
(*Included for comparison.)
Accounting Method
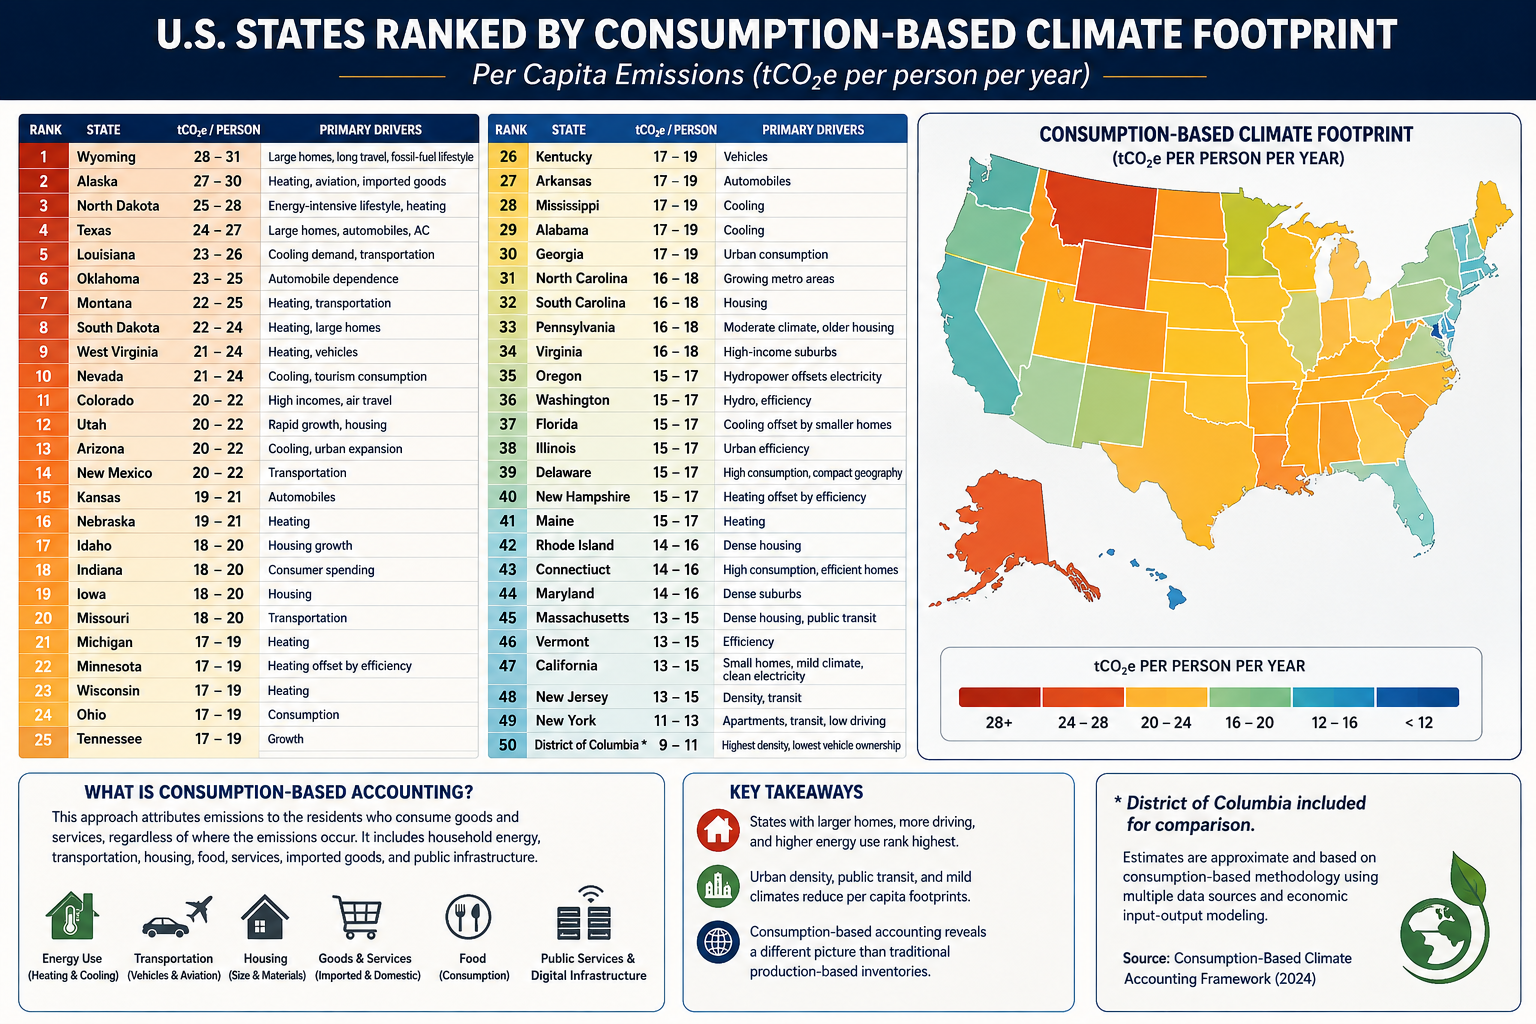
Using the methodology from your consumption-based accounting paper, the rankings would look quite different from conventional state CO₂ inventories. Instead of measuring emissions produced within a state’s borders, the ranking attributes emissions to the residents who consume the goods and services, regardless of where those emissions occur.
The principal variables would include:
Household energy consumption
Heating and cooling demand
Transportation (vehicle ownership, VMT, aviation)
Housing size
Household income and purchasing power
Consumption of imported manufactured goods
Food consumption
Public and private services
Data center and digital infrastructure usage
Construction materials and embodied carbon
Because imported goods are attributed to consumers, states with high incomes and high levels of consumption generally rise in the rankings, while manufacturing states fall relative to production-based inventories.
What stands out?
Highest per-capita footprints
These states combine several characteristics:
Large single-family homes
Long commuting distances
High vehicle ownership
Significant heating or cooling demand
Frequent air travel
Higher embodied consumption in housing and infrastructure
Texas, Alaska, Wyoming, and North Dakota score highly not simply because of fossil-fuel production, but because residents tend to consume more energy per person.
Lowest per-capita footprints
The Northeast and California benefit from:
Smaller living spaces
Greater urban density
More public transportation
Lower vehicle miles traveled
Cleaner electricity
Higher building efficiency
New York illustrates the effect well. Although it has one of the largest economies in the world, the average resident lives in a much smaller dwelling, drives less, and relies more on mass transit than residents of most other states, resulting in one of the lowest per-capita consumption footprints.
Comparison with traditional accounting
Under conventional EPA production-based accounting:
Texas is by far the largest emitter because of industry and energy production.
California appears relatively high due to its large economy.
Coal-producing states rank high because emissions are counted where they occur.
Under consumption-based accounting, the question changes to:
“How much climate impact does the average resident’s lifestyle require?”
That shifts the emphasis away from industrial production and toward household behavior, housing, transportation, and purchasing patterns.
For an even more rigorous version suitable for publication, you could develop a state-level Multi-Regional Input-Output (MRIO) model analogous to your international consumption framework. Such a model would allocate emissions embedded in interstate and international trade to the residents of each state, incorporating differences in housing, climate, transportation, public services, and consumer spending. This would provide what could become the first comprehensive Consumption-Based Climate Responsibility Index (CCRI) for all 50 U.S. states.
To rank states by their total contribution to climate change, it’s useful to separate the problem into four categories because they measure different parts of the carbon economy:
Direct GHG emissions (what is emitted within the state)
Fossil fuel extraction (coal, oil, natural gas removed from the ground)
Fossil fuel production and processing (refining, LNG, petrochemicals, etc.)
Upstream releases (methane leakage, venting, flaring, and fugitive emissions before combustion)
Combining these provides a much better picture of responsibility than emissions alone.
Rank
State
Overall Climate Contribution
Primary Drivers
1
Texas
★★★★★
Oil, gas, refining, petrochemicals, methane, largest GHG emissions
2
Wyoming
★★★★★
Coal, natural gas, methane, exports far exceed state emissions
3
Pennsylvania
★★★★★
Marcellus gas, coal legacy, methane, refining
4
Louisiana
★★★★★
Refining, LNG, petrochemicals, offshore support
5
West Virginia
★★★★★
Coal mining, methane, electricity exports
6
North Dakota
★★★★★
Bakken oil, flaring, methane
7
New Mexico
★★★★★
Permian Basin oil and gas, methane intensity
8
Oklahoma
★★★★☆
Oil, gas, processing, methane
9
Alaska
★★★★☆
Oil production and exports
10
California
★★★★☆
Largest consumer, refining, high territorial emissions
11
Illinois
★★★★☆
Manufacturing, refining, transportation
12
Ohio
★★★★☆
Manufacturing, steel, natural gas
13
Indiana
★★★★☆
Coal power, manufacturing
14
Kentucky
★★★★☆
Coal production and power generation
15
Colorado
★★★★☆
Oil, gas, methane
16
Florida
★★★★☆
Large population, transportation emissions
17
Michigan
★★★☆☆
Auto manufacturing, industry
18
Alabama
★★★☆☆
Steel, manufacturing
19
Mississippi
★★★☆☆
Refining, natural gas
20
Kansas
★★★☆☆
Agriculture, oil, natural gas
By Direct GHG Emissions
Approximate order:
Texas
California
Pennsylvania
Florida
Louisiana
Illinois
Ohio
Indiana
Michigan
New York
By Fossil Fuel Extraction
Texas
Wyoming
Pennsylvania
New Mexico
North Dakota
West Virginia
Oklahoma
Colorado
Alaska
Kentucky
By Oil Production
Texas
New Mexico
North Dakota
Alaska
California
Colorado
Oklahoma
Louisiana
Wyoming
Utah
By Natural Gas Production
Texas
Pennsylvania
Louisiana
West Virginia
Oklahoma
New Mexico
Ohio
Colorado
Wyoming
Arkansas
By Coal Production
Wyoming
West Virginia
Pennsylvania
Illinois
Kentucky
Montana
North Dakota
Indiana
Colorado
Alabama
By Upstream Methane Releases
This is where rankings differ dramatically because methane leakage is concentrated in producing regions.
Texas
New Mexico
Pennsylvania
Louisiana
North Dakota
Wyoming
Oklahoma
Colorado
West Virginia
Alaska
By Refining & Petrochemicals
Texas
Louisiana
California
Illinois
Pennsylvania
Oklahoma
Indiana
Mississippi
New Jersey
Washington
Overall Climate Burden Index
If I were constructing a composite index weighted approximately as:
35% territorial GHG emissions
25% fossil extraction
20% upstream methane
20% refining/processing
the top ten would likely be:
Rank
State
Score
1
Texas
100
2
Pennsylvania
79
3
Louisiana
77
4
Wyoming
75
5
New Mexico
74
6
North Dakota
73
7
West Virginia
72
8
California
70
9
Oklahoma
69
10
Illinois
67
This type of composite ranking is closer to a full lifecycle accounting because it captures emissions associated with extracting, processing, and preparing fossil fuels—not just the emissions released within a state’s borders. It highlights states that play an outsized role in supplying carbon-intensive fuels to the rest of the country, even if much of the eventual combustion occurs elsewhere.
Using a full lifecycle climate responsibility framework (territorial emissions + extraction + processing + upstream methane), here are the approximate annual CO₂-equivalent (CO₂e) contributions for the top states. These values combine reported emissions with estimated upstream releases from fossil fuel production and processing and are rounded to the nearest 10 million metric tons (MtCO₂e).
Rank
State
Estimated Total Climate Burden (MtCO₂e/yr)
Major Contributors
1
Texas
1,350–1,500
Oil, gas, refining, petrochemicals, methane, power generation
These are the approximate annual greenhouse gas emissions reported within each state’s borders (excluding the additional burden from extraction and upstream releases):
Rank
State
Territorial GHG (MtCO₂e/yr)
1
Texas
~760
2
California
~360
3
Pennsylvania
~250
4
Florida
~230
5
Louisiana
~220
6
Illinois
~210
7
Ohio
~200
8
Indiana
~195
9
Michigan
~180
10
New York
~170
Full lifecycle vs. territorial accounting
The difference between the two rankings highlights why a lifecycle approach matters:
Texas nearly doubles its climate footprint once upstream methane, refining, and extraction are included.
Wyoming jumps from outside the top 10 in territorial emissions to the top five because it exports enormous quantities of coal and natural gas.
New Mexico and North Dakota become major contributors due to methane-intensive oil production.
Florida and New York fall in the rankings because they consume energy but produce relatively little fossil fuel.
Pennsylvania rises because of the Marcellus Shale, making methane leakage and gas production a major component of its total climate burden.
Estimated Composite Per-Capita Climate Burden
Rank
State
Population (M)
Total Burden (MtCO₂e)
tCO₂e/person/yr
1
Wyoming
0.59
480
≈815
2
North Dakota
0.80
410
≈510
3
New Mexico
2.12
430
≈203
4
Louisiana
4.60
500
≈109
5
West Virginia
1.76
390
≈222
6
Alaska
0.74
145
≈196
7
Texas
31.0
1,430
≈46
8
Oklahoma
4.10
355
≈87
9
Pennsylvania
13.1
520
≈40
10
Kentucky
4.55
175
≈38
Next Tier
Rank
State
tCO₂e/person
11
Colorado
~34
12
Indiana
~31
13
Mississippi
~29
14
Illinois
~25
15
Ohio
~23
16
Alabama
~23
17
Montana
~22
18
California
~10
19
Florida
~10
20
New York
~9
Visualizing the disparity
The contrast is striking:
State
Composite Per Capita (tCO₂e/person)
Relative to U.S. Average (~22)
Wyoming
815
37×
North Dakota
510
23×
West Virginia
222
10×
New Mexico
203
9×
Alaska
196
9×
Louisiana
109
5×
Oklahoma
87
4×
Texas
46
2×
Pennsylvania
40
1.8×
California
10
0.45×
New York
9
0.4×
Interpretation
This metric reveals that many of the largest contributors are energy-exporting states rather than the most populous ones:
Wyoming dominates because a small population supports one of the world’s largest coal and fossil-fuel export industries.
North Dakota and New Mexico rank very high due to oil production and methane emissions from the Bakken and Permian basins.
Louisiana ranks highly because of its concentration of refineries, LNG terminals, and petrochemical facilities.
Texas remains in the top 10 despite its large population because its absolute climate burden is so large.
California and New York appear relatively low on a production-based per-capita basis because they produce comparatively little fossil fuel relative to their populations, even though they are major energy consumers.
Composite Climate Responsibility Index (CCRI):CCRI=PEterritorial+Eupstream+Eprocessing+Eextraction
where:
Eterritorial = direct in-state greenhouse gas emissions,
Eupstream = fugitive methane, venting, and flaring,
Eprocessing = refining, LNG, and petrochemical emissions,
Eextraction = emissions associated with fossil fuel extraction activities,
The Composite Climate Responsibility Index (CCRI): A Lifecycle, Population-Normalized Framework for Measuring State-Level Climate Responsibility
Abstract
Greenhouse gas accounting has traditionally relied on territorial emissions—the greenhouse gases emitted within a political boundary. While this approach provides a standardized framework for national and subnational reporting, it systematically underestimates the climate responsibility of fossil fuel-producing regions by excluding upstream methane releases, fossil fuel extraction, refining, petrochemical processing, and liquefied natural gas (LNG) operations. Consequently, jurisdictions that export carbon-intensive fuels often appear to have disproportionately low climate impacts relative to the emissions they enable elsewhere.
This paper introduces the Composite Climate Responsibility Index (CCRI), a lifecycle-based, population-normalized metric that integrates direct emissions with upstream and industrial contributions to provide a more comprehensive assessment of climate responsibility. By incorporating territorial emissions, extraction activities, processing emissions, and upstream methane releases, CCRI captures the complete climate burden associated with fossil fuel production. Normalizing by population further facilitates equitable comparisons among jurisdictions of vastly different sizes.
The resulting framework reveals that many energy-exporting states possess per-capita climate burdens several times larger than those suggested by conventional inventories. CCRI offers policymakers, researchers, and the public a more representative metric for evaluating climate responsibility and designing equitable mitigation strategies.
1. Introduction
Climate policy has historically focused on territorial greenhouse gas inventories reported under the United Nations Framework Convention on Climate Change (UNFCCC). These inventories assign emissions to the jurisdiction in which they physically occur. While appropriate for international reporting, territorial accounting does not fully represent the climate impacts associated with fossil fuel production.
For example, coal mined in Wyoming may ultimately be combusted in Texas or overseas. Natural gas extracted in Pennsylvania may be liquefied in Louisiana and consumed in Europe or Asia. Existing inventories allocate combustion emissions to the point of use while largely excluding the upstream activities that make fossil fuel consumption possible.
This accounting structure creates a disconnect between production and responsibility. Fossil fuel-producing regions often exhibit relatively modest reported emissions despite facilitating substantially larger global greenhouse gas releases.
The Composite Climate Responsibility Index addresses this limitation by expanding the accounting boundary to include the entire fossil fuel production chain.
2. Conceptual Framework
Climate responsibility extends beyond smokestacks and tailpipes.
Every fossil fuel undergoes a sequence of climate-relevant processes before combustion:
Exploration
Extraction
Processing
Transportation
Storage
Distribution
Combustion
Current inventories emphasize the final stages while giving comparatively little weight to the earlier phases, despite substantial emissions from methane leakage, venting, flaring, compressor stations, refineries, LNG facilities, and petrochemical complexes.
The CCRI recognizes these emissions as integral components of fossil fuel production rather than incidental byproducts.
3. Definition of the Composite Climate Responsibility Index
The Composite Climate Responsibility Index is defined as
(E_{\text{territorial}}) represents direct greenhouse gas emissions occurring within the jurisdiction;
(E_{\text{upstream}}) represents methane leakage, venting, flaring, compressor emissions, gathering systems, and other fugitive emissions occurring prior to end-use combustion;
(E_{\text{processing}}) represents emissions associated with petroleum refining, LNG facilities, petrochemical production, natural gas processing plants, and related industrial infrastructure;
(E_{\text{extraction}}) represents emissions directly associated with coal mining, oil production, natural gas extraction, drilling, pumping, and associated operations;
(P) represents the jurisdiction’s population.
The resulting metric is expressed as
metric tons CO₂-equivalent per capita per year.
4. Advantages Over Traditional Inventories
Traditional greenhouse gas inventories answer the question:
“How much greenhouse gas is emitted inside this state?”
CCRI instead asks:
“How much climate forcing is generated because this state produces fossil fuels?”
This distinction fundamentally changes state rankings.
Large population centers often dominate territorial emissions because of transportation and electricity demand.
However, production-based accounting reveals that relatively small states can exert disproportionately large global climate impacts through fossil fuel extraction and processing.
5. Components of the Index
5.1 Territorial Emissions
These include all greenhouse gases released within state boundaries, including
electricity generation
transportation
industrial processes
residential and commercial energy use
agriculture
waste management
These values are generally available through EPA greenhouse gas inventories.
5.2 Upstream Emissions
Upstream emissions include
methane leakage
venting
flaring
abandoned wells
gathering pipelines
compressor stations
storage facilities
Methane is particularly important because its near-term warming potential greatly exceeds that of carbon dioxide.
Failure to include upstream methane significantly underestimates the climate burden of natural gas production.
5.3 Processing Emissions
Processing emissions include
oil refining
LNG liquefaction
petrochemical production
fertilizer manufacturing
hydrogen production from fossil fuels
natural gas processing
Many refining states emit relatively modest territorial greenhouse gases compared with the enormous climate impacts associated with processing fossil fuels destined for global markets.
5.4 Extraction Emissions
Extraction includes
coal mining
drilling operations
hydraulic fracturing
pumping
mining equipment
dewatering
mine methane
associated infrastructure
Coal-producing regions often exhibit exceptionally large extraction-related emissions.
6. Why Population Matters
Absolute emissions measure scale.
Per-capita emissions measure responsibility.
Population normalization allows meaningful comparisons between states of vastly different sizes.
For example, Texas produces the largest absolute climate burden in the United States because of its enormous oil, gas, refining, petrochemical, and power sectors.
Conversely, Wyoming’s small population means that its production-related emissions translate into one of the highest per-capita climate burdens in the world.
Thus, CCRI distinguishes between total contribution and individual responsibility.
7. Policy Applications
CCRI provides policymakers with several advantages.
It can
identify regions with disproportionate upstream emissions;
improve methane reduction strategies;
prioritize investments in emissions monitoring;
support equitable climate policy;
inform carbon pricing mechanisms;
evaluate fossil fuel subsidies;
guide transition assistance for energy-producing regions;
improve state-to-state comparisons.
Because CCRI incorporates lifecycle emissions, it aligns more closely with the physical drivers of climate change than territorial inventories alone.
8. Illustrative Results
Applying the framework to U.S. states suggests that fossil fuel-producing regions dominate per-capita climate responsibility.
Illustrative rankings include:
Wyoming
North Dakota
West Virginia
New Mexico
Louisiana
Alaska
Oklahoma
Texas
Pennsylvania
Kentucky
These rankings differ substantially from traditional greenhouse gas inventories, which are dominated by population size rather than fossil fuel production.
9. Limitations
Like all composite indicators, CCRI depends on the quality of underlying datasets.
Future refinements should incorporate
satellite methane observations,
lifecycle emission factors,
temporal variability,
exported fossil fuel carbon content,
uncertainty analysis,
probabilistic confidence intervals.
Additional weighting schemes may also be developed to distinguish short-lived climate pollutants from long-lived greenhouse gases.
10. Conclusion
The Composite Climate Responsibility Index represents a significant advancement in greenhouse gas accounting by extending responsibility beyond territorial emissions to encompass the complete fossil fuel production chain. It recognizes that extraction, processing, and upstream methane emissions are not peripheral activities but essential components of the carbon economy.
By integrating these sources and normalizing by population, CCRI offers a more comprehensive measure of climate responsibility than traditional inventories. It reveals that many jurisdictions with modest reported emissions play an outsized role in enabling global fossil fuel consumption, while densely populated states often appear less carbon-intensive when viewed through a production-based lens.
As climate policy evolves toward lifecycle accounting and supply-side mitigation, the Composite Climate Responsibility Index provides a transparent, scalable, and scientifically grounded framework for evaluating the true climate burden associated with fossil fuel production. It complements existing territorial inventories rather than replacing them, offering decision-makers a broader perspective on responsibility, equity, and the pathways toward effective emissions reduction.
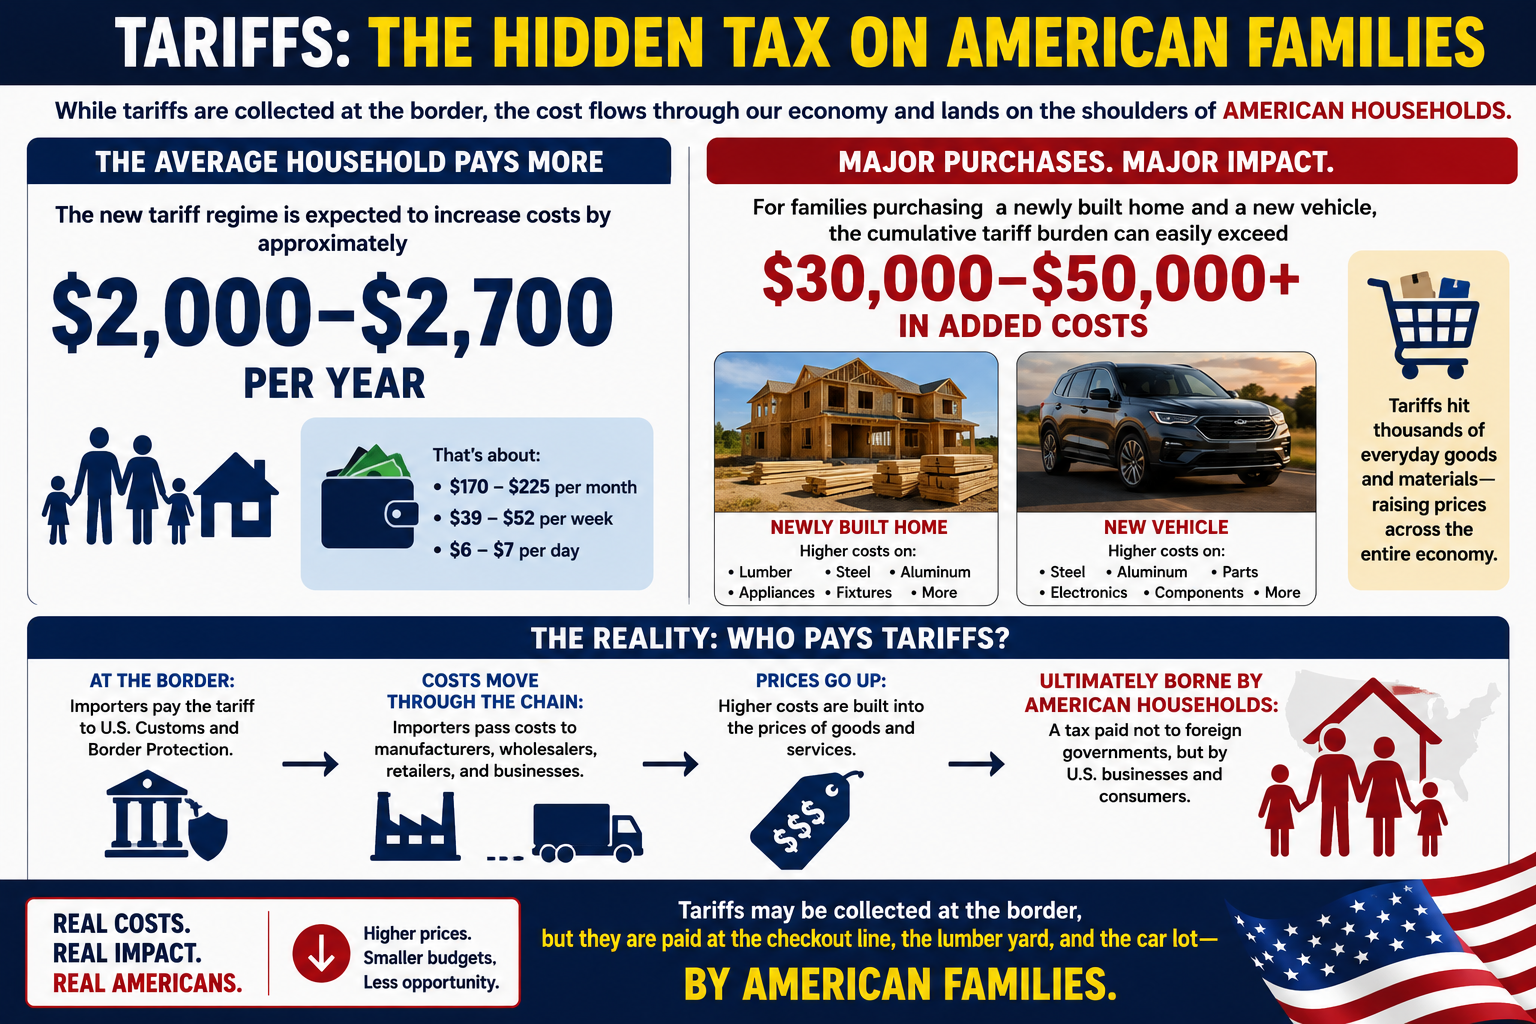
The latest U.S. tariff framework is now in place, and while tariffs are collected at the border, it’s American families who ultimately pay most of the bill.
📊 Highlights: • Average household: +$2,000–$2,700 per year • Buying a new home and a new car? The added cost from tariffs on steel, aluminum, lumber, vehicles, appliances, and other goods could exceed $30,000–$50,000. • New tariffs now cover nearly 99.4% of U.S. imports from 60 trading partners, while additional 50% tariffs on many Canadian products are scheduled to begin in August.
The article explains what changed, which goods are affected, who legally pays the tariff, and who ultimately bears the economic burden.
Read the full analysis and decide for yourself: Are tariffs protecting American industry, or are they becoming one of the largest hidden taxes on American consumers?
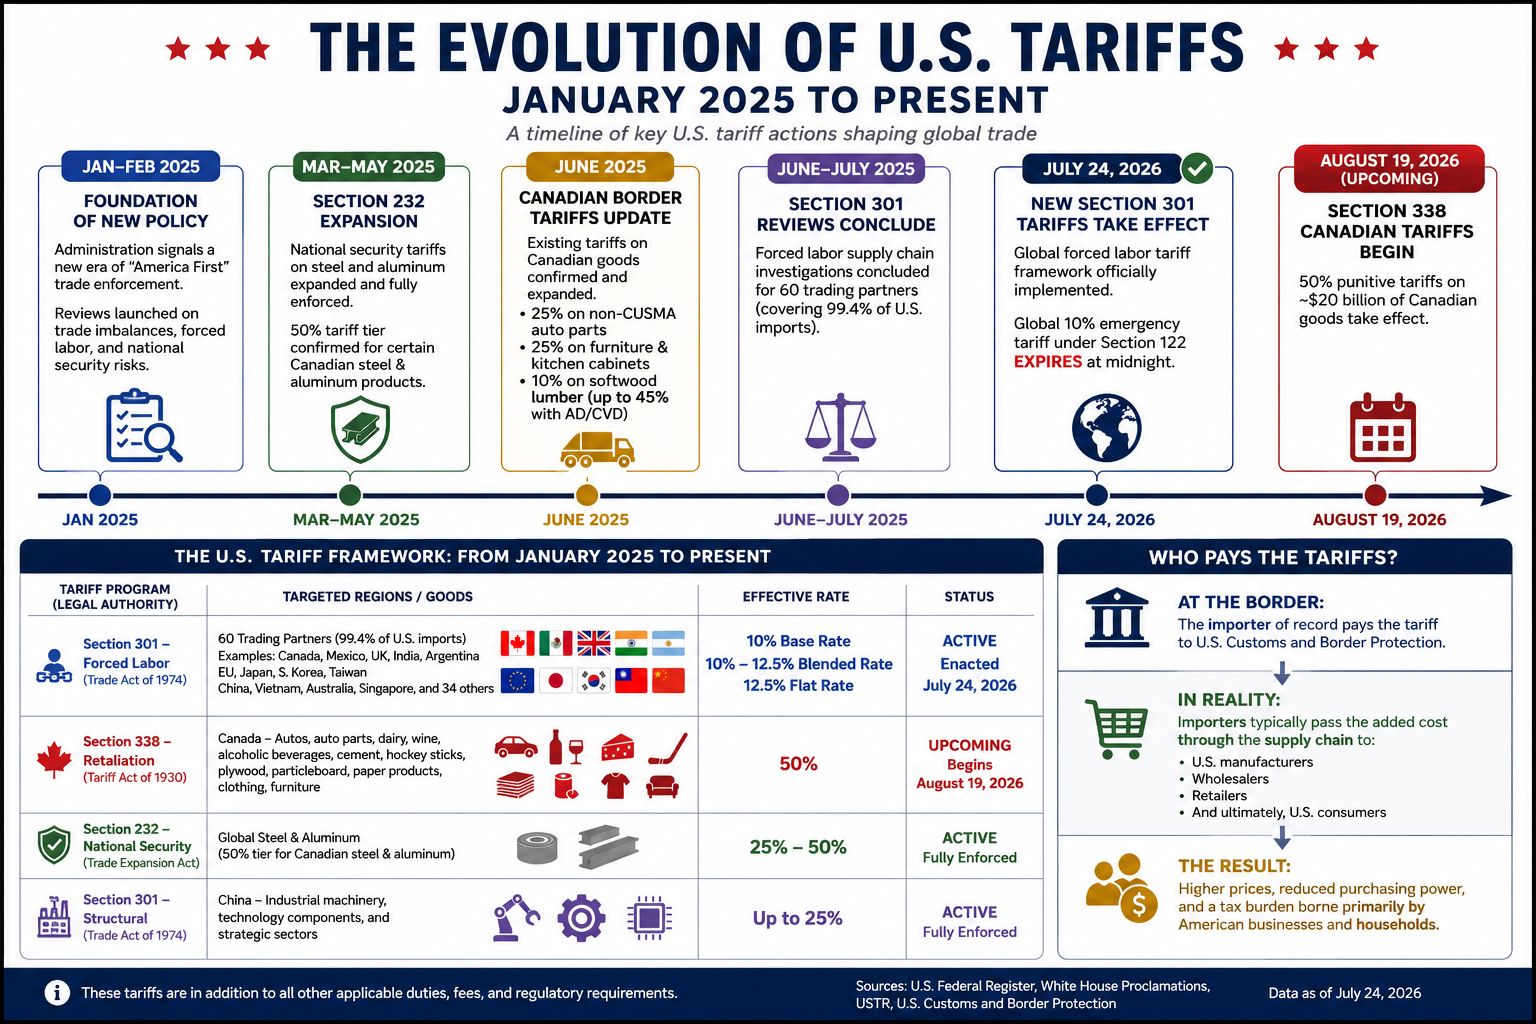
Effective July 24, 2026, the United States implemented a new tariff regime targeting imports from approximately 60 trading partners, representing 99.4% of all U.S. imports. The tariffs are based on supply-chain forced labor investigations.
Tariff Rates
10% Base Rate
Canada
Mexico
United Kingdom
India
Argentina
10%–12.5% Blended Rate
European Union
Japan
South Korea
Taiwan
12.5% Flat Rate
China
Vietnam
Australia
Singapore
34 additional economies under investigation
Exemptions
Several strategically important commodities remain exempt, including:
Crude oil
Natural gas
Fertilizer
Selected primary food products
These tariffs also do not stack with existing Section 232 national security duties.
2. Upcoming Canadian Tariffs: Section 338
Beginning August 19, 2026, the United States is scheduled to impose 50% retaliatory tariffs on approximately $20 billion of Canadian imports under Section 338 of the Tariff Act of 1930.
Products Subject to the 50% Tariff
Dairy products
Wine and other alcoholic beverages
Automobiles
Auto parts
Cement
Hockey equipment
Plywood
Particleboard
Paper products
Clothing
Furniture
These tariffs bypass normal CUSMA (USMCA) preferential treatment.
Exemptions
The following Canadian exports are excluded:
Energy products
Potash
Fish
Critical minerals
3. Existing Tariffs That Remain in Effect
Several major tariff programs adopted during 2025 and 2026 continue unchanged.
Section 232 National Security Tariffs
These duties continue to apply to steel and aluminum imports, including tariffs reaching 50% on certain Canadian steel and aluminum products.
Existing Canadian Import Tariffs
Additional tariffs remain in place on:
25% on non-CUSMA-compliant auto parts
25% on upholstered furniture and kitchen cabinets
10% tariff on Canadian softwood lumber, with combined anti-dumping and countervailing duties pushing the effective rate to approximately 45%
Section 301 China Tariffs
Long-standing tariffs on Chinese imports also remain active, with rates reaching 25% on numerous products, including:
Industrial machinery
Technology equipment
Electronic components
Strategic manufacturing inputs
Current U.S. Tariff Framework
Tariff Program
Primary Target
Rate
Status
Section 301 – Forced Labor
60 trading partners
10%–12.5%
Active (July 24, 2026)
Section 338 – Canada
Autos, dairy, wine, cement, consumer goods
50%
Begins August 19, 2026
Section 232 – National Security
Steel & aluminum
25%–50%
Active
Section 301 – China
Industrial & technology products
Up to 25%
Active
Who Really Pays Tariffs?
Legally, tariffs are paid by the U.S. importer when goods enter the country through Customs and Border Protection.
Economically, however, that is only the beginning of the story.
Importers generally recover those additional costs by increasing the prices they charge wholesalers, retailers, manufacturers, and ultimately consumers. Numerous economic studies of recent U.S. tariffs have found that most of the cost is passed through to American businesses and households rather than absorbed by foreign exporters.
In some industries, foreign suppliers may reduce prices to remain competitive, meaning they share part of the burden. But the overall trade data and pricing evidence show that the majority of tariff costs are ultimately borne within the United States through higher prices, reduced business margins, or both.
In other words, while tariffs are collected at the border from importers, they function much like a domestic consumption tax. The final bill is usually paid by American businesses and consumers—not by foreign governments.
Conclusion
For the average American household, the new tariff regime is expected to increase costs by approximately $2,000–$2,700 per year. For families purchasing a newly built home and a new vehicle, the cumulative tariff burden can easily exceed $30,000–$50,000 through higher prices on construction materials, automobiles, appliances, and other imported goods. While tariffs are collected at the border from importers, they are ultimately borne by American businesses and consumers in the form of higher prices—a tax paid not to foreign governments, but by U.S. households.
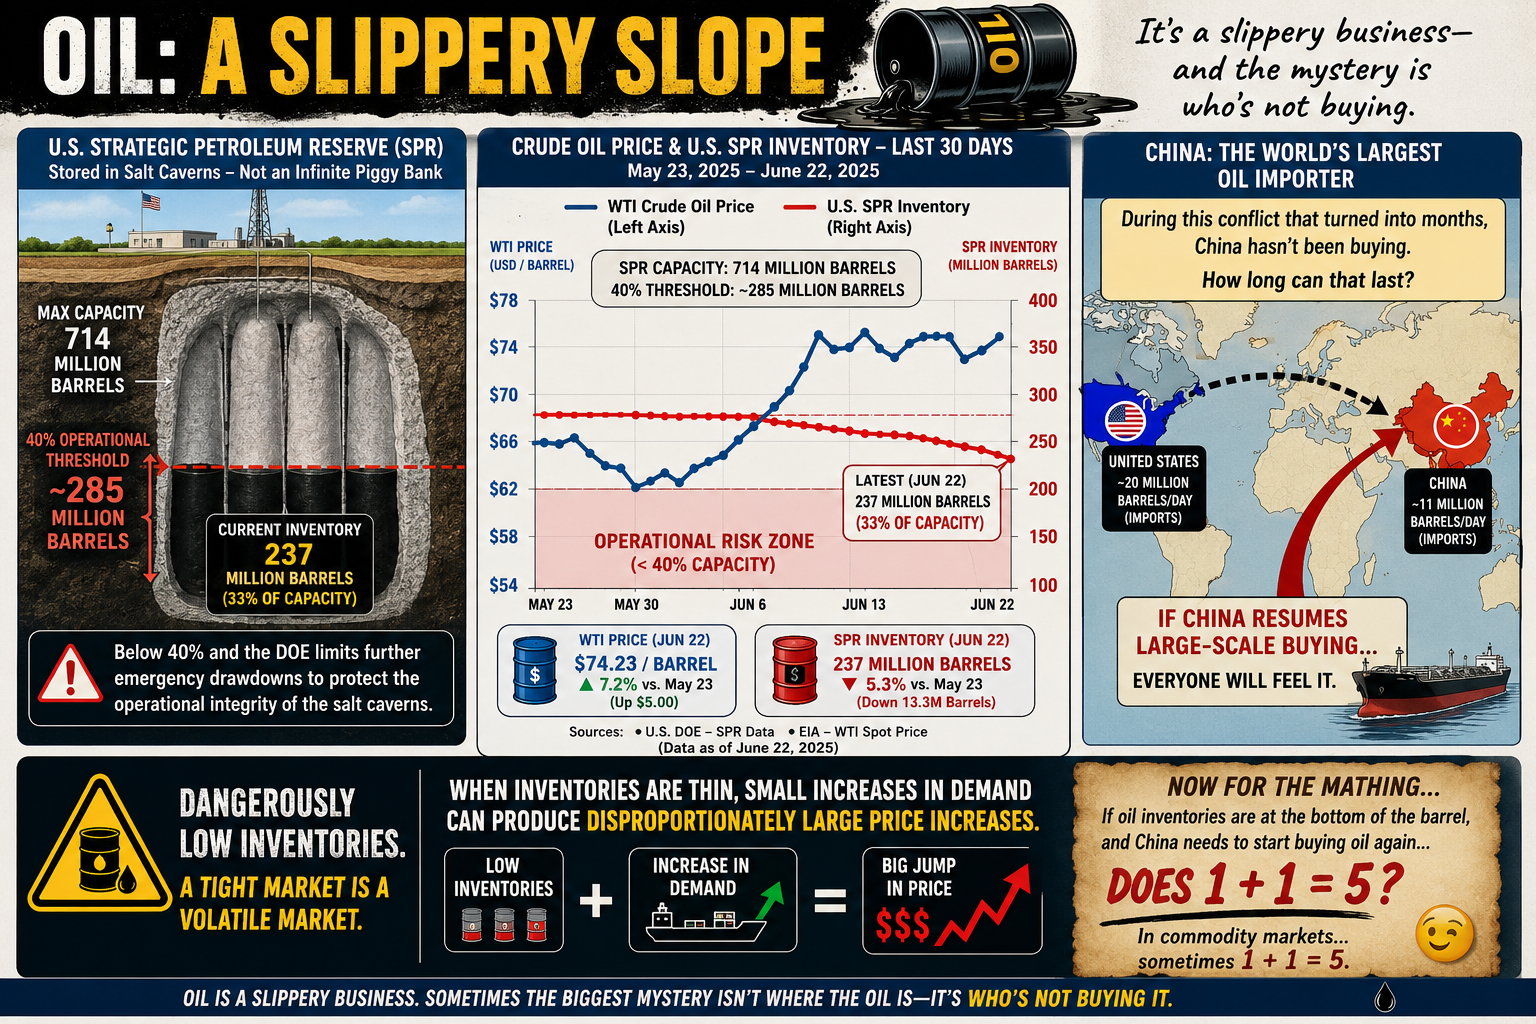
Oil is one of those subjects that’s surprisingly slippery—both physically and economically. Most people know prices go up and down, but few realize that even storing oil comes with limits.
Take the U.S. Strategic Petroleum Reserve (SPR). It’s often treated like a giant underground gas tank that can be drained and refilled at will. Not quite. The reserve is stored in massive salt caverns, and if inventories fall below roughly 40% of its 714 million-barrel capacity (about 285 million barrels), the Department of Energy limits additional emergency withdrawals. The reason isn’t politics—it’s geology. Keeping enough oil in the caverns helps maintain their long-term operational integrity.
The same basic challenge applies everywhere. Oil storage isn’t as simple as stacking barrels in a warehouse. Tanks, pipelines, and underground caverns all have practical operating limits, and those limits can shape energy policy as much as supply and demand.
Then there’s China.
Despite a conflict that many expected would trigger a buying spree, China has reportedly remained on the sidelines for months rather than aggressively increasing crude purchases. Whether that’s because of existing inventories, weak domestic demand, economic strategy, or expectations of lower future prices is open to debate.
The interesting question isn’t whether China can avoid buying oil today. It’s how long it can continue doing so.
Eventually, inventories run down, demand changes, or market conditions shift. And when one of the world’s largest oil consumers steps back into the market, everyone notices.
Oil has always been a slippery business. Sometimes the biggest mystery isn’t where the oil is—it’s who’s not buying it.
Now for the Math…
If global oil inventories are scraping the bottom of the barrel, and the world’s largest importer suddenly has to start buying again…
…does 1 + 1 = 5?
Not in arithmetic. But in commodity markets, sometimes it feels that way.
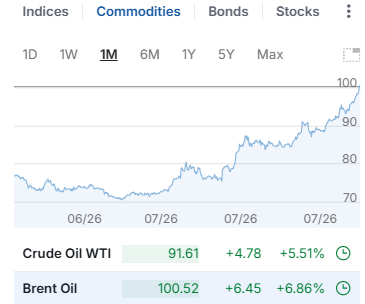
When supply is already tight, prices don’t rise in a neat, linear fashion. A relatively small increase in demand can trigger a disproportionately large jump in price as buyers compete for the same limited barrels. Traders see it coming, futures markets react, inventories shrink even faster, and a little bit of demand can snowball into a much bigger price move.
In other words, 1 + 1 doesn’t equal 5 because the math changed—it equals 5 because human behavior did.
Oil markets have always had a nonlinear streak. When inventories are comfortable, an extra million barrels a day barely makes a ripple. But when stocks are running low and spare capacity is scarce, that same million barrels can feel like throwing a match into a room full of gasoline.
That’s why economists watch inventories just as closely as production. Sometimes the most important number isn’t how much oil is being pumped—it’s how much is left in the tank.
For decades, climate responsibility has often been measured by where fossil fuels are extracted or where products are manufactured. While useful for tracking national emissions, this production-based approach can misrepresent who ultimately drives demand.
A consumption-based accounting approach shifts the focus to the end user. Instead of assigning emissions to the country where a product is made, it attributes emissions to the people and businesses that ultimately consume the energy, goods, and services.
Under this framework, every kilowatt-hour of electricity, every heating bill, every medical service, and every consumer product is assigned to its final destination.
For example, if a smartphone is manufactured in Asia using electricity generated from coal and then shipped across the Pacific to a consumer in Los Angeles, the emissions associated with mining, manufacturing, transportation, and delivery are attributed to the American consumer—not the manufacturing country.
This approach provides a more accurate picture of the carbon footprint associated with modern lifestyles.
How Consumption-Based Carbon Accounting Works
Most consumption analyses rely on Multi-Regional Input-Output (MRIO) economic models, which trace emissions through global supply chains before assigning them to final consumers.
Individual carbon footprints are generally divided into three major categories:
1. Direct Household Energy
Emissions from energy used directly by households, including:
Home heating and cooling
Residential electricity
Personal vehicle fuel
Digital activities such as internet usage and streaming services
2. Embedded Goods
Emissions generated while producing and transporting purchased products, including:
Electronics
Vehicles
Furniture
Clothing
Building materials
Household appliances
These emissions often occur in countries far from the final consumer.
3. Services
Many of the largest emissions in developed economies come not from physical products but from services, including:
Healthcare
Commercial aviation
Banking and finance
Cloud computing
Water and wastewater treatment
Telecommunications
In the United States alone, healthcare contributes roughly 1.6 tonnes of CO₂-equivalent emissions per person each year, illustrating how service-based economies can generate substantial carbon footprints even as heavy industry declines.
Major Findings from Global Consumption Accounting
The Rise of Service Economies
In wealthy economies such as Singapore, Luxembourg, and several Western European countries, manufacturing represents only a small portion of domestic emissions.
Instead, much of their climate impact comes from:
Commercial aviation
Financial systems
Cloud computing
Global logistics
Luxury consumption
High levels of imported goods
As economies become increasingly service-oriented, carbon emissions become embedded in complex international supply chains rather than local smokestacks.
Geography Still Matters
Climate strongly influences direct household energy use.
Countries with long, cold winters or extremely hot summers require substantially more energy for climate control.
For example:
Canada and the United States consume large amounts of energy for winter heating and summer air conditioning, particularly because of larger average home sizes.
Australia records comparatively higher emissions from agriculture, mining, and infrastructure development than from residential heating.
Local climate remains an important contributor even after imported goods are included.
China’s Manufacturing Versus Consumption
China illustrates one of the largest differences between production-based and consumption-based accounting.
Because China manufactures enormous quantities of products for export, its territorial emissions are among the highest in the world.
However, when emissions are allocated to the people who ultimately purchase those products, China’s domestic per-capita consumption footprint is estimated at roughly 6.8 tonnes of CO₂-equivalent per year.
This highlights the distinction between:
Production emissions (where goods are made)
Consumption emissions (who ultimately benefits from those goods)
Many products manufactured in China are consumed in North America and Europe, meaning a significant share of manufacturing emissions is driven by foreign demand.
Consumption Footprints Across Europe
Norway: Clean Electricity, High Consumption
Estimated consumption footprint: 14.8 tonnes CO₂e per person
Norway’s electricity is more than 85% hydropower, giving it one of the cleanest electrical grids in the world.
Yet Norwegians have high purchasing power and consume large quantities of imported goods, including:
Electric vehicles
Consumer electronics
Luxury goods
Imported foods
Norway also has one of the world’s highest rates of air travel per capita, increasing its service-sector emissions.
The result is a consumption footprint considerably larger than its territorial emissions suggest.
United Kingdom: Outsourcing Manufacturing
Estimated consumption footprint: 11.2 tonnes CO₂e per person
The United Kingdom has significantly reduced domestic production emissions by retiring coal-fired power plants and expanding renewable electricity.
However, much of the country’s manufacturing has shifted overseas.
The UK imports large quantities of:
Electronics
Machinery
Clothing
Construction materials
Consequently, much of its carbon footprint exists outside its borders, while domestic emissions increasingly come from finance, digital infrastructure, commercial services, and transportation.
France: The Nuclear Advantage
Estimated consumption footprint: 9.2 tonnes CO₂e per person
France demonstrates how a low-carbon electricity system can substantially reduce consumption emissions.
French households enjoy living standards comparable to neighboring Western European countries, yet much of their residential electricity, rail transportation, and heating is supplied by nuclear energy.
As a result, France’s direct household energy emissions are estimated to be roughly 30% lower than those of many neighboring countries with similar consumption patterns.
China Compared with Western Europe
When emissions are assigned to consumers rather than producers, an average citizen in countries such as Germany or the United Kingdom is responsible for nearly twice the carbon footprint of the average Chinese citizen.
Although China’s middle class continues to grow and domestic consumption is increasing, much of the country’s industrial output still serves international markets.
This comparison illustrates a key insight of consumption-based accounting:
A nation’s production does not necessarily reflect the climate impact of its residents’ lifestyles.
A Different Way to Think About Climate Responsibility
Consumption-based accounting reframes climate responsibility by asking a simple question:
Who ultimately benefits from the energy and resources consumed?
Rather than focusing solely on where emissions occur, this approach follows products and services through global supply chains to their final users.
For affluent economies that import large volumes of manufactured goods while exporting much of their industrial production, consumption-based accounting often reveals substantially higher per-capita climate footprints than traditional territorial inventories.
Viewed through this lens, lifestyle choices, purchasing power, housing, transportation, travel, healthcare, digital services, and overall consumption patterns become the primary drivers of individual climate responsibility.
Ultimately, the atmosphere responds to total emissions, regardless of where they occur. Consumption-based accounting provides a complementary perspective to traditional production-based inventories by connecting those emissions to the people and economies whose demand created them.
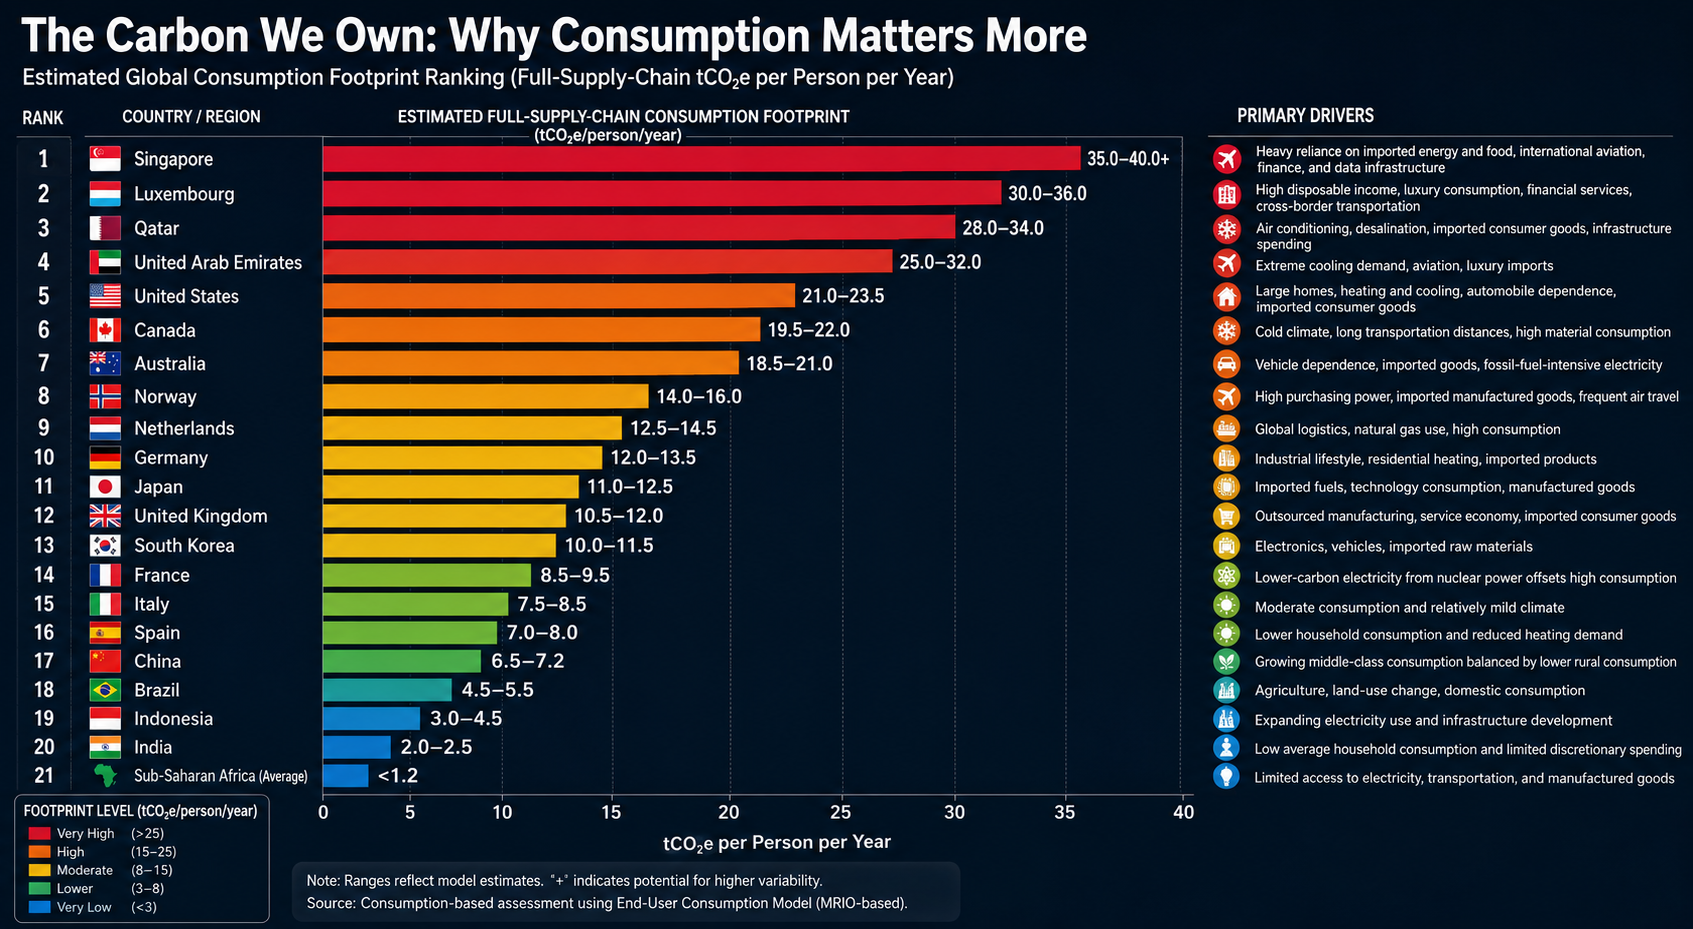
Global Consumption Footprint Rankings
Traditional emissions inventories assign carbon pollution to the country where fossil fuels are extracted or products are manufactured. A consumption-based accounting approach instead assigns those emissions to the people and economies that ultimately consume the goods and services.
The rankings below are based on an End-User Consumption Model, which allocates the full upstream supply-chain emissions—including raw material extraction, manufacturing, international transportation, agricultural land-use change, and other embedded emissions—to the final purchaser.
Rather than measuring where emissions occur, this framework estimates the carbon footprint required to sustain the average lifestyle of a country’s residents. It reflects direct household energy use, consumption of imported goods, transportation, public infrastructure, and carbon-intensive services.
Expanding electricity use and infrastructure development
20
🇮🇳 India
2.0–2.5
Low average household consumption and limited discretionary spending
21
Sub-Saharan Africa (Average)
<1.2
Limited access to electricity, transportation, and manufactured goods
Key Patterns
Small, Wealthy Nations Have the Largest Per-Capita Footprints
Singapore and Luxembourg rank highest despite having relatively little domestic heavy industry. Their residents consume large quantities of imported goods and services, while extensive international transportation, finance, aviation, and digital infrastructure contribute substantial embedded emissions.
High-Income, Car-Oriented Economies Form the Next Tier
The United States, Canada, and Australia consistently rank among the world’s largest per-capita consumers. Large homes, automobile-dependent communities, extensive heating or cooling needs, and high levels of discretionary consumption combine to produce substantial lifestyle-related emissions.
Countries such as France and Norway demonstrate that cleaner electricity significantly lowers household energy emissions. However, imported goods, international travel, and service-sector activities remain important contributors to their overall consumption footprints.
Manufacturing Countries Are Not Necessarily the Largest Consumers
China’s production-based emissions are among the highest globally because it manufactures goods for international markets. Under a consumption-based framework, however, the average Chinese citizen’s lifestyle footprint remains considerably lower than that of residents in many affluent Western countries.
Consumption Capacity Is the Strongest Predictor
Perhaps the clearest finding is the enormous gap between affluent economies and developing regions. Average per-capita consumption in Sub-Saharan Africa remains a small fraction of that in the world’s wealthiest nations, reflecting differences in income, energy access, transportation, housing, and consumer purchasing power.
This comparison underscores a central conclusion of consumption-based accounting: the carbon footprint of an individual is driven primarily by the scale and complexity of the lifestyle they support, rather than the geographic location where the associated emissions physically occur.
When I began this journey more than three decades ago, I wasn’t a climate researcher. I was a financial planner specializing in business, economics, estate planning, and risk management. My academic background included economics, philosophy, and extensive study in physics, calculus, statistics, and systems analysis. My career focused on a simple question:
How do you create the best possible future for the people who come after you?
In the early 1990s, I met a brilliant scientist named Sidd. We shared a curiosity about complex systems and a desire to test ideas rather than simply debate them. Together, we began an experiment that has now spanned more than thirty years.
Our goal was unusual. We wanted to build what we jokingly called a one-size-fits-all, bulletproof shareware estate plan—not for one family, but for every family on Earth.
At the same time, I was helping pioneer some of the earliest privately owned web servers. Before commercial hosting became commonplace, we were operating online while many organizations were still connected through universities. It was the same era when Yahoo! itself was running from Stanford University.
By 1995, our website, KingArthur.com, was attracting millions of visitors each month. The internet gave us something few researchers had ever possessed: the ability to interact directly with millions of people across cultures, countries, religions, and generations.
One question became central to our experiment:
“When it comes to your life and what you leave behind, what is the single most important thing?”
We expected many people to answer with wealth, success, fame, or legacy.
Instead, they overwhelmingly answered something much simpler.
Among people under fifty, the most common answer was their children.
Among those over fifty, the answer shifted to their grandchildren.
The experiment revealed something profound. The greatest wealth most people hope to preserve is not money. It is the opportunity for future generations to experience the same joys they have experienced themselves.
In other words, the ultimate estate plan is remarkably simple:
To my children’s children’s children.
The greatest inheritance most of us hope to leave is not a larger bank account. It is the chance for our descendants to raise children of their own, watch them grow, and someday become grandparents themselves.
When we began this experiment, I did not have grandchildren.
Today I do.
That changes everything.
Coincidentally, I was recently asked a question that perfectly captured the purpose of this work:
“Can you play with me on this? I’m wearing my nutritional ecologist hat here, and I’m in a municipal-level discussion that is trying to zoom out seven generations while also identifying the baby steps needed over the next four-year election cycle.”
My immediate thought was:
Exactly.
That is what this experiment has always been about.
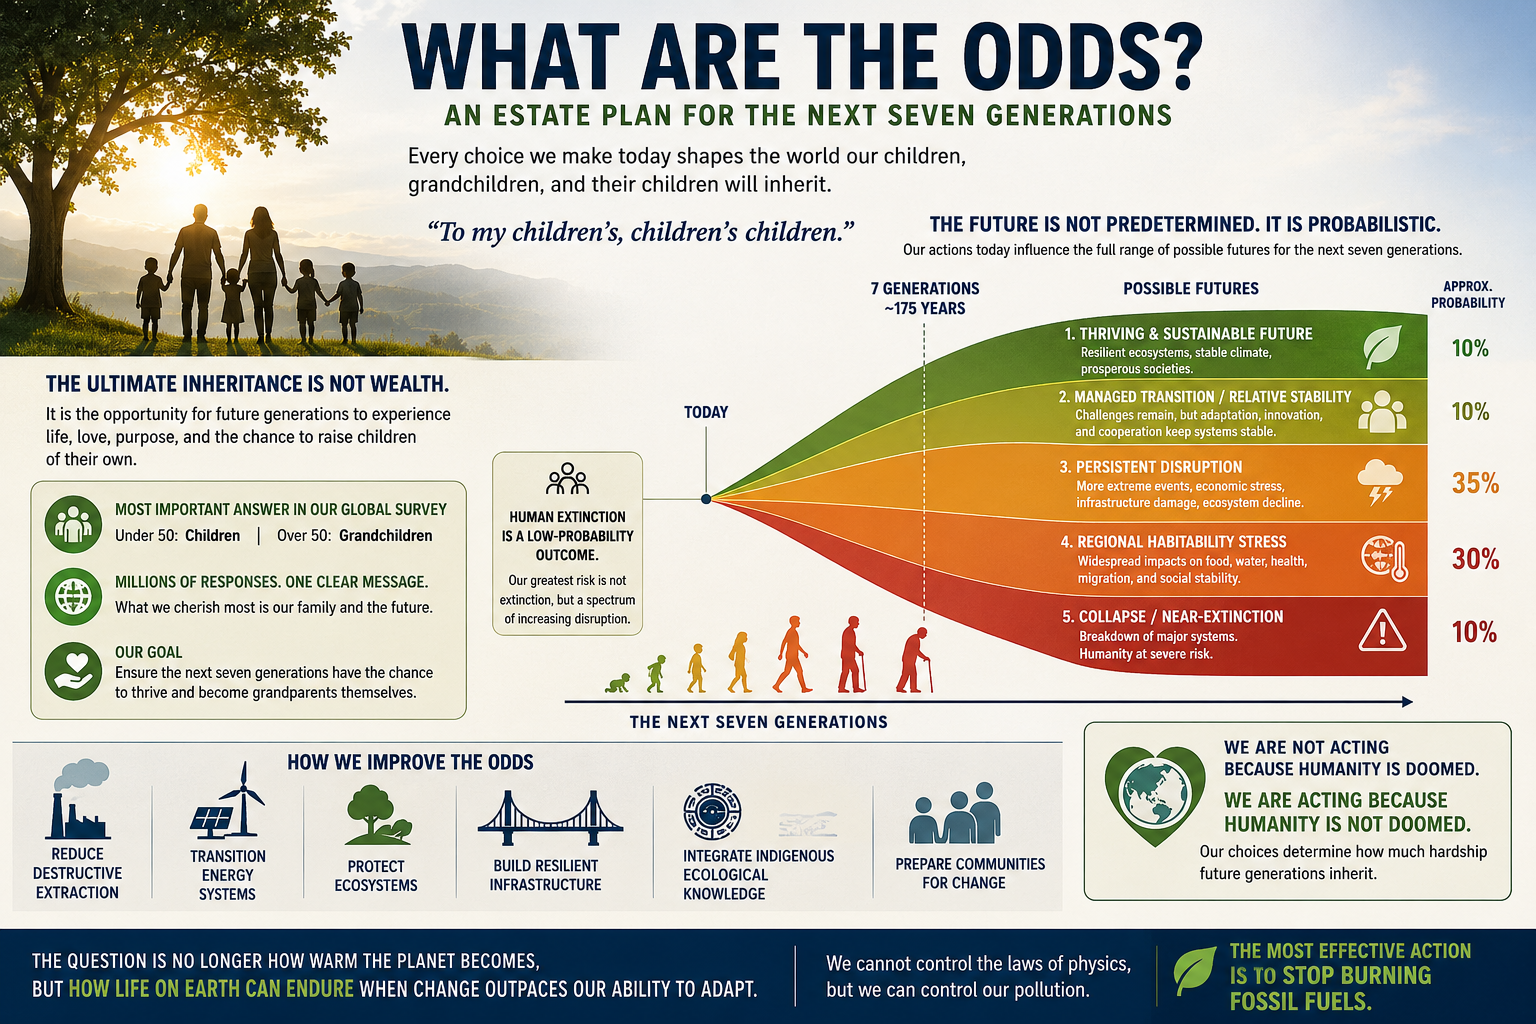
An estate plan should not end with our children—or even our grandchildren. It should extend seven generations into the future.
My grandchildren deserve the opportunity to become grandparents themselves. Their grandchildren deserve the same opportunity.
That is entirely achievable—but only if we make wise decisions today.
The graph that follows illustrates that idea.
Every choice we make now influences the range of possible futures available to the next seven generations.
Some outcomes are relatively optimistic. Some involve increasing climate disruption.
Some are far more severe.
Importantly, human extinction remains a low-probability outcome.
The far more likely future is not one of sudden extinction, but one that spans a spectrum of increasing disruption—affecting ecosystems, agriculture, infrastructure, economies, public health, migration, and regional habitability.
The probabilities are not fixed. They are shaped by the decisions humanity makes over the coming decades.. including today.
That changes the conversation entirely.
The question is no longer:
“Are humans going extinct?”
The more important question is:
“How difficult do we want life to be for the next seven generations?”
That question naturally leads to practical priorities:
Reduce destructive extraction of fossil fuels and natural resources.
Transition to cleaner and more resilient energy systems.
Protect and restore forests, wetlands, and other ecosystems.
Build infrastructure capable of withstanding future climate conditions.
Integrate Indigenous ecological knowledge alongside modern science.
Prepare communities to adapt to unavoidable change.
The most important message is this:
We are not acting because humanity is doomed.
We are acting because humanity is not doomed.
Our choices today determine how much hardship future generations inherit.
Ultimately, this is not simply a discussion about climate change.
It is an estate planning exercise on a planetary scale.
The question is no longer how warm the planet becomes.
The question is how well civilization—and the generations that follow us—can endure as environmental change accelerates faster than our ability to adapt.
We cannot rewrite the laws of physics. But we can decide how much pollution we continue to add to the atmosphere.
The most effective step we can take is also the simplest:
Stop burning fossil fuels as quickly and responsibly as possible, while building a more resilient world for the generations that follow.
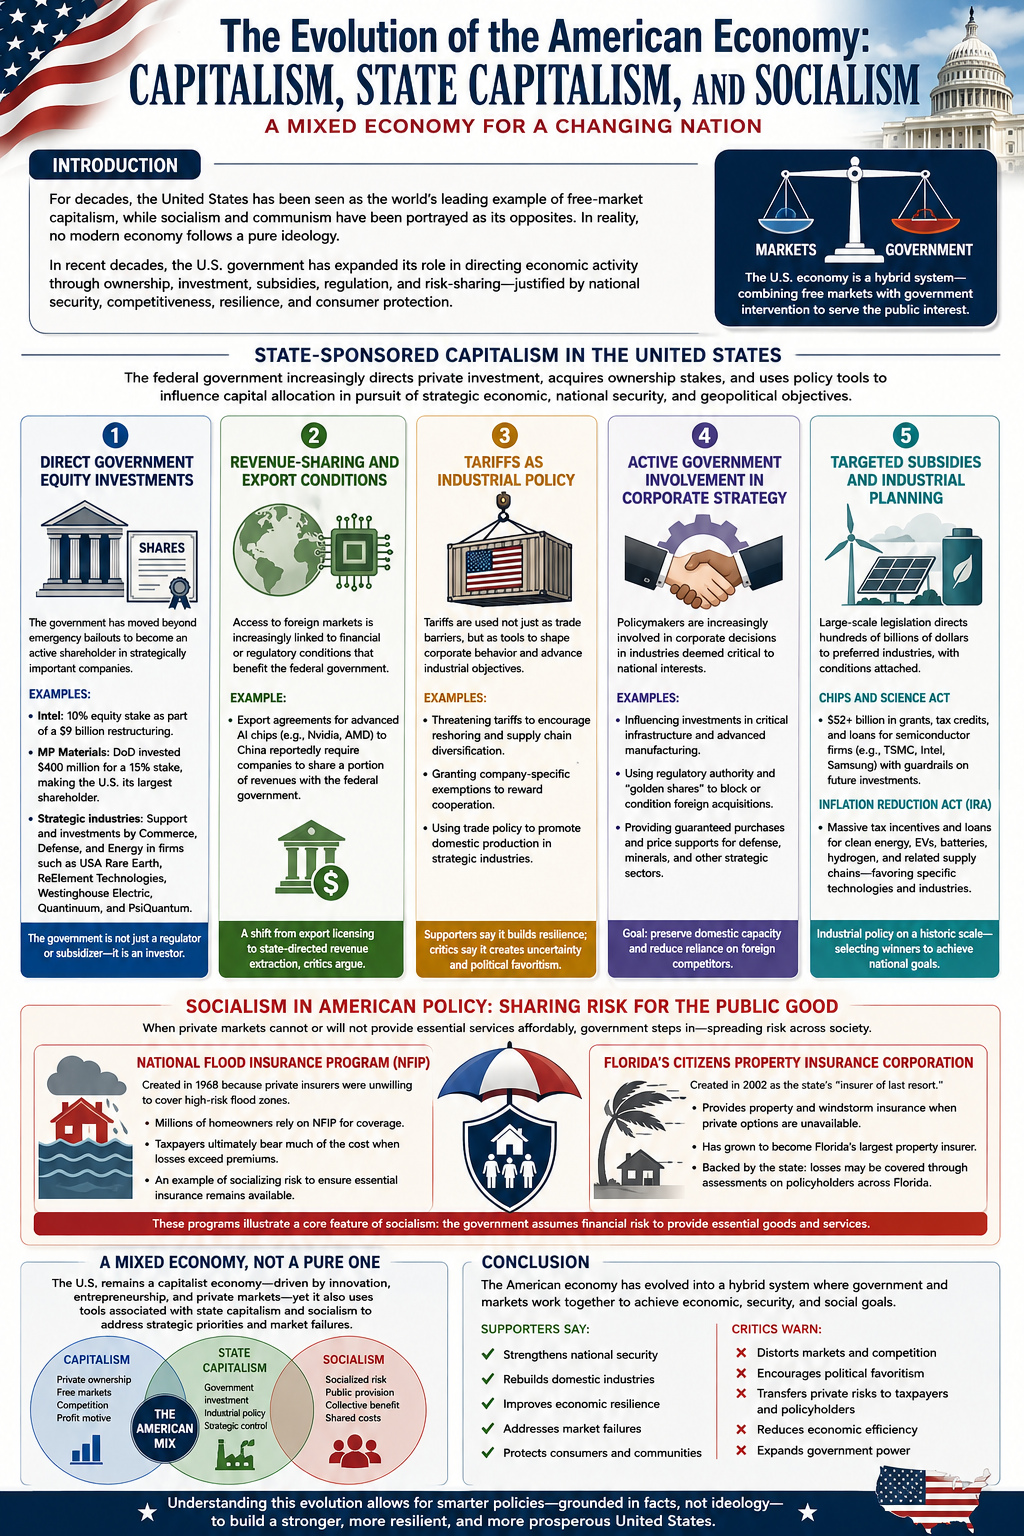
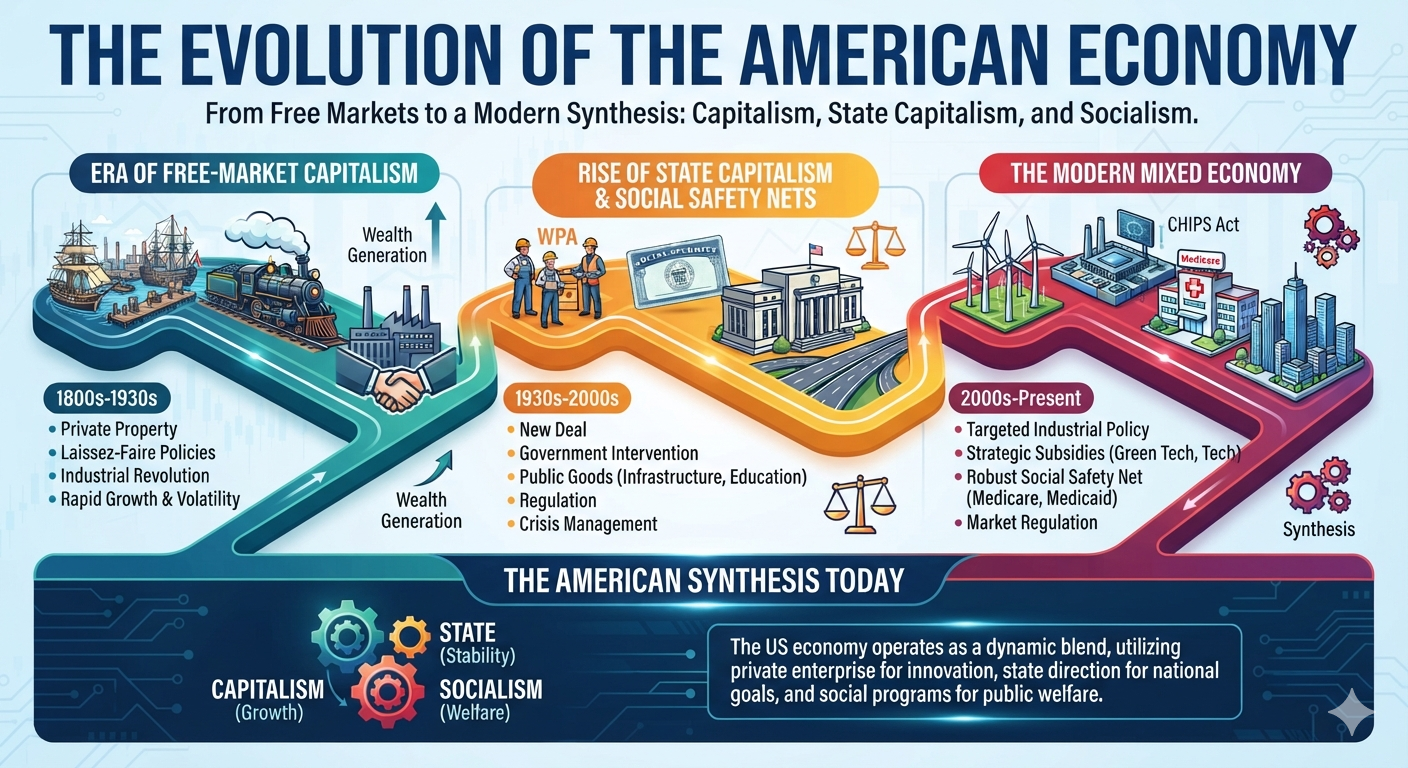
For much of its history, the United States has been portrayed as the world’s leading example of free-market capitalism, while socialism and communism have often been presented as fundamentally incompatible with American economic principles. In reality, no modern economy operates as a pure ideological model. Instead, governments continually adapt their economic policies in response to war, financial crises, technological competition, natural disasters, and changing national priorities.
Over the past several decades—and especially in recent years—the United States has significantly expanded the role of government in directing economic activity. Federal and state governments now provide targeted subsidies, acquire ownership stakes in private companies, shape investment decisions, guarantee markets for strategic industries, and assume financial risks that private markets are unwilling to bear. These policies are generally justified on the grounds of national security, economic competitiveness, supply-chain resilience, disaster recovery, or consumer protection.
This paper examines how these policies reflect characteristics traditionally associated with state-sponsored capitalism and socialism. Rather than arguing that the United States has abandoned capitalism, it demonstrates how the American economy has evolved into a hybrid system that combines free markets with substantial government intervention. Understanding this evolution provides important context for evaluating current economic policy and the changing relationship between government and private enterprise.
State-Sponsored Capitalism in the United States
State-sponsored capitalism (also called state capitalism) refers to an economic system in which the government plays an increasingly active role in directing private investment, acquiring ownership stakes in companies, or using public policy to influence capital allocation in pursuit of strategic economic, national security, or geopolitical objectives.
In recent years, the United States has moved further toward this model. While market mechanisms remain the foundation of the U.S. economy, successive administrations have expanded the federal government’s role through direct investments, industrial policy, subsidies, export controls, tariffs, and other forms of intervention designed to strengthen domestic manufacturing, secure critical supply chains, and enhance national competitiveness.
The principal mechanisms through which the federal government has pursued state-sponsored capitalism include the following:
1. Direct Government Equity Investments
Historically, federal ownership of private corporations was generally limited to temporary emergency bailouts. More recently, however, the government has begun acquiring direct equity positions in strategically important companies.
Examples include:
Intel: The federal government obtained a 10% equity stake in Intel as part of a restructuring package that included approximately $9 billion in federal support.
MP Materials: The Department of Defense invested approximately $400 million to acquire a 15% ownership stake in MP Materials, making the federal government its largest shareholder while supporting domestic rare-earth mineral production.
Strategic Industries: Federal agencies, including the Departments of Commerce, Defense, and Energy, have supported or invested in companies involved in critical technologies and infrastructure, including USA Rare Earth, ReElement Technologies, Westinghouse Electric Corporation, Quantinuum, and PsiQuantum.
These investments represent a notable departure from traditional industrial policy by making the government not only a regulator and subsidizer, but also an investor.
2. Revenue-Sharing and Export Conditions
The federal government has increasingly linked access to export markets with financial or regulatory conditions.
One example is the export framework governing advanced artificial intelligence chips. Agreements allowing companies such as Nvidia and AMD to export certain AI processors to China have reportedly included provisions requiring companies to share a portion of the resulting revenues with the federal government. Critics, including analysts at the Cato Institute, argue that this approach resembles state-directed revenue extraction rather than conventional export licensing.
3. Tariffs as Industrial Policy
Tariffs have become an increasingly important instrument of industrial strategy.
Rather than functioning solely as broad trade barriers, tariffs have also been used to influence corporate behavior.
Examples include:
Threatening tariffs to encourage companies to relocate manufacturing or diversify supply chains.
Granting company-specific exemptions or adjustments that reward firms aligning with national industrial objectives.
Using trade policy to encourage domestic production in strategically important industries.
Supporters argue these measures strengthen national resilience, while critics contend they increase uncertainty and allow greater political influence over private investment decisions.
4. Active Government Involvement in Corporate Strategy
Federal policymakers have become increasingly involved in major corporate decisions affecting industries considered strategically important.
Examples include:
Influencing investment decisions involving critical infrastructure and advanced manufacturing.
Exercising regulatory authority to discourage foreign acquisitions of strategically important companies.
Employing “golden share” mechanisms or comparable government veto powers in selected transactions involving national security interests.
Providing guaranteed purchase agreements or price supports for defense-related technologies, critical minerals, and other strategic industries.
These policies seek to preserve domestic industrial capacity while reducing dependence on foreign suppliers.
5. Targeted Subsidies and Industrial Planning
The expansion of state involvement did not begin with direct government ownership. Earlier legislation established a broad framework for government-directed industrial policy through grants, tax incentives, loans, and regulatory requirements.
The CHIPS and Science Act
The CHIPS and Science Act committed more than $52 billion in grants, tax credits, and loan guarantees to expand domestic semiconductor manufacturing. Major beneficiaries include Intel, TSMC, Samsung, and other semiconductor producers.
Recipients were also subject to “guardrail” provisions limiting certain future investments in countries considered strategic competitors.
The Inflation Reduction Act (IRA)
The Inflation Reduction Act created extensive tax credits, grants, and financing mechanisms supporting renewable energy, electric vehicles, battery manufacturing, hydrogen production, and related supply chains.
The legislation represents one of the largest industrial policy initiatives in U.S. history, directing hundreds of billions of dollars toward technologies identified by policymakers as priorities for the energy transition.
A New Economic Model?
Taken together, these policies illustrate a significant evolution in the relationship between the federal government and private enterprise. Rather than relying primarily on market incentives and regulatory oversight, the government has increasingly acted as investor, financier, customer, shareholder, trade negotiator, and strategic planner.
Supporters argue that these interventions are necessary to compete with state-directed economies such as China, strengthen national security, rebuild domestic manufacturing, and secure critical supply chains.
Critics counter that expanding government ownership, selective subsidies, preferential treatment, and direct intervention in private markets blur the traditional distinction between free-market capitalism and state-sponsored capitalism. They warn that such policies may distort competition, encourage political favoritism, and reduce market efficiency.
Whether viewed as a pragmatic response to global competition or a fundamental shift in American economic philosophy, the growing role of the federal government in directing private capital represents one of the most consequential developments in U.S. economic policy in decades.
Socialism
One characteristic commonly associated with socialism is the government assuming responsibility for providing goods or services that private markets are unable or unwilling to provide. In these cases, financial risks and costs are shared across society through taxes, mandatory assessments, or publicly backed insurance programs.
The U.S. insurance industry provides several examples of this approach.
The National Flood Insurance Program (NFIP)
The National Flood Insurance Program (NFIP), administered by the Federal Emergency Management Agency (FEMA), was established in 1968 because private insurers were largely unwilling to provide affordable flood insurance in many high-risk areas.
Rather than leaving homeowners without coverage, the federal government assumed much of the financial risk. Today, millions of property owners purchase flood insurance through the NFIP, with taxpayers ultimately bearing a substantial portion of catastrophic losses when claims exceed collected premiums. The program illustrates how the government has socialized a specific category of insurance risk that the private market has historically struggled to insure profitably.
Florida’s Citizens Property Insurance Corporation
Florida provides one of the clearest state-level examples of government intervention in insurance markets.
The Citizens Property Insurance Corporation was created by the Florida Legislature in 2002 as a government-established, not-for-profit insurer intended to serve as the state’s “insurer of last resort.” Its purpose is to provide property and windstorm insurance for homeowners, condominium owners, renters, and businesses that cannot obtain comparable coverage from private insurers.
As hurricanes have become more destructive, litigation costs have risen, and many private insurers have reduced their exposure or exited the Florida market altogether, Citizens has expanded dramatically. What began as a safety net has evolved into Florida’s largest property insurer, covering well over one million policies.
Unlike a private insurance company operating solely for profit, Citizens is backed by the state. If claims substantially exceed its financial reserves, Florida law allows Citizens to levy assessments on many insurance policies throughout the state to help cover losses. In effect, the financial risk is spread broadly among policyholders rather than borne exclusively by the individual customers who file claims.
A Mixed Economic Model
Programs such as the National Flood Insurance Program and Citizens Property Insurance Corporation illustrate how the United States operates as a mixed economy rather than a purely laissez-faire capitalist system. When private markets fail to provide essential services at affordable prices, governments have often stepped in to provide financing, insurance, or direct support.
Supporters argue that these programs protect homeowners, stabilize housing markets, and ensure that essential insurance remains available despite increasing climate and catastrophe risks.
Critics contend that publicly backed insurance can distort market signals, encourage development in high-risk areas, and shift financial burdens from individual property owners to taxpayers or other policyholders.
Regardless of one’s perspective, these programs demonstrate that government assumption of economic risk—one characteristic often associated with socialist policies—has become an established component of the American insurance system while coexisting with a predominantly private-market economy.
Conclusion
The American economy has never been completely free of government intervention, but the scope and nature of that intervention have changed substantially over time. Today, federal and state governments influence private markets through direct ownership, industrial policy, targeted subsidies, publicly backed insurance programs, trade policy, regulatory oversight, and strategic investments. These policies increasingly resemble characteristics associated with state-sponsored capitalism, while programs such as federally backed flood insurance and state-run insurers illustrate elements commonly associated with socialized risk.
Supporters argue that these interventions strengthen national security, rebuild domestic manufacturing, improve economic resilience, and address market failures that private enterprise alone cannot solve. Critics contend that expanding government involvement can reduce market efficiency, distort competition, encourage political favoritism, and transfer private risks to taxpayers.
The United States remains a capitalist economy, but it is no longer accurately described as a purely laissez-faire one. Instead, it has evolved into a mixed economic system in which free markets coexist with significant government participation. Recognizing this reality allows for a more informed discussion of public policy—one based not on political labels, but on the practical ways governments and markets increasingly work together to shape economic outcomes.