bookmark_borderFlood-Risk Disclosure Is Financial Risk Management: Pennsylvania’s New Law and the Growing Climate Liability of Real Estate

By Daniel Brouse and Sidd Mukherjee

Insurance and Real Estate | Financial Analysis | Independent Climate Research | Physics and Climate Systems

Overview

🏠 PENNSYLVANIA’S NEW FLOOD-RISK DISCLOSURE LAW: WHAT HOME BUYERS NEED TO KNOW

A home may be your biggest investment. Do you know its flood risk—and whether your insurance will cover the damage?

Pennsylvania’s new flood-risk disclosure law brings an important issue into focus: flood risk is not just an environmental problem. It is an insurance, real estate, financial planning, and consumer protection issue.

The paper, Flood-Risk Disclosure Is Financial Risk Management: Pennsylvania’s New Law and the Growing Climate Liability of Real Estate, Daniel Brouse and Sidd Mukherjee, examine the implications of this legislation and why informed property decisions matter.

Drawing on previous work in insurance, real estate, financial analysis, physics, and climate research, the paper explores:

• What Pennsylvania’s new law means for home buyers and sellers.

• Why standard homeowners insurance generally does not cover flood damage.

• How flood exposure can affect property values, insurance costs, and household finances.

• Why historical flood records alone cannot fully establish future risk.

• How climate change, better disclosure, insurance planning, and practical mitigation fit together.

• Why renters, existing homeowners, and taxpayers also have a stake in flood-risk awareness.

The bottom line: A property’s purchase price tells only part of the story. Buyers need to understand the risks, insurance limitations, and potential future expenses associated with owning it.

The conclusion is simple: Know the risks. Protect your investment. Build more resilient communities.

#FloodRisk #Pennsylvania #RealEstate #Insurance #ClimateChange #ConsumerProtection #ClimateAdaptation

Introduction

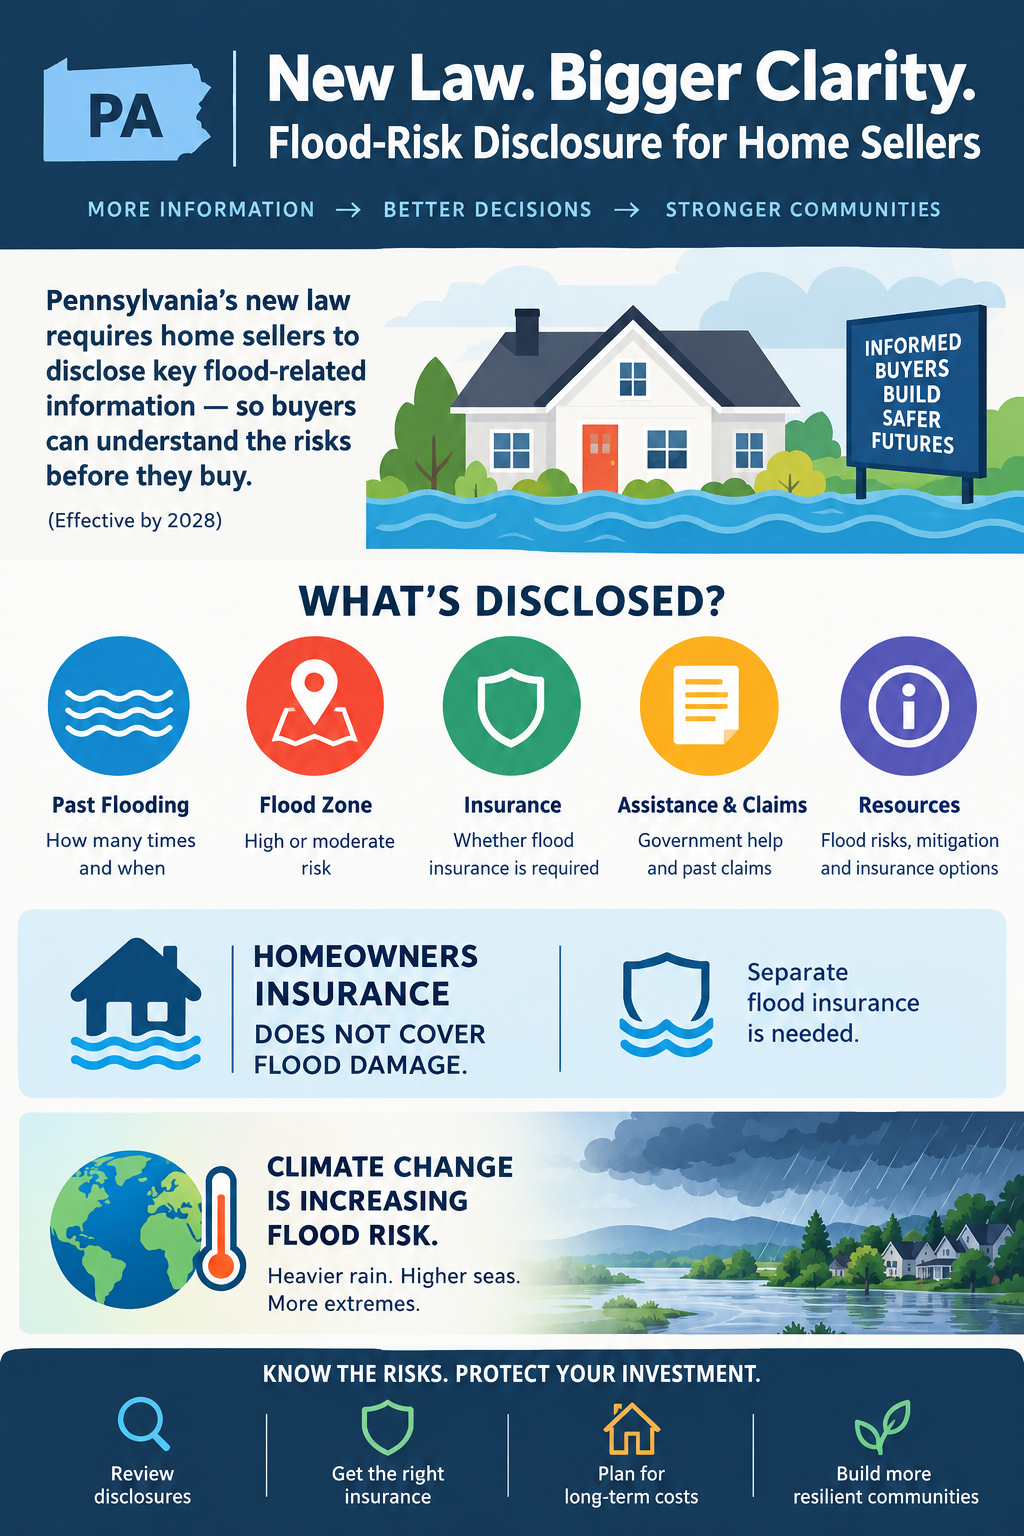
Pennsylvania’s new flood-risk disclosure law recognizes a fundamental principle of responsible financial decision-making: people cannot adequately evaluate a property’s financial risks when material information about those risks is unavailable or undisclosed. Signed into law on October 22, 2026, House Bill 1704 strengthens residential real estate disclosures concerning flood history, flood insurance, and related risk factors. The law also directs the Pennsylvania Insurance Department to provide public information about flood risks, mitigation, and insurance options.

This legislation has implications extending well beyond real estate transactions. Flood risk affects property valuation, mortgage lending, insurance adequacy, household financial security, municipal budgets, and taxpayer exposure. Climate change adds another dimension by altering the conditions under which property risks must be evaluated. Historical flood records and existing hazard maps are important, but they cannot, by themselves, establish the full range of future risks.

Drawing on decades of experience in insurance, real estate, financial analysis, and independent climate research, this paper argues that Pennsylvania’s legislation is an important step toward more informed property transactions. It also identifies the limitations of disclosure alone and the need for integrated climate-risk assessment, transparent insurance information, forward-looking property valuation, and financially responsible adaptation.

1. Introduction: The Financial Consequences of Undisclosed Risk

Pennsylvania has taken an important step toward protecting homebuyers from financial losses they may not anticipate when purchasing residential property.

On October 22, 2026, Governor Josh Shapiro signed House Bill 1704 into law. As reported by WHYY on October 27, the legislation expands the information residential property sellers must disclose about flooding and related risks. Compliance with the revised disclosure requirements is scheduled for the summer of 2028. WHYY’s report on the new law.

The underlying issue is straightforward: purchasing a home is one of the largest financial commitments most households make. Buyers need accurate information about the property’s condition, operating expenses, insurability, and exposure to foreseeable losses. When important risks are not adequately communicated, buyers can make decisions based on an incomplete assessment of the property’s true financial cost.

My professional experience spans real estate, mortgage banking, financial planning, accounting, and financial analysis. My independent climate research, which began in 1992, has focused on the physical processes driving climate change and the implications of a changing climate for human systems.

These fields converge on a common principle: risk that is omitted from a financial decision does not disappear. It remains a potential liability.

Flood-risk disclosure is therefore not simply a paperwork requirement. It is part of the larger responsibility to ensure that property buyers, lenders, insurers, and communities can make informed decisions about the assets and liabilities they assume.

2. What Pennsylvania’s New Law Requires

House Bill 1704 amends Pennsylvania’s residential real estate disclosure provisions under Title 68 of the Pennsylvania Consolidated Statutes.

The legislation strengthens the information buyers receive about flood-related risks. Among the provisions described in the enacted legislation and WHYY’s reporting are requirements concerning:

  • The number of times a property has experienced flooding and the estimated dates of those incidents.
  • Whether a property is located in a Federal Emergency Management Agency-designated high- or moderate-risk flood zone.
  • Whether flood insurance is required for the property.
  • Whether the seller has received government assistance for flood damage.
  • Whether the seller has filed a flood insurance claim.

The law also directs the Pennsylvania Insurance Department to publish information about flood-risk factors, mitigation measures, insurance coverage, and resources for identifying properties in flood-hazard areas.

The revised disclosure process will include a written notice advising prospective buyers that many Pennsylvania properties face flood risks and that standard homeowners insurance typically does not cover flood damage. Buyers are encouraged to consult insurance professionals and investigate separate flood coverage.

These requirements are significant because they connect property disclosures with practical financial decisions. Buyers need to know not only whether a property has flooded but also whether the insurance they expect to protect their investment will actually cover the loss.

The important distinction is between knowing that a risk exists and understanding the financial consequences of that risk. Effective disclosure should help buyers investigate both.

Sources: Pennsylvania House Bill 1704 and the Pennsylvania Insurance Department’s announcement.

3. The Insurance Problem: Homeowners Coverage Is Not Flood Coverage

One of the most consequential misconceptions in residential property ownership is that a standard homeowners insurance policy covers every major source of property damage.

It does not.

Standard homeowners policies generally exclude flood damage. Flood insurance is typically purchased separately, either through the National Flood Insurance Program or an eligible private insurer. Coverage terms, exclusions, limits, deductibles, and eligibility vary by policy.

This distinction can have severe financial consequences.

A buyer may purchase a home, obtain a mortgage, and maintain homeowners insurance while remaining exposed to substantial flood losses. The existence of an insurance policy does not establish that the property is adequately insured against every material hazard.

From an insurance and financial-planning perspective, this is a problem of incomplete risk transfer. The homeowner retains a potentially substantial uninsured liability.

A flood can damage structural components, electrical systems, heating and cooling equipment, appliances, flooring, furnishings, and personal possessions. Recovery may involve temporary housing, repairs, reconstruction, and expenses that continue while a property is uninhabitable. Actual coverage depends on the applicable policies and circumstances.

The financial consequences extend beyond the initial repair bill. Flood damage may affect resale value, future insurance costs, mortgage affordability, and the amount of money a household can preserve for retirement or other needs.

This is why the insurance question must be addressed before a transaction closes.

Buyers should determine:

  1. What hazards the homeowners policy covers and excludes.
  2. Whether separate flood insurance is available and appropriate.
  3. What the policy limits, deductibles, exclusions, and waiting periods are.
  4. Whether the coverage is sufficient to address the property’s actual replacement and recovery costs.
  5. How premiums and other carrying costs affect the household’s long-term budget.

Pennsylvania’s new law directs attention to these questions. Its broader value will depend on whether buyers use the information to evaluate their actual exposure rather than treating disclosure as another form to sign.

4. Real Estate Valuation Must Account for Risk

Real estate valuation is not simply a matter of comparing square footage, location, amenities, and recent sales.

A property’s economic value also depends on the costs and risks associated with owning it.

Flood exposure can affect insurance premiums, repair and maintenance expenses, financing conditions, marketability, and the potential for future losses. Two otherwise comparable properties may therefore have materially different economic profiles.

A waterfront home, for example, may offer exceptional recreational value, scenic views, and personal enjoyment. Those benefits may justify a higher purchase price for a particular buyer. However, the same property may carry additional insurance expenses, mitigation costs, and exposure to flooding.

There is no universal answer to whether a property with elevated flood risk is a good investment. That determination depends on the buyer’s objectives, financial resources, risk tolerance, insurance options, and the property’s specific characteristics.

The essential requirement is informed consent to the financial risk.

My experience in real estate and mortgage banking reinforces the importance of distinguishing a property’s purchase price from its total cost of ownership. A transaction can appear affordable at closing while creating substantial future expenses that were not incorporated into the buyer’s original budget.

A more complete financial assessment should consider:

  • Purchase price and financing costs.
  • Property taxes and ordinary maintenance.
  • Homeowners and flood insurance premiums.
  • Expected mitigation and resilience investments.
  • Potential deductibles and uninsured losses.
  • The implications of future hazard changes for resale and financing.

Not every risk can be expressed as a precise dollar amount. Nevertheless, acknowledging uncertainty is better financial practice than treating an incomplete estimate as a comprehensive valuation.

A property’s market price does not automatically reflect its full climate-related financial risk.

Improved disclosures can help correct that information gap, although disclosure alone cannot guarantee that prices, insurance premiums, or lending decisions will fully reflect future exposure.

5. Climate Change Changes the Risk-Assessment Problem

Flood risk is not determined by property history alone. It also depends on precipitation, drainage, topography, river conditions, coastal processes, land development, infrastructure, and the changing physical environment.

Climate change adds an important consideration: historical conditions are not necessarily a complete guide to future conditions.

Warmer air can hold more water vapor, increasing the potential for heavier precipitation under suitable atmospheric conditions. Changes in precipitation patterns can affect runoff, streamflow, drainage systems, and flood hazards. The resulting effects vary by location and depend on local geography, infrastructure, and other factors.

At the same time, flooding can occur outside formally designated high-risk zones. Localized rainfall, overwhelmed drainage systems, changing waterways, and other conditions can produce losses that a buyer might not anticipate from a single map or a property’s previous history.

This does not mean every property will experience increasing flood risk at the same rate. Nor does climate change eliminate the value of historical flood records or FEMA flood maps. Both remain important sources of information.

It means that risk assessment should consider multiple sources of evidence and distinguish present conditions from future possibilities.

My climate research has focused on the interaction of climate processes, feedbacks, and changes in the Earth’s energy system. That work informs a broader concern about financial risk: physical systems can change, and risk assessments that assume past conditions will continue indefinitely can become inadequate.

The appropriate response is not to disregard established flood maps. It is to use them alongside other relevant information, including local flood histories, drainage conditions, infrastructure assessments, updated hazard analyses, and credible forward-looking projections.

For real estate, the distinction is critical. A disclosure based on what a seller knows about past flooding serves a different purpose from a scientific assessment of what could happen to the property over the coming decades.

Historical disclosure documents the past. Climate-informed risk assessment helps evaluate the future. Both are necessary for sound decisions.

6. Disclosure Is Consumer Protection and Fiscal Responsibility

The economic benefits of better disclosure extend beyond individual buyers.

When a homeowner experiences a major uninsured loss, the consequences may include depleted savings, additional borrowing, delayed repairs, mortgage distress, or the loss of accumulated household wealth.

Public assistance may help some affected households, but disaster assistance is not a substitute for comprehensive insurance and does not guarantee full compensation for losses.

Flood damage can also affect local governments through emergency response expenses, infrastructure repairs, drainage improvements, and other recovery costs. Public insurance programs and disaster assistance may expose taxpayers to additional financial obligations.

These consequences connect private property decisions to public fiscal responsibility.

Better disclosure can help buyers make more informed choices about whether to purchase a property, obtain insurance, invest in mitigation, or reconsider the transaction. It can also encourage earlier investments in measures that reduce potential losses.

Depending on the property and hazard, mitigation may include improving drainage, protecting critical equipment, installing appropriate flood-resistant materials, elevating vulnerable components, or undertaking professionally designed structural improvements.

Not every mitigation measure is appropriate for every property, and its cost-effectiveness should be evaluated individually.

Nevertheless, identifying a risk before a loss occurs generally provides more opportunities to plan than discovering it after the damage is done.

Pennsylvania’s legislation addresses one part of this problem by strengthening the flow of information between sellers and buyers. The next challenge is to ensure that the information supports practical decisions rather than merely satisfying a disclosure requirement.

7. The Remaining Gap: Renters and Existing Property Owners

The new law primarily addresses residential property sales. It does not establish a comparable general flood-risk disclosure requirement for landlords and renters.

That distinction matters.

Renters can face serious financial consequences from flooding, including damage to personal belongings, displacement, temporary housing expenses, and interruptions to employment or daily life. A landlord’s building insurance does not necessarily cover a tenant’s personal possessions or additional living expenses.

Tenants may also have limited control over building-level mitigation measures and may not know whether a property has flooded previously.

The absence of equivalent disclosure requirements for renters leaves an important consumer-information gap. WHYY reports that a separate proposal concerning flood disclosures for rental properties had not advanced beyond committee referral as of its October 27, 2026, report.

A comprehensive approach to flood-risk communication should consider both owners and tenants, while distinguishing the respective responsibilities of property owners, insurers, and occupants.

Existing homeowners also need access to understandable information about their current exposure. They should not have to wait until they sell their homes to discover that their insurance coverage is inadequate or that local flood conditions warrant further investigation.

The public information resources required by House Bill 1704 can help address this broader need, provided they remain accessible, useful, and responsive to changing information.

8. Recommendations for a More Comprehensive Approach

Pennsylvania’s new law creates an opportunity to strengthen the relationship between real estate transactions, insurance decisions, climate adaptation, and financial planning.

Several additional measures would build on its foundation.

A. Make flood-risk information accessible before an offer is made

Buyers should be encouraged to investigate flood history, mapped hazards, insurance requirements, and available coverage early in the purchasing process. Discovering significant costs after making a binding commitment can leave buyers with fewer practical options.

B. Distinguish historical records from forward-looking risk

Disclosure forms should communicate what is known about past flooding without implying that a property with no documented history is free from risk. Public resources should help buyers understand the limitations of historical records and hazard maps.

C. Encourage insurance review before closing

Buyers should obtain quotes and review relevant policy terms before finalizing a purchase. This allows insurance costs, deductibles, exclusions, and coverage availability to inform the household budget and purchase decision.

D. Incorporate climate risk into property and infrastructure planning

Local governments, lenders, insurers, and property owners should evaluate relevant forward-looking hazard information when making long-term decisions. The appropriate analysis will differ between inland river flooding, localized stormwater flooding, and coastal exposure.

E. Expand consumer education

Disclosure is most effective when people understand what the information means. Public education should explain the difference between homeowners insurance and flood insurance, how to investigate risk, what mitigation can accomplish, and where to obtain qualified advice.

F. Evaluate affordability and financial feasibility

Some households have limited alternatives when searching for affordable housing. Better information cannot, by itself, resolve that constraint. Policy responses should recognize the need to balance risk awareness with practical access to housing and the cost of mitigation and insurance.

G. Improve transparency across the property lifecycle

Risk information should not be viewed solely as a requirement at the point of sale. Property owners, renters, insurers, lenders, and local officials all benefit from accessible information that supports ongoing risk management.

These recommendations are consistent with a basic principle of financial analysis: identify material risks, estimate their potential consequences, evaluate the available responses, and make decisions with a clear understanding of the remaining uncertainty.

9. Integrated Climate Stewardship and Property Risk

My broader approach to climate solutions is called Integrated Climate Stewardship. It emphasizes reducing avoidable resource consumption and climate impacts while directing resources toward practical benefits and resilience.

Applied to real estate, this framework supports a comprehensive approach to property risk rather than treating flood disclosure, insurance, energy use, infrastructure, and climate adaptation as unrelated issues.

A property is part of a larger system. Its financial performance depends not only on the building itself but also on the surrounding environment, public infrastructure, insurance market, utilities, and community resilience.

The same principle applies to climate risk. Effective management requires attention to both the physical hazard and the economic systems that determine who bears the losses.

For an individual homeowner, that may mean evaluating insurance coverage, reducing avoidable exposure, and making cost-effective improvements. For a community, it may mean improving drainage, maintaining infrastructure, updating hazard assessments, and evaluating development decisions against long-term risks.

For lenders and insurers, it means recognizing that reliable risk information is essential to assessing potential losses. For policymakers, it means considering the distribution of costs among property owners, private insurers, public programs, and taxpayers.

This is not an argument that every climate-related risk can be eliminated. It is an argument that avoidable financial exposure should not be ignored simply because the relevant costs may occur years after a transaction.

10. Conclusion: Disclosure Is the Beginning, Not the End

Pennsylvania’s new flood-risk disclosure law establishes an important principle for residential real estate: prospective buyers deserve more complete information about a property’s flood history and related insurance considerations.

That principle aligns with longstanding practices in responsible insurance, real estate, and financial analysis. A major financial commitment should be based on an informed assessment of material risks, not merely on the purchase price or the assumption that existing insurance covers every foreseeable loss.

The legislation is a meaningful step, but its limits must be understood. Disclosure does not prevent flooding, guarantee affordable insurance, eliminate uninsured losses, or ensure that property values accurately reflect future climate conditions. Its effectiveness will depend on implementation, public understanding, and the decisions that buyers and other stakeholders make with the information provided.

Climate change adds urgency to the broader question of how society evaluates long-lived assets. Homes, mortgages, infrastructure, and insurance arrangements often extend across decades. Risk assessments that rely exclusively on past conditions can leave households and institutions exposed when relevant conditions change.

My experience in insurance, real estate, mortgage banking, financial analysis, and climate research leads to one central conclusion:

Sound property ownership requires more than knowing what a home costs today. It requires understanding the risks, liabilities, and future expenses that come with owning it.

Pennsylvania’s new law moves the state toward that objective. The next step is to connect better disclosure with informed insurance decisions, climate-aware valuation, practical mitigation, and financially responsible planning.

The goal should be straightforward: fewer preventable losses, better-informed buyers, more resilient communities, and less avoidable financial risk for homeowners and taxpayers alike.


Sources and Further Reading

  1. Sophia Schmidt, “Gov. Shapiro signs law requiring home sellers to disclose more about a home’s flood risk,” WHYY, October 27, 2026.
  2. Pennsylvania General Assembly, House Bill 1704, 2025–2026 Regular Session.
  3. Pennsylvania Insurance Department, “Governor Shapiro Signs New Law to Improve Transparency for Homeowners and Protect Pennsylvanians from Unexpected Flood Losses,” October 23, 2026.
  4. Commonwealth of Pennsylvania, Do I Need Flood Insurance?.

This paper presents professional and analytical commentary on flood-risk disclosure, insurance, real estate, and climate adaptation. It is not legal, insurance, investment, or property-specific advice.
bookmark_borderReal Estate Climate Risk Models

by Daniel Brouse and Sidd Mukherjee

Background

Sidd said: “frightening article by Jeff Masters. We saw some of this coming, the flood risk aint just
along the coast, it extends 100 miles inland…
the water cant get out …”

https://yaleclimateconnections.org/2026/08/the-floods-of-the-future-wont-come-one-at-a-time/

In the 1990s, Sidd and I began developing real-estate-based climate risk models. From the beginning, one of the underlying high-risk factors was flooding—and, closely linked to it, the availability and affordability of flood insurance. In the early 2000s, we met with FEMA, Fannie Mae (FNMA), and Freddie Mac (FHLMC) to better understand their flood-risk modeling and emerging plans for managed retreat.

In October 2023, Sidd observed: “Now I am thinking the violent rain will be a bigger problem before we die.”

That concern has become increasingly relevant. As the Earth warms, warmer air can physically hold more water vapor than cooler air. For every 1°C (1.8°F) increase in temperature, the atmosphere can hold approximately 7% more moisture, increasing the potential for extreme precipitation. Over a 10°C increase, atmospheric moisture-holding capacity would nearly double, creating the potential for substantially more intense rainfall.

The problem, however, is not simply the amount of water falling from the sky. It is also what happens when that water moves across the landscape—and whether infrastructure and government response systems are capable of managing, containing, and recovering from the resulting flows.

Flow forces scale with the square of velocity (v²). As flow speeds increase—whether from heavier rainfall, steeper runoff, or more intense hydrological events—the destructive force of moving water rises rapidly. Density further magnifies this effect. Water is roughly 800 times denser than air, meaning that a comparable flow velocity can produce dramatically greater force.

Together, we developed a series of models incorporating the Clausius–Clapeyron relationship, the extreme energy transfer within the water cycle through latent heat, and fluid-flow dynamics. These models increasingly pointed toward a risk structure in which flooding could no longer be treated as an isolated coastal problem. Instead, precipitation intensity, runoff, topography, infrastructure vulnerability, insurance stress, and limited recovery capacity can interact and compound one another across much larger regions.

By 2026, the framework had evolved from a theoretical real-estate climate-risk model into a broader multiplicative risk framework that could be evaluated against observed real-world conditions.

The latest evolution of this work is presented in the following three papers:

bookmark_borderGlobal Real Estate Climate Risk: A Multiplicative Vulnerability Ranking

by Daniel Brouse and Sidd Mukherjee

The Multiplicative Climate Risk Formula

The Multiplicative Climate Risk Formula is a real-estate climate-risk model designed to capture how multiple hazards and vulnerabilities can interact and compound rather than occur independently. The framework incorporates interconnected risks including sea-level rise, storm surge, extreme precipitation, flooding, hydroclimatic whiplash, wildfires, drought, extreme heat, hurricanes, landslides, avalanches, and other cascading hazards.

Rather than treating each hazard as an isolated threat, the model evaluates how hazard exposure, hazard coupling, structural vulnerability, insurance stress, and recovery deficits can multiply overall real-estate risk.

The central premise is simple:

Climate risk is not merely additive. When multiple vulnerabilities interact, their combined impact can be substantially greater than the sum of their individual effects.

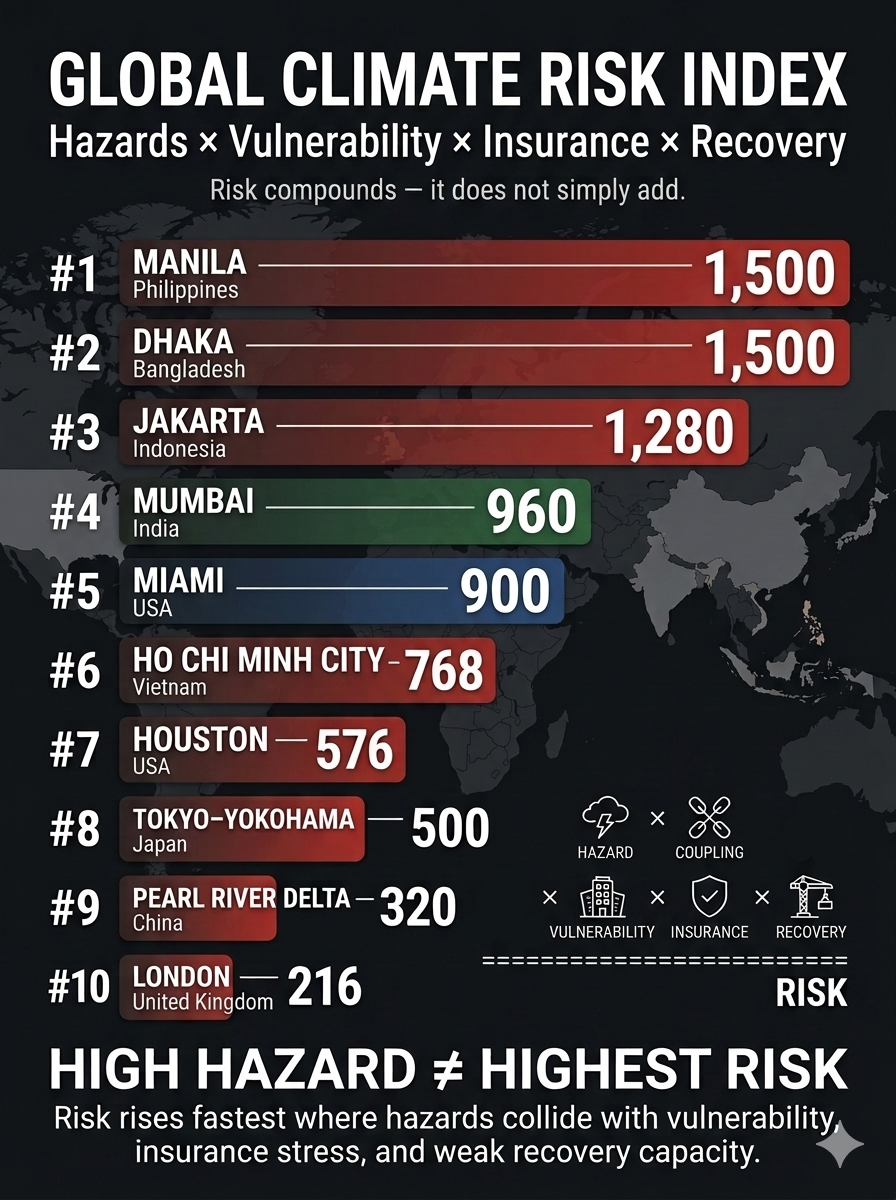
Applying the Multiplicative Climate Risk Formula on a global scale reveals that the greatest real-estate vulnerabilities are concentrated in major metropolitan and economic hubs where intense physical hazards intersect with structural fragility, insurance stress, and limited recovery capacity.

Unlike conventional hazard rankings, this framework recognizes that climate risk is not additive. A region can have relatively resilient buildings yet remain highly exposed because of insurance stress, infrastructure dependence, or coupled hazards. Conversely, a region with extreme physical exposure can rank lower when strong building standards, financial capacity, and rapid recovery systems substantially reduce vulnerability.

The global ranking applies the framework using a 1–5 scale, where 1 = Low and 5 = Extreme:

Hazard Exposure × Hazard Coupling × Vulnerability × Insurance Stress × Recovery Deficit = Multiplicative Real Estate Climate Risk

The resulting score is a comparative risk factor rather than a probability of loss or a forecast of future property values.


1. Manila & Central Luzon, Philippines

Hazard Exposure (5): Exceptional exposure to multiple severe Pacific typhoons, coastal storm surge, extreme rainfall, river flooding, and sea-level rise.

Hazard Coupling (5): Storm surge can coincide with torrential rainfall and river flooding, trapping inland water and producing prolonged flooding across low-lying urban districts.

Vulnerability (4): High population density, uneven construction quality, aging structures, and extensive informal development increase exposure to severe wind and flood damage.

Insurance Stress (3): Commercial insurance is more accessible for premium assets than for much of the broader property market, leaving substantial portions of residential and lower-value real estate underinsured.

Recovery Deficit (5): Severe recovery constraints can arise from infrastructure damage, disrupted electrical systems, engineering shortages, and delays in mobilizing reconstruction resources.

Total Multiplicative Risk: 5 × 5 × 4 × 3 × 5 = 1,500


2. Dhaka, Bangladesh

Hazard Exposure (4): Extreme exposure to tropical cyclones, riverine flooding, intense rainfall, extreme heat, and broader regional water stress.

Hazard Coupling (5): Extreme heat, heavy precipitation, drainage limitations, river flooding, and rapidly expanding urbanization can interact to amplify infrastructure and property losses.

Vulnerability (5): Large concentrations of densely developed, lower-quality and non-engineered structures create substantial exposure to flooding, subsidence, and extreme weather.

Insurance Stress (3): Formal property insurance penetration remains limited, leaving many losses concentrated on property owners and investors rather than broadly distributed through insurance markets.

Recovery Deficit (5): Limited fiscal capacity, infrastructure constraints, and dependence on external recovery financing can substantially extend post-disaster reconstruction.

Total Multiplicative Risk: 4 × 5 × 5 × 3 × 5 = 1,500


3. Greater Jakarta Area (Jabodetabek), Indonesia

Hazard Exposure (4): Severe exposure to chronic land subsidence, monsoonal flooding, extreme rainfall, coastal inundation, and sea-level rise.

Hazard Coupling (5): Land subsidence increases the effective impact of rising seas and high tides, while intense rainfall can overwhelm drainage systems and compound coastal flooding.

Vulnerability (4): Dense development, vulnerable transportation and utility infrastructure, and extensive below-grade systems increase exposure to flood-related disruption.

Insurance Stress (4): High climate-related losses and growing flood exposure can increase underwriting pressure, exclusions, deductibles, and affordability challenges.

Recovery Deficit (4): Major infrastructure investments are underway, but the scale of the metropolitan region and continuing subsidence create substantial long-term recovery and adaptation requirements.

Total Multiplicative Risk: 4 × 5 × 4 × 4 × 4 = 1,280


4. Mumbai Metropolitan Region, India

Hazard Exposure (4): High exposure to intense monsoon rainfall, coastal flooding, tropical cyclones, sea-level rise, and extreme heat.

Hazard Coupling (5): Extreme rainfall interacting with dense urbanization, inadequate drainage, coastal flooding, and heat stress can produce cascading infrastructure and real-estate disruption.

Vulnerability (4): Rapid development, extensive reclaimed land, aging buildings, and high-density urbanization increase exposure to flooding, structural deterioration, and infrastructure failure.

Insurance Stress (3): Climate-risk insurance penetration remains uneven, while rising exposure to flood and heat losses places increasing pressure on commercial and residential property coverage.

Recovery Deficit (4): Aging drainage systems, infrastructure deficits, population density, and high emergency-service demands can prolong recovery following major events.

Total Multiplicative Risk: 4 × 5 × 4 × 3 × 4 = 960


5. Miami & Southeast Florida, United States

Hazard Exposure (5): Exceptional exposure to major Atlantic hurricanes, storm surge, sea-level rise, tidal flooding, and recurrent coastal inundation.

Hazard Coupling (4): Storm surge, rainfall, rising seas, groundwater interactions, and porous limestone geology can combine to produce flooding beyond areas directly affected by rainfall.

Vulnerability (3): Modern buildings benefit from increasingly stringent wind standards, but extensive older and mid-tier residential and commercial properties remain vulnerable to wind, flood, and water intrusion.

Insurance Stress (5): Extreme insurance stress is driven by carrier withdrawals, rising premiums, higher deductibles, reinsurance costs, and growing exposure to catastrophic losses.

Recovery Deficit (3): High private wealth, federal disaster resources, and substantial construction capacity support recovery, although repeated disasters can strain public infrastructure and municipal finances.

Total Multiplicative Risk: 5 × 4 × 3 × 5 × 3 = 900


6. Ho Chi Minh City & Mekong Delta, Vietnam

Hazard Exposure (4): High exposure to chronic flooding, tropical storms, sea-level rise, extreme rainfall, and land subsidence.

Hazard Coupling (4): Tidal intrusion, river flooding, subsidence, upstream water management, and intense rainfall can combine to produce prolonged inundation.

Vulnerability (4): Large concentrations of low-rise residential, industrial, and manufacturing properties remain exposed to flooding and often lack comprehensive floodproofing or elevated mechanical systems.

Insurance Stress (3): Industrial assets may have access to international insurance capacity, but climate-risk pricing and coverage remain uneven across the broader real-estate market.

Recovery Deficit (4): Infrastructure investment continues to expand, but rapid urban and industrial growth can outpace drainage, flood-control, and adaptation capacity.

Total Multiplicative Risk: 4 × 4 × 4 × 3 × 4 = 768


7. Houston & Southeast Texas Gulf, United States

Hazard Exposure (4): High exposure to extreme rainfall, hurricanes, storm surge, coastal flooding, and occasional severe winter weather.

Hazard Coupling (4): Intense rainfall interacting with extensive impervious urban surfaces, bayous, drainage limitations, and coastal water levels can generate widespread property inundation.

Vulnerability (3): Large concentrations of slab-on-grade development and extensive construction across flood-prone areas increase exposure to flooding and infrastructure disruption.

Insurance Stress (4): Rising catastrophe losses, increasing deductibles, and elevated wind, hail, and flood costs place substantial financial risk on property owners.

Recovery Deficit (3): Strong corporate and regional financial capacity supports recovery, but large-scale flood-control, grid, and infrastructure projects can require years to complete.

Total Multiplicative Risk: 4 × 4 × 3 × 4 × 3 = 576


8. Tokyo-Yokohama Metropolitan Area, Japan

Hazard Exposure (5): Exceptional exposure to typhoons, storm surge, extreme rainfall, coastal flooding, and major seismic hazards.

Hazard Coupling (5): Typhoon rainfall can saturate soils and simultaneously trigger landslides, flooding, drainage failures, and infrastructure disruptions.

Vulnerability (2): Strong seismic engineering, rigorous building standards, sophisticated infrastructure, and extensive disaster-preparedness systems substantially reduce structural vulnerability.

Insurance Stress (5): Despite strong domestic resilience, the concentration of enormous asset values and catastrophe exposure creates substantial insurance and reinsurance accumulation risk.

Recovery Deficit (2): Strong national institutions, advanced emergency logistics, substantial financial capacity, and sophisticated construction and engineering systems support comparatively rapid recovery.

Total Multiplicative Risk: 5 × 5 × 2 × 5 × 2 = 500


9. Pearl River Delta — Hong Kong, Shenzhen & Guangzhou, China

Hazard Exposure (5): Exceptional exposure to typhoons, extreme precipitation, coastal flooding, sea-level rise, and heat.

Hazard Coupling (4): Extreme rainfall, storm surge, drainage constraints, underground infrastructure, and disruptions to industrial power and supply chains can interact to create cascading losses.

Vulnerability (2): Modern high-rise construction, extensive engineered infrastructure, and substantial flood and coastal defenses reduce the probability of widespread structural failure.

Insurance Stress (4): The extraordinary concentration of commercial and industrial assets creates significant aggregate-loss exposure for insurers and reinsurers during major catastrophes.

Recovery Deficit (2): Strong governmental capacity, extensive infrastructure, rapid mobilization, and substantial financial resources support comparatively rapid physical recovery.

Total Multiplicative Risk: 5 × 4 × 2 × 4 × 2 = 320


10. London & Thames Estuary, United Kingdom

Hazard Exposure (3): Moderate exposure to storm surge, coastal and river flooding, winter storms, extreme rainfall, and increasing heat stress.

Hazard Coupling (4): Sea-level rise increases pressure on tidal defenses, while a major surge combined with heavy rainfall could disrupt transportation, underground infrastructure, and commercial districts simultaneously.

Vulnerability (3): Extensive historic building stock, aging infrastructure, subsidence-sensitive soils, and limited cooling capacity increase exposure to certain climate hazards.

Insurance Stress (3): Insurance remains broadly accessible, but increasing exposure to flooding, heat, subsidence, and other climate-related losses may increase premiums and underwriting constraints.

Recovery Deficit (2): Strong institutions, substantial fiscal capacity, sophisticated infrastructure, and extensive engineering resources provide significant recovery advantages.

Total Multiplicative Risk: 3 × 4 × 3 × 3 × 2 = 216


Global Climate Risk Index Matrix

Because the framework is multiplicative rather than additive, high structural vulnerability and limited recovery capacity can propel a region above a wealthier, more technologically advanced city even when the latter faces greater absolute exposure to extreme weather.

RankGlobal RegionHazard ExposureHazard CouplingVulnerabilityInsurance StressRecovery DeficitMultiplicative Risk
1Manila & Central Luzon, Philippines554351,500
2Dhaka, Bangladesh455351,500
3Greater Jakarta, Indonesia454441,280
4Mumbai, India45434960
5Miami & Southeast Florida, USA54353900
6Ho Chi Minh City & Mekong Delta, Vietnam44434768
7Houston & Southeast Texas Gulf, USA44343576
8Tokyo-Yokohama, Japan55252500
9Pearl River Delta, China54242320
10London & Thames Estuary, UK34332216

What the Multiplicative Model Reveals

The ranking produces an important result: the most dangerous real-estate markets are not necessarily those with the most extreme individual hazards.

The multiplicative structure rewards resilience and penalizes systemic weakness. A highly exposed city with strong building standards, deep financial reserves, robust infrastructure, and rapid recovery capacity can therefore rank below a less technologically advanced city where multiple vulnerabilities interact.

This is the central insight of the model:

Climate risk is not simply where hazards are strongest. It is where hazards, vulnerability, insurance stress, and recovery deficits compound.

The greatest real-estate risks emerge when physical climate exposure becomes financially and institutionally amplified—turning a weather event into a prolonged property, insurance, infrastructure, and investment crisis.

bookmark_borderCoupled Climate Feedbacks and Cascading Real Estate Risk

by Daniel Brouse and Sidd Mukherjee

How Compound Flooding Is Reshaping Property Values, Insurance Availability, and Coastal Habitability

Climate change is creating a new class of real-estate risk in which the physical hazards of flooding increasingly interact with financial, insurance, infrastructure, and housing systems. Sea-level rise, heavier precipitation, and more intense or slower-moving hurricanes are not independent threats. They can interact to produce compound flooding, while the increasing frequency of damaging events can compress the time available for communities, property owners, insurers, and governments to recover.

The consequences extend far beyond the immediate cost of flood damage. As flood frequency increases, historical assumptions about property risk, insurance pricing, mortgage security, infrastructure design, and long-term property values become progressively less reliable. A property that was once considered a low-probability flood risk can become repeatedly exposed to flooding without the physical structure itself changing. As risk is repriced, insurance can become more expensive, less available, or unavailable altogether. Declining insurability can then reduce property values, constrain mortgage lending, discourage investment, weaken local tax bases, and reduce the resources available for infrastructure maintenance and adaptation.

This creates a coupled socioeconomic feedback loop:

Climate Warming → Hazard Intensification → Hazard Coupling → Compound Flooding → Damage and Losses → Insurance Stress → Property-Value Pressure → Reduced Investment → Infrastructure and Resilience Erosion → Greater Vulnerability → Greater Future Losses

A second feedback develops as recovery intervals contract:

Flood Frequency ↑ → Recovery Time Available ↓ → Unresolved Damage ↑ → Vulnerability ↑ → Subsequent Losses ↑

The resulting process is not simply an increase in flood risk. It is a potential transformation of real estate from a relatively stable store of household and institutional wealth into an increasingly climate-sensitive asset whose value, insurability, and financing depend upon the interaction of physical hazards and socioeconomic resilience.

The central argument of this paper is that real estate and insurance may become among the earliest and most visible indicators of cascading climate risk. When insurance becomes unaffordable or unavailable, property values weaken, lenders reassess collateral, investment retreats, and municipalities lose portions of their tax base, the effects of climate change have moved from the physical environment into the financial structure of communities.


1. Introduction: Climate Risk Is Becoming Real-Estate Risk

Climate change is often described in terms of rising temperatures, heavier rainfall, stronger storms, sea-level rise, and increasingly frequent flooding. Yet for households and communities, the most consequential effects may be transmitted through a different system:

Real Estate → Insurance → Mortgage Finance → Investment → Municipal Revenue → Infrastructure → Property Risk

A flood does not have to destroy a property to damage its economic value.

A property can lose value because:

  • flooding becomes more frequent;
  • flood insurance becomes more expensive;
  • insurance coverage becomes difficult to obtain;
  • insurers withdraw from the market;
  • lenders become more cautious;
  • infrastructure becomes less reliable;
  • buyers perceive increasing future risk;
  • investors demand higher returns for greater exposure;
  • municipal finances deteriorate;
  • repeated flooding reduces confidence in long-term habitability.

This changes the nature of climate risk.

The relevant question is no longer simply:

How much physical damage will the next flood cause?

It becomes:

What happens to the economic value and insurability of property when floods repeatedly occur before the community has fully recovered from previous events?

That is a fundamentally different risk problem.


2. Hurricane Harvey: The Beginning of the Feedback Chain

Hurricane Harvey provides a useful illustration of the physical mechanism underlying this emerging financial risk.

In August 2017, Harvey stalled over Texas and produced more than 40 inches of rainfall across a large area. At Nederland, Texas, 60.58 inches of rain was recorded, the largest single rainfall total associated with a tropical cyclone or its remnants in the United States. Damage was estimated at approximately $164 billion in 2026 dollars, with flooding responsible for most of the losses.

Harvey was also a compound-flood event.

Runoff from extreme rainfall moved toward the Gulf while storm surge pushed seawater inland. The elevated coastal water interfered with drainage, producing flooding through the interaction of rainfall runoff and storm surge.

The physical mechanism can therefore be expressed as:

Extreme Rainfall + Runoff + Storm Surge → Drainage Impairment → Compound Flooding

Climate change adds additional forcing:

Climate Warming → Heavier Rainfall + Higher Sea Level + More Intense/Slower Storms → Greater Compound Flood Risk

But the economic cascade begins after the water arrives:

Compound Flooding → Property Damage → Insurance Claims → Insurance Losses → Higher Insurance Costs and Reduced Availability

This is where physical climate risk begins to transform into financial risk.


3. The Three-Way Climate Pressure on Property

Three major mechanisms increasing compound flood risk along the U.S. Atlantic and Gulf coasts:

  1. More intense and slower-moving hurricanes
  2. Increased heavy precipitation as warmer air holds more water vapor
  3. Sea-level rise.

These mechanisms vary geographically.

Across the Gulf of Mexico and Florida, increased rainfall is projected to be the dominant driver in many locations. Across portions of the Southeast and Mid-Atlantic, changes in intense or slow-moving hurricanes become more important. Along the upper Mid-Atlantic and New England coasts, sea-level rise becomes increasingly dominant.

From a real-estate perspective, however, the distinction between the individual drivers may matter less than their combined effect.

The property does not experience three separate balance sheets.

It experiences one risk environment.

The resulting relationship is:

Sea-Level Rise + Extreme Rainfall + Storm Intensification → Compound Flood Risk → Property Risk

The financial system then responds:

Property Risk ↑ → Insurance Risk ↑ → Financing Risk ↑ → Property Value Pressure ↑

This is the beginning of the real-estate cascade.


4. Compound Flooding Creates Nonlinear Property Risk

The Harvey evidence demonstrates why conventional property-risk calculations can become inadequate.

A 2023 study found that approximately 19% of the flood area around Port Arthur, Texas, during Harvey resulted from compound flooding.

Under a scenario involving 0.57 meters of additional sea-level rise and 18% more rainfall, described as plausible around 2050, the compound-flooding area increased to 33%.

Under a scenario involving 1.6 meters of sea-level rise and 50% additional rainfall, described as plausible by 2100, compound flooding increased to 46%, while the number of structures affected was estimated to increase by approximately 23 times compared with 2017.

This is important for property markets because exposure can increase much faster than any single climate variable.

The relevant relationship is:

Climate Forcing ↑ → Hazard Interaction ↑ → Flood Exposure ↑↑ → Property Risk ↑↑

A property market that prices risk based primarily on historical flood frequency may therefore systematically underestimate future exposure.


5. The Return-Period Problem Becomes a Property-Valuation Problem

Real estate depends heavily on expectations about future risk.

A home buyer, mortgage lender, insurer, developer, or investor is effectively making a long-term assessment:

What is the probability that this property will suffer damaging losses during the period in which I own or finance it?

Historically rare floods can become much more frequent as the physical baseline changes.

Research found that human-driven sea-level rise has quadrupled the frequency of coastal sea-level extremes since 1900. At several locations, relative sea-level rise transformed a coastal flood that was a 100-year event in 1900 into an event occurring every five years or less frequently by 2005.

Recent examples illustrate the magnitude of this transformation.

A flood that historically occurred approximately once every ten years occurred:

Charleston → 17 times in 2025

Galveston → 9 times in 2024

Atlantic City → 10 times in 2024

Miami → 14 consecutive days in October 2025

Key West → 26 of 27 days in October 2025

For real estate, this represents a fundamental repricing problem.

A property does not need to be destroyed for its value proposition to change.

If the frequency of disruptive flooding changes from:

Rare → Occasional → Frequent → Persistent

then the economic characteristics of the property can change correspondingly.


6. The Insurance Market Is the First Financial Transmission Mechanism

Insurance is designed to transfer risk.

But insurance markets depend upon the ability to estimate and diversify that risk.

When climate change causes historical loss probabilities to change rapidly, insurers face a fundamental problem:

Historical Risk Models → Changing Climate Baseline → Increasing Loss Uncertainty

The response can take several forms:

Risk ↑ → Premiums ↑

Risk ↑ → Deductibles ↑

Risk ↑ → Coverage Restrictions ↑

Risk ↑ → Capacity ↓

Risk ↑ → Insurer Withdrawal ↑

For individual homeowners, the immediate consequence is affordability.

For the real-estate market, the deeper consequence is insurability.

Insurance availability is not simply another household expense.

It is part of the financial infrastructure supporting property ownership.


7. Insurance Availability Can Become a Property-Value Constraint

A property with affordable insurance can be financed, sold, and occupied relatively normally.

A property with extremely expensive insurance is economically less attractive.

A property that cannot obtain insurance may become difficult to finance.

The chain becomes:

Flood Risk ↑ → Insurance Cost ↑ → Ownership Cost ↑ → Buyer Demand ↓ → Property Value Pressure ↑

But the cascade can become stronger:

Flood Risk ↑ → Insurance Availability ↓ → Mortgage Financing Constraints ↑ → Buyer Pool ↓ → Property Liquidity ↓ → Property Values ↓

This produces a potentially powerful feedback.

As property values decline:

Property Values ↓ → Tax Base ↓ → Municipal Revenue ↓ → Infrastructure Investment Capacity ↓

If infrastructure resilience subsequently deteriorates:

Infrastructure Resilience ↓ → Flood Vulnerability ↑ → Property Risk ↑

The cycle closes:

Property Values ↓ → Tax Base ↓ → Infrastructure Capacity ↓ → Flood Risk ↑ → Insurance Stress ↑ → Property Values ↓

This is a coupled socioeconomic feedback loop.


8. The Insurance–Mortgage–Real Estate Feedback

Insurance and mortgage finance are closely connected.

A mortgage is a long-duration financial claim secured by an asset expected to retain sufficient value to protect the lender.

As flood risk increases, the financial system therefore confronts several interconnected questions:

Can the property be insured?

At what cost?

Will the property retain its value?

Will future buyers be able to obtain financing?

Will the property remain inhabitable?

The resulting feedback can be represented as:

Flood Risk ↑ → Insurance Risk ↑ → Insurance Cost/Availability Deteriorates → Mortgage Risk ↑ → Lending Constraints ↑ → Buyer Demand ↓ → Property Values ↓

The consequences can extend beyond individual homeowners.

Banks and mortgage investors may increasingly need to evaluate climate exposure at the portfolio level.

A geographic concentration of properties exposed to the same flood hazard creates correlated risk.

Unlike independent household losses, a major regional flood can affect thousands or millions of properties simultaneously.

That makes diversification more difficult.


9. Compound Flooding Creates Correlated Insurance Losses

This is one of the most important implications of compound hazards.

Insurance works most effectively when losses are sufficiently diversified.

But compound climate events can create geographically concentrated losses:

Extreme Rainfall + Storm Surge + High Sea Level → Regional Flooding → Thousands of Simultaneous Claims

A major hurricane can therefore produce simultaneous losses across:

  • homes
  • commercial properties
  • vehicles
  • infrastructure
  • businesses
  • utilities
  • municipal facilities

As compound events become more frequent, the financial system can face increasingly correlated losses.

That creates a feedback:

Compound Events ↑ → Correlated Claims ↑ → Insurer Losses ↑ → Pricing Pressure ↑ → Capacity Constraints ↑

This is fundamentally different from a world in which extreme floods are rare and geographically isolated.


10. Return-Period Compression Changes the Insurance Equation

Research examined extreme compound flooding defined as a one-in-100-year storm surge occurring simultaneously with a one-in-100-year rainfall event.

Historically, the combined event had a return period of approximately 200–500 years along the Gulf and southeastern Atlantic coasts and up to 1,000 years or more in parts of New England. Under an extreme warming scenario for 2100, the frequency increased by approximately 7–36 times in the South and 30–195 times farther north.

For insurance markets, the key issue is not the terminology “100-year event.”

The key issue is the frequency of claims-producing events.

If an event once expected to occur once in several centuries begins occurring multiple times within an insurance portfolio’s planning horizon, historical loss assumptions become increasingly unreliable.

Thus:

Return Interval ↓ → Claims Frequency ↑ → Expected Losses ↑ → Premium Pressure ↑ → Insurance Availability ↓


11. Stronger and Slower Hurricanes Increase Insurance Exposure

Our modeling projects the strongest hurricanes could become approximately 15–30% more intense while moving 20–30% more slowly along much of the U.S. coast. The combination increases the probability of simultaneous extreme rainfall and storm tide.

For property markets, this produces multiple simultaneous threats:

Intensity ↑ → Wind Damage ↑

Intensity ↑ → Storm Surge ↑

Intensity ↑ → Rainfall Potential ↑

Translation Speed ↓ → Rainfall Duration ↑

The combined result is:

Stronger + Slower Storms → Wind + Surge + Rainfall → Compound Property Losses

The insurance consequences can therefore be substantially larger than those associated with a simple increase in storm frequency.


12. Inland Property Markets Are Increasingly Exposed

Flood risk is not confined to oceanfront real estate.

Research finds substantial compound-flooding risks farther inland, including along Gulf Coast rivers where high streamflow can interact with storm surge. Increasing evidence suggests compound flooding can be greatest inland near the limit of tidal influence rather than directly at the coast.

A 2026 preprint found substantial increases in the probability of compound wind and precipitation extremes both within 100 kilometers of the coast and 100–500 kilometers inland under an extreme warming projection.

The significance for real estate is considerable.

Flood risk can migrate geographically.

Coastal Risk → Inland Watershed Risk → Inland Property Exposure

Communities that historically considered themselves outside the principal flood-risk zone can increasingly encounter climate-driven flooding.

That creates a major valuation problem because local markets may have little historical experience with these events.


13. Urban Flooding Creates a New Real-Estate Risk

Urban flooding introduces another dimension.

Extreme precipitation can overwhelm drainage systems even where properties are far from coastlines and major rivers.

The risk can become particularly acute in below-grade housing.

Extreme Rainfall → Stormwater System Overload → Rapid Urban Flooding → Basement/Below-Grade Exposure → Life-Safety Risk

This matters to real estate because conventional flood-risk perceptions often emphasize proximity to rivers, coastlines, or mapped floodplains.

But intense rainfall can create dangerous flooding through overwhelmed urban drainage systems.

As a result:

Flood Risk ≠ Coastal Risk Alone

Increasingly:

Flood Risk = Coastal + Riverine + Pluvial + Urban + Compound Risk

This expansion complicates property valuation, insurance underwriting, and municipal planning.


14. Recovery Deficit Is the Hidden Variable

The most important variable in cascading real-estate risk may not be flood magnitude.

It may be recovery time.

Consider:

Flood A → Damage → Partial Recovery → Flood B → Additional Damage → Partial Recovery → Flood C

If each event arrives before full recovery, unresolved losses accumulate.

A conceptual relationship is:

Resilience(t+1) = Resilience(t) + Recovery(t) − Damage(t)

When:

Recovery > Damage → Resilience Restored

But when:

Damage > Recovery → Resilience Declines

This creates a critical threshold:

Damage Rate > Recovery Rate

Once that condition persists, the system enters a recovery deficit.

For real estate, the consequences include:

Unrepaired Properties → Deferred Maintenance → Lower Property Quality → Lower Values → Reduced Investment → Greater Vulnerability

The property market therefore becomes a mechanism through which physical climate shocks can accumulate.


15. Repeated Flooding Can Produce a Negative Wealth Feedback

Homeownership represents a substantial component of household wealth.

Repeated climate-related losses can therefore create a feedback involving household balance sheets.

Flooding ↑ → Repair Costs ↑ → Insurance Costs ↑ → Property Values ↓ → Household Equity ↓ → Financial Resilience ↓

Lower household financial resilience can make recovery more difficult:

Financial Resilience ↓ → Delayed Repairs → Property Condition ↓ → Property Value ↓

The resulting loop becomes:

Flood Risk ↑ → Property Damage ↑ → Household Wealth ↓ → Recovery Capacity ↓ → Property Vulnerability ↑ → Future Losses ↑

This is particularly significant in communities where property represents a large share of household net worth.

Climate risk can therefore become wealth risk.


16. The Municipal Feedback Loop

The consequences do not stop at individual properties.

Municipal governments depend heavily on property values and economic activity.

A potential cascade is:

Flood Frequency ↑ → Property Damage ↑ → Property Values ↓ → Tax Base ↓ → Municipal Revenue ↓

The municipality then has fewer resources available for:

  • drainage improvements
  • flood defenses
  • road repair
  • stormwater systems
  • emergency response
  • public infrastructure maintenance
  • adaptation

This can produce:

Municipal Revenue ↓ → Infrastructure Investment ↓ → Resilience ↓ → Flood Damage ↑

The feedback closes:

Flood Risk ↑ → Property Values ↓ → Tax Base ↓ → Infrastructure Capacity ↓ → Flood Vulnerability ↑ → Property Risk ↑

At this point, the climate hazard has become embedded in the fiscal condition of the community.


17. The Insurance–Property–Infrastructure Feedback

The major feedback loops can be integrated into a single system:

Climate Warming → Hazard Intensification → Hazard Coupling → Compound Flooding → Physical Damage → Insurance Losses → Premiums/Availability Pressure → Property Value Decline → Investment Decline → Tax Base Erosion → Infrastructure Investment Decline → Resilience Erosion → Greater Flood Vulnerability → Greater Future Losses

This is the core cascading-risk mechanism.

The system is not linear.

Each component can alter the conditions affecting the next component.

The physical climate hazard creates the initial disturbance.

The socioeconomic system can then amplify the disturbance.


18. Insurance May Become an Early-Warning System for Climate Risk

Insurance markets have an unusual role in this transition.

They continuously translate physical risk into financial pricing.

Consequently, insurance-market changes may provide an early indicator of emerging real-estate instability.

The sequence may be:

Physical Risk ↑ → Actuarial Risk ↑ → Premiums ↑ → Deductibles ↑ → Coverage Restrictions ↑ → Insurer Withdrawal ↑

These signals can appear before large-scale property abandonment.

A community may therefore be approaching a real-estate resilience threshold even when most houses remain physically intact.

The early warning may instead appear as:

Insurance Availability ↓

Insurance Affordability ↓

Mortgage Availability ↓

Property Transactions ↓

Investment ↓

Property Values ↓

This suggests that insurance markets should be viewed not merely as financial institutions absorbing climate losses, but as risk sensors embedded within the real-estate system.


19. The Property-Value Feedback Can Accelerate

Once buyers begin incorporating future flood risk into property decisions, market expectations can change.

The feedback can become:

Flood Frequency ↑ → Risk Perception ↑ → Buyer Demand ↓ → Property Values ↓

Lower values can then produce additional effects:

Property Values ↓ → Equity ↓ → Investment ↓ → Maintenance ↓ → Vulnerability ↑

And:

Property Values ↓ → Tax Base ↓ → Public Infrastructure Investment ↓ → Vulnerability ↑

And:

Flood Risk ↑ → Insurance Costs ↑ → Total Cost of Ownership ↑ → Buyer Demand ↓ → Property Values ↓

The system therefore contains multiple reinforcing loops operating simultaneously.

This is what distinguishes a coupled-feedback system from a simple hazard-impact model.


20. The Sandy Example: An Accelerating Financial Risk Clock

Research found that a Sandy-like event in New York City, estimated at approximately once every 150 years in the current climate, could become approximately a once-in-65-year event by 2050 and once-in-30-year event by 2100 under the emissions scenario studied.

From a real-estate perspective, the significance is not simply that the probability of flooding increases.

The economic life of a mortgage, insurance policy, or property investment may span decades.

A hazard that occurs once every 150 years has a very different economic significance from one occurring once every 30 years.

Thus:

Return Interval ↓ → Probability of Loss During Ownership ↑ → Insurance Risk ↑ → Mortgage Risk ↑ → Property Risk ↑

The longer the investment horizon, the more consequential the changing hazard frequency becomes.


21. Sea-Level Rise Creates a Persistent Baseline Shift

Sea-level rise differs from many episodic hazards because it permanently alters the starting point from which future storms occur.

A higher ocean means:

Higher Baseline Water Level → Greater Storm-Surge Reach → Greater Flood Exposure

And:

Sea-Level Rise → Less Drainage Capacity → Greater Interaction Between Runoff and Surge

This means that even if a future storm were identical to a historical storm, its consequences could be different because it would occur against a changed physical baseline.

For property markets:

Sea-Level Rise → Persistent Risk Increase → Long-Term Property Exposure ↑

This is particularly important for real estate because buildings and infrastructure have long lifetimes.


22. The Coastal Property Paradox

Coastal property can remain economically attractive even while its physical risk is increasing.

That creates a potential divergence:

Amenity Value ↑

while:

Climate Risk ↑

For a period, rising demand may conceal increasing physical risk.

But eventually the financial system may begin incorporating the changing risk more aggressively.

The transition can be:

Physical Risk ↑ → Insurance Cost ↑ → Ownership Cost ↑ → Market Awareness ↑ → Buyer Demand ↓ → Property Values ↓

The result may be a delayed repricing.

Real estate markets do not necessarily respond immediately to slowly accumulating physical risk.

Insurance markets, however, may respond sooner because they must continually price expected losses.

This creates the possibility that:

Insurance repricing precedes real-estate repricing.


23. When Insurance Becomes Unaffordable, the Market Changes

Insurance affordability is particularly important because homeowners do not experience insurance as an abstract actuarial variable.

They experience it as part of the cost of owning a property.

The relevant relationship is:

Mortgage + Property Tax + Insurance + Maintenance + Expected Climate Losses = Cost of Ownership

If insurance premiums rise dramatically:

Insurance Cost ↑ → Total Cost of Ownership ↑

The property must either:

Price ↓

or:

Buyer Demand ↓

or both.

If insurance becomes unavailable:

Insurance Availability ↓ → Financing Constraints ↑ → Buyer Pool ↓ → Market Liquidity ↓

The property may remain physically valuable, but its economic utility as a financed asset declines.


24. From Insurability to Habitability

Insurance is not the only threshold.

Eventually, repeated flooding can affect whether a community remains economically and physically viable.

At the most susceptible U.S. sites, the odds of a one-in-50-year coastal flood could approximately double every five years under continuing sea-level rise. It also notes that many U.S. coastal engineering systems were designed around return periods of roughly 50–100 years.

As historically rare floods become increasingly frequent, the question changes.

It is no longer:

Can we recover from a flood?

It becomes:

Can we maintain a functioning community between floods?

That is the transition from flood risk to habitability risk.


25. The Real-Estate Resilience Threshold

A useful conceptual threshold is:

Insurance Cost + Expected Flood Losses + Infrastructure Costs > Property’s Economic Value Proposition

When this condition becomes persistent, the property may remain physically habitable while becoming economically unattractive.

A second threshold occurs when:

Damage Rate > Recovery Rate

At that point, the property or community cannot fully restore itself between successive events.

A third threshold may emerge when:

Protection Cost > Property Value / Tax Base / Available Capital

At that point, continued protection may become economically difficult.

These thresholds can interact:

Flood Risk ↑ → Insurance Cost ↑ → Property Value ↓ → Tax Base ↓ → Protection Capacity ↓ → Flood Risk ↑

This is a cascading threshold system.


26. From Property Decline to Retreat

The ultimate consequence need not be sudden abandonment.

A more realistic process may occur gradually:

Flood Frequency ↑ → Insurance Stress ↑ → Property Values Stagnate → Investment Declines → Maintenance Declines → Infrastructure Deteriorates → Insurance Availability Declines Further → Property Values Fall → Population Outmigration ↑

Eventually:

Population Decline → Tax Base Decline → Infrastructure Capacity Decline → Resilience Decline

At some point, adaptation may become economically preferable to continued protection.

This can lead to:

Protection → Adaptation → Managed Retreat → Abandonment

The timing and geographic extent of such transitions will vary considerably by location.

The key point is that the transition can be driven not by a single catastrophic flood but by cumulative climate risk interacting with economic feedbacks.


27. The Complete Coupled-Feedback / Cascading Real-Estate Framework

The emerging system can be represented as:

Warming → Hazard Intensification → Hazard Coupling → Compound Flooding → Damage → Insurance Losses → Insurance Cost/Availability Pressure → Property-Value Pressure → Reduced Investment → Tax-Base Erosion → Infrastructure Resilience Decline → Greater Vulnerability → Greater Future Losses

A second loop operates through recovery:

Flood Frequency ↑ → Recovery Window ↓ → Unresolved Damage ↑ → Resilience ↓ → Vulnerability ↑ → Subsequent Damage ↑ → Recovery Window ↓

A third loop operates through insurance:

Flood Risk ↑ → Expected Losses ↑ → Premiums ↑ / Coverage ↓ → Cost of Ownership ↑ → Buyer Demand ↓ → Property Values ↓ → Insurer/Lender Risk ↑ → Insurance and Financing Constraints ↑

A fourth operates through municipal finance:

Property Values ↓ → Tax Base ↓ → Municipal Revenue ↓ → Infrastructure Investment ↓ → Resilience ↓ → Flood Risk ↑ → Property Values ↓

These feedbacks are interconnected.

Together they create:

Climate Forcing → Physical Hazard Coupling → Financial Amplification → Resilience Erosion → Cascading Real-Estate Risk


28. A New Definition of Climate-Exposed Property Risk

Traditional real-estate risk often focuses on:

Location + Structure + Historical Flood Zone

A future-oriented model must incorporate additional variables:

Flood Frequency

Compound-Hazard Probability

Sea-Level Rise

Extreme Precipitation

Storm Intensity and Translation Speed

Insurance Availability

Insurance Affordability

Mortgage Availability

Infrastructure Resilience

Recovery Capacity

Property-Value Trajectory

Municipal Fiscal Capacity

The risk of a property is therefore not simply its probability of flooding.

A more comprehensive conceptual formulation is:

Real-Estate Climate Risk ∝ Hazard Exposure × Hazard Coupling × Vulnerability × Insurance Stress × Recovery Deficit

Again, this is a conceptual framework rather than a validated predictive equation.

Its purpose is to recognize that physical exposure and financial vulnerability can amplify one another.


29. Why Historical Property Valuation Models May Become Increasingly Unreliable

A property valuation based heavily on historical comparable sales assumes that the past provides meaningful information about future risk.

But if the climate baseline is changing:

Historical Flood Frequency ≠ Future Flood Frequency

And therefore:

Historical Property Risk ≠ Future Property Risk

This creates the potential for a valuation lag.

A property may continue selling at prices based on historical assumptions even as:

Flood Frequency ↑

Insurance Cost ↑

Infrastructure Stress ↑

Future Risk ↑

The market can therefore experience a delayed repricing once these factors become visible to buyers, lenders, and insurers.

The longer the delay, the greater the possibility of a discontinuous adjustment.


30. The Central Role of Insurance in Price Discovery

Insurance markets can force climate risk into property economics because they must continually reassess expected losses.

This creates a potentially important sequence:

Physical Climate Change → Insurance Repricing → Mortgage Reassessment → Buyer Reassessment → Property Repricing

In this framework, insurance functions as an intermediary between the climate system and the real-estate market.

This makes insurance availability and affordability among the most important indicators to monitor.

A deteriorating insurance market can signal that the physical risk has become financially material even before large-scale property abandonment occurs.


31. The Emerging Climate-Real-Estate Feedback

The broader system can therefore be summarized as:

Physical System

Warming → Sea-Level Rise + Heavier Rainfall + Stronger/Slower Storms → Compound Flooding

Insurance System

Compound Flooding → Claims → Losses → Premium Increases + Coverage Restrictions + Reduced Capacity

Real-Estate System

Insurance Stress → Cost of Ownership ↑ → Buyer Demand ↓ → Property Values ↓

Financial System

Property Values ↓ → Mortgage Risk ↑ → Lending Constraints ↑ → Investment ↓

Municipal System

Property Values ↓ → Tax Base ↓ → Infrastructure Investment ↓

Resilience System

Infrastructure Investment ↓ → Flood Vulnerability ↑

The loop closes:

Flood Vulnerability ↑ → Compound Flood Risk ↑

This is a coupled climate-financial feedback loop.


32. The Difference Between a Disaster and a Cascading Risk

A conventional disaster model begins and ends with the event:

Storm → Flood → Damage → Recovery

The cascading-risk model is different:

Storm → Compound Flood → Damage → Insurance Loss → Financial Stress → Property-Value Decline → Tax-Base Erosion → Infrastructure Stress → Reduced Resilience → Greater Vulnerability → Next Flood → Greater Damage

The disaster is therefore no longer an isolated event.

It becomes a state-changing event.

Each major flood can alter the economic and physical conditions under which the next flood occurs.

This makes the system path dependent.


33. The Most Important Variable May Be the Time Between Disasters

“The Floods of the Future Won’t Come One at a Time”—captures the central problem.

The issue is not simply that flood events become more severe.

It is that the interval between them can become shorter.

The resulting relationship is:

Flood Frequency ↑ + Recovery Time Constant → Recovery Window ↓

Then:

Recovery Window ↓ + Damage Per Event ↑ → Recovery Deficit ↑

Then:

Recovery Deficit ↑ → Property Condition ↓ + Infrastructure Condition ↓ + Financial Resilience ↓

Then:

Resilience ↓ → Consequences of the Next Flood ↑

This is the mechanism through which frequency becomes amplification.


34. From Compound Flooding to Cascading Real-Estate Instability

The complete process can now be expressed in one horizontal chain:

Warming → Hazard Intensification → Hazard Coupling → Compound Flooding → More Frequent Losses → Insurance Stress → Higher Cost of Ownership → Reduced Buyer Demand → Property-Value Decline → Mortgage and Investment Stress → Tax-Base Erosion → Infrastructure Resilience Decline → Recovery Deficit → Greater Future Flood Vulnerability → Cascading Real-Estate Instability

This is the central thesis of the paper.

The most important climate consequence for real estate may not be the destruction of individual properties.

It may be the progressive deterioration of the economic conditions that make those properties insurable, financeable, maintainable, and desirable.


35. Conclusion: When Climate Risk Becomes Property Risk

The emerging flood threat is fundamentally different from the historical model of isolated disasters.

Climate change is increasing the potential for:

Sea-Level Rise + Heavy Rainfall + Stronger/Slower Hurricanes → Compound Flooding

At the same time:

Flood Frequency ↑ → Recovery Windows ↓

These physical changes increasingly interact with:

Insurance

Mortgage Finance

Property Markets

Municipal Finance

Infrastructure

Household Wealth

The resulting system can develop reinforcing feedbacks:

Flood Risk ↑ → Insurance Stress ↑ → Property Values ↓ → Investment ↓ → Infrastructure Resilience ↓ → Flood Vulnerability ↑

and:

Flood Frequency ↑ → Recovery Deficit ↑ → Resilience ↓ → Future Losses ↑

These feedbacks create the possibility of nonlinear and cascading consequences.

The immediate manifestation may be rising insurance premiums, shrinking insurance availability, higher deductibles, declining property demand, or increasing difficulty obtaining mortgages.

The next stage may be declining property values and reduced investment.

The subsequent stage may involve weakening municipal tax bases, deteriorating infrastructure, and increasing difficulty financing adaptation.

The final stage in the most vulnerable locations could involve managed retreat, population displacement, and abandonment.

The critical transition is therefore:

Climate Risk → Insurance Risk → Real-Estate Risk → Financial Risk → Municipal Risk → Resilience Risk → Cascading Systemic Risk

This suggests that real estate and insurance markets should be treated as critical components of the climate system’s socioeconomic response.

Insurance is not merely a mechanism for paying claims after a disaster. It is a mechanism for translating physical risk into financial information.

Real estate is not merely a collection of buildings. It is a store of household wealth, collateral for debt, a source of municipal revenue, and the foundation of local economic activity.

When the physical climate changes, these interconnected systems change with it.

The most consequential question is therefore not simply:

Will a property flood?

It is:

Will the property remain insurable, financeable, valuable, maintainable, and economically viable as the probability of flooding changes?

That is the central real-estate question of the emerging climate era.

The ultimate risk is not a single catastrophic flood.

It is the transition from:

Rare Disaster → Recurrent Hazard → Compound Flooding → Insurance Stress → Property Repricing → Investment Retreat → Resilience Erosion → Cascading Real-Estate Risk

When floods begin arriving faster than properties, infrastructure, insurers, lenders, governments, and communities can adapt, the flood itself becomes only the initiating event.

The deeper crisis is the progressive erosion of the economic and institutional systems that allow a place to remain habitable and investable.

In that sense, the future of climate-exposed real estate may be determined less by whether a property floods once than by whether the surrounding system can continue to recover between floods.

The flood becomes the trigger.
Insurance becomes the transmission mechanism.
Real estate becomes the financial amplifier.
Resilience becomes the limiting factor.
And cascading risk becomes the ultimate consequence.

bookmark_borderHigh-Risk U.S. Real Estate Regions Under the Multiplicative Climate Risk Framework

by Daniel Brouse and Sidd Mukherjee

The Multiplicative Climate Risk Formula

The Multiplicative Climate Risk Formula is a real-estate climate-risk model designed to capture how multiple hazards and vulnerabilities can interact and compound rather than occur independently. The framework incorporates interconnected risks including sea-level rise, storm surge, extreme precipitation, flooding, hydroclimatic whiplash, wildfires, drought, extreme heat, hurricanes, landslides, avalanches, and other cascading hazards.

Rather than treating each hazard as an isolated threat, the model evaluates how hazard exposure, hazard coupling, structural vulnerability, insurance stress, and recovery deficits can multiply overall real-estate risk.

The central premise is simple:

Climate risk is not merely additive. When multiple vulnerabilities interact, their combined impact can be substantially greater than the sum of their individual effects.

Applying the Multiplicative Climate Risk Formula reveals an important characteristic of climate-driven real-estate risk: the highest-risk regions are not necessarily those experiencing the most dramatic individual weather events. The greatest systemic risk emerges where multiple risk dimensions interact and amplify one another.

A region can experience severe hurricanes, wildfires, flooding, or extreme heat without necessarily experiencing the highest level of cascading real-estate risk. The critical question is what happens when physical hazards interact with high exposure, hazard coupling, structural vulnerability, insurance-market stress, and limited recovery capacity.

The framework therefore evaluates five interacting dimensions:

Hazard Exposure × Hazard Coupling × Vulnerability × Insurance Stress × Recovery Deficit = Multiplicative Climate Risk

Each component is scored from 1 to 5, where:

1 = Low Risk

2 = Moderate-Low Risk

3 = Moderate Risk

4 = High Risk

5 = Extreme Risk

The resulting score is not a probability of loss or a conventional actuarial measure. It is a comparative systems-risk index designed to identify locations where multiple weaknesses can reinforce one another.

This distinction is critical.

A region with a score of 5 in one category but relatively low scores elsewhere may be less systemically exposed than a region scoring 4 or 5 across nearly every category.

The multiplicative framework captures that interaction:

Physical Hazard ↑ + Coupling ↑ + Vulnerability ↑ + Insurance Stress ↑ + Recovery Capacity ↓ → Cascading Real-Estate Risk ↑↑

The following ranking represents a comparative assessment of major U.S. real-estate risk regions, incorporating physical hazards and the increasingly important financial and institutional dimensions of climate exposure.


1. Gulf Coast & Southern Florida

The Compound-Compounding Zone

Hazard Exposure — 5/5

The Gulf Coast and southern Florida face some of the country’s most concentrated combinations of acute and chronic climate hazards.

These include:

Major Hurricanes + Storm Surge + Extreme Rainfall + Sea-Level Rise + Coastal Flooding + Extreme Heat

The region’s vulnerability is not based on any single hazard. It is the convergence of multiple hazards affecting a densely developed coastal real-estate market.

Hazard Coupling — 5/5

The defining characteristic is the interaction among hazards.

A tropical cyclone can simultaneously produce:

Storm Surge + Extreme Rainfall + River Flooding + High Winds

Sea-level rise increases the baseline upon which storm surge occurs, while extreme rainfall can overwhelm drainage systems at the same time that elevated coastal water levels restrict drainage.

The resulting process is:

Hurricane → Storm Surge + Extreme Rainfall → Drainage Impairment → Compound Flooding → Widespread Property Exposure

This is precisely the type of coupled hazard that can produce disproportionate economic consequences.

Vulnerability — 4/5

The region contains enormous quantities of residential, condominium, commercial, and infrastructure assets exposed to coastal and flood hazards.

Building age and construction standards vary substantially. Newer construction and mitigation measures can reduce vulnerability, while older structures and properties with inadequate flood, wind, or drainage protection remain substantially more exposed.

The critical issue is therefore not simply the age of the housing stock, but the mismatch between:

Long-Lived Real Estate Assets → Rapidly Changing Climate Risk

Insurance Stress — 5/5

Insurance is one of the most consequential real-estate constraints in the region.

The combination of hurricanes, storm surge, flooding, wind damage, sea-level rise, and repeated catastrophe losses places substantial pressure on insurance availability and affordability.

The resulting feedback is:

Climate Risk ↑ → Expected Losses ↑ → Insurance Premiums ↑ → Deductibles and Coverage Restrictions ↑ → Insurance Availability ↓

For homeowners, insurance costs directly increase the cost of ownership.

For commercial real estate, rising insurance expenses can reduce net operating income and asset values by increasing operating costs. The effect is particularly significant for multifamily, hospitality, retail, and other income-producing properties.

The insurance problem therefore extends beyond individual policies.

It becomes a real-estate valuation problem:

Insurance Cost ↑ → Cost of Ownership ↑ → Buyer Demand ↓ → Property Values ↓

Recovery Deficit — 4/5

The region’s substantial public and private capital resources provide recovery capacity, but the scale of the infrastructure challenge is enormous.

Long-term pressures include:

Flood-Control Systems + Pump Stations + Drainage Networks + Seawalls + Roads + Bridges + Utilities + Wastewater Systems

The concern is not whether these systems can recover from one disaster.

The concern is whether:

Repeated Damage > Available Recovery and Adaptation Capacity

If the frequency of major events increases faster than infrastructure can be repaired, upgraded, or relocated, a recovery deficit can develop.

Multiplicative Risk

5 × 5 × 4 × 5 × 4 = 2,000

Total Risk Factor: 2,000

The Gulf Coast and southern Florida therefore represent the most pronounced example of compound climate-real-estate risk in the framework.


2. Central & Southern California Wildland-Urban Interface

The Fire–Flood–Insurance Cascade Zone

Hazard Exposure — 4/5

The Central and Southern California WUI faces a combination of:

Wildfire + Extreme Heat + Drought + Water Stress + Extreme Rainfall

The exposure is particularly consequential because enormous quantities of residential real estate have been constructed adjacent to or within wildfire-prone landscapes.

Hazard Coupling — 5/5

The defining feedback is:

Drought → Vegetation Stress → Wildfire → Vegetation Loss → Soil Destabilization → Extreme Rainfall → Mudslides and Debris Flows

This is a classic sequential compound-risk mechanism.

Wildfire does not simply produce immediate property losses.

It can alter the landscape in ways that increase the consequences of subsequent precipitation events.

The result is:

Wildfire → Landscape Transformation → Increased Post-Fire Flood/Mudslide Risk

This creates a risk cascade extending beyond the original fire.

Vulnerability — 4/5

Residential development in steep terrain, narrow canyons, and areas with constrained evacuation routes can create substantial exposure.

Vulnerability also depends on construction standards, defensible space, vegetation management, access routes, and the ability of communities to recover rapidly after catastrophic fires.

Insurance Stress — 5/5

California represents one of the clearest examples of insurance-market stress becoming a real-estate problem.

The combination of catastrophic wildfire exposure, rapidly changing risk conditions, and repeated losses creates pressure on insurers to increase premiums, restrict coverage, reduce exposure, or withdraw from high-risk markets.

When private insurance becomes unavailable or unaffordable, property owners may be forced into residual or state-backed insurance mechanisms.

The resulting feedback is:

Wildfire Risk ↑ → Insurance Losses ↑ → Premiums ↑ → Coverage Restrictions ↑ → Private Insurance Availability ↓ → Residual-Market Dependence ↑

This creates a second real-estate feedback:

Insurance Availability ↓ → Financing Constraints ↑ → Buyer Pool ↓ → Property Liquidity ↓ → Property Values ↓

The insurance problem can therefore become a leading indicator of broader real-estate repricing.

Recovery Deficit — 4/5

Large wildfire events can produce extensive reconstruction requirements simultaneously.

The recovery system must contend with:

Destroyed Housing + Infrastructure Damage + Debris Removal + Labor Requirements + Construction Demand + Supply Constraints

The resulting competition for labor and materials can extend rebuilding timelines and increase reconstruction costs.

The longer recovery takes, the greater the potential for:

Recovery Delay → Business Interruption → Household Displacement → Reduced Local Economic Activity → Reduced Community Resilience

Multiplicative Risk

4 × 5 × 4 × 5 × 4 = 1,600

Total Risk Factor: 1,600

The California WUI therefore represents a particularly important example of insurance availability becoming a leading indicator of real-estate climate risk.


3. Coastal Texas

The Industrial and Commercial Risk Hub

Hazard Exposure — 4/5

Coastal Texas faces:

Hurricanes + Storm Surge + Extreme Rainfall + Flash Flooding + Extreme Heat + Grid Stress

The region’s importance is amplified by its enormous concentration of industrial, commercial, petrochemical, port, logistics, and residential assets.

Hazard Coupling — 4/5

The physical hazards can interact through several pathways.

For example:

Extreme Heat → Electricity Demand ↑ → Grid Stress ↑ → Power Disruption → Cooling/Industrial/Commercial Disruption

At the same time:

Hurricane → Wind + Surge + Rainfall → Flooding + Power Loss → Business Interruption

And:

Flooding + Heat + Power Loss → Mold + Water Damage + Equipment Failure + Building-System Damage

This produces a multi-system cascade rather than a single flood loss.

Vulnerability — 4/5

Coastal Texas contains enormous concentrations of development and infrastructure in flood-prone and low-lying areas.

Impervious surfaces can increase runoff, while dense development can make drainage problems more consequential.

The concentration of industrial and commercial assets also creates correlated economic risk.

A single major event can affect multiple businesses, transportation systems, suppliers, utilities, and customers simultaneously.

Insurance Stress — 4/5

Insurance costs and coverage limitations are becoming an increasingly important component of real-estate risk.

Wind, hail, hurricane, flood, and business-interruption exposures can produce substantial premiums and deductibles.

As insurers reassess catastrophe exposure, property owners can increasingly absorb a greater portion of the risk through:

Higher Deductibles + Coverage Restrictions + Increased Premiums + Greater Self-Insurance

For commercial real estate, increasing insurance expenses directly affect:

Operating Expenses ↑ → NOI ↓ → Capitalization Value ↓

This provides a direct financial transmission mechanism between climate risk and commercial property valuation.

Recovery Deficit — 3/5

Coastal Texas possesses substantial private capital and strong economic capacity, which can accelerate reconstruction.

However, public infrastructure and regional systems can take much longer to repair.

The result is a two-speed recovery:

Private Capital → Rapid Property Recovery

while:

Public Infrastructure → Slower System Recovery

This creates a temporary resilience gap.

Multiplicative Risk

4 × 4 × 4 × 4 × 3 = 768

Total Risk Factor: 768

Coastal Texas represents an important example of how high-value commercial real estate can convert physical climate exposure into large-scale correlated financial losses.


4. Mississippi River Delta & Inland Waterways

The Structural-Aging and Recovery-Deficit Zone

Hazard Exposure — 3/5

The Mississippi Delta and associated inland waterways face:

River Flooding + Extreme Rainfall + Severe Convective Storms + Subsidence + Coastal Flooding

The region’s raw hazard exposure is lower than some Gulf Coast locations, but the interaction of hazards with infrastructure and socioeconomic vulnerability dramatically increases systemic risk.

Hazard Coupling — 3/5

One important pathway is:

Upstream Extreme Rainfall → River Discharge ↑ → Downstream Flooding → Prolonged Inundation → Structural and Infrastructure Damage

In coastal portions of the Delta, this can interact with:

River Flooding + Storm Surge + Sea-Level Rise → Compound Inland/Coastal Flooding

The duration of inundation can be as important as peak water depth because prolonged water exposure can increase mold, structural deterioration, electrical damage, and infrastructure failure.

Vulnerability — 5/5

This region’s primary vulnerability is structural.

Risk is amplified by:

Aging Infrastructure + Levee Dependence + Aging Buildings + Economic Constraints + Limited Local Fiscal Capacity

The critical issue is not simply whether flood-control infrastructure exists.

It is whether that infrastructure can be maintained, upgraded, and replaced at the rate required under changing climate conditions.

Insurance Stress — 4/5

Flood insurance is an essential component of property financing in designated high-risk areas where federal requirements apply.

However, the availability and affordability of private flood coverage can vary substantially by location and risk profile.

Where private coverage is limited, property owners can become increasingly dependent on federal flood insurance and other residual mechanisms.

This creates another form of concentration risk:

Private Insurance Capacity ↓ → Public Backstop Dependence ↑

The problem becomes more acute when repeated losses increase premiums, deductibles, or coverage restrictions faster than property values and household incomes can absorb them.

Recovery Deficit — 5/5

This is the region’s defining weakness.

A major flood can produce:

Property Damage → Income Loss → Reduced Local Tax Revenue → Infrastructure Damage → Limited Local Recovery Capacity

Federal disaster assistance can be essential, but administrative processes, funding requirements, and reconstruction complexity can extend recovery timelines.

The resulting feedback can become:

Low Local Fiscal Capacity → Slow Recovery → Persistent Damage → Lower Property Values → Lower Tax Base → Even Lower Recovery Capacity

Multiplicative Risk

3 × 3 × 5 × 4 × 5 = 900

Total Risk Factor: 900

This produces an important result:

The Mississippi Delta scores lower than Coastal Texas in raw hazard exposure but higher in total multiplicative risk.

That is precisely why a multiplicative framework is useful.

A moderate physical hazard can produce extreme systemic risk when combined with high vulnerability and a severe recovery deficit.


5. Urban Northeast Corridor

The Legacy-Infrastructure and Urban-Flooding Zone

Hazard Exposure — 3/5

The urban Northeast faces:

Nor’easters + Extreme Rainfall + Tidal Flooding + Sea-Level Rise + Urban Flash Flooding

The region does not necessarily experience the most extreme individual climate hazards in the country.

Its risk derives from density, infrastructure age, and enormous concentrations of economic value.

Hazard Coupling — 4/5

A central pathway is:

Sea-Level Rise → Higher Coastal Baseline → Reduced Stormwater Drainage Capacity → Heavy Rainfall → Urban Flooding

The resulting flooding can affect:

Basements + Subways + Tunnels + Electrical Systems + Transportation Networks + Commercial Districts

This creates a particularly important urban cascade:

Extreme Rainfall → Stormwater Overload → Transit Disruption → Workforce Disruption → Business Interruption → Economic Loss

Vulnerability — 4/5

The region contains extraordinary quantities of legacy infrastructure and older real estate.

Many structures were designed under climate conditions substantially different from those now emerging.

Below-grade spaces can be especially vulnerable:

Basement Housing + Electrical Rooms + Subway Infrastructure + Underground Transportation

This makes the region highly sensitive to intense precipitation even when properties are not located directly adjacent to rivers or coastlines.

Insurance Stress — 3/5

Insurance remains more available than in the most stressed coastal and wildfire markets, but the trajectory remains important.

Increasing flood claims, basement losses, storm damage, and infrastructure disruption can gradually increase premiums and deductibles.

The principal concern is therefore not an immediate insurance-market collapse but gradual repricing of urban climate exposure.

The feedback is:

Urban Flood Risk ↑ → Claims ↑ → Insurance Costs ↑ → Cost of Ownership ↑ → Property-Value Pressure ↑

Recovery Deficit — 2/5

The Northeast possesses comparatively strong municipal tax bases, financial resources, infrastructure institutions, and access to federal resources.

This provides substantial recovery capacity.

However, the scale and age of infrastructure create long-term adaptation challenges.

The region’s primary weakness is therefore not immediate recovery capacity but the enormous cost of modernizing legacy systems before they become repeatedly overwhelmed.

Multiplicative Risk

3 × 4 × 4 × 3 × 2 = 288

Total Risk Factor: 288

The Urban Northeast demonstrates that high population density and high property values do not automatically produce the highest multiplicative risk.

Strong fiscal and institutional recovery capacity can substantially reduce systemic risk.


Real-Estate Climate Risk Comparison Matrix

The following matrix applies the five-factor multiplicative framework:

RegionHazard ExposureHazard CouplingVulnerabilityInsurance StressRecovery DeficitMultiplicative Risk
1. Gulf Coast & Southern Florida554542,000
2. California WUI454541,600
3. Mississippi River Delta & Inland Waterways33545900
4. Coastal Texas44443768
5. Urban Northeast Corridor34432288

Why the Ranking Matters

The ranking demonstrates why climate-driven real-estate risk cannot be measured solely by the severity of weather.

The Mississippi Delta provides the clearest example.

Its 3/5 hazard-exposure score is lower than Coastal Texas’s 4/5, yet its overall multiplicative score is higher:

Mississippi Delta → 900

Coastal Texas → 768

The difference arises from the interaction of:

High Vulnerability + High Insurance Stress + Severe Recovery Deficit

This is the essence of cascading risk.

A region does not need to have the most extreme weather to have the greatest systemic vulnerability.

It needs to have the most dangerous combination of interacting weaknesses.


The Central Insurance Feedback

Across the five regions, insurance functions as one of the primary transmission mechanisms connecting physical climate risk to real-estate values.

The feedback can be represented as:

Climate Risk ↑ → Expected Losses ↑ → Insurance Claims ↑ → Premiums ↑ → Deductibles ↑ → Coverage Restrictions ↑ → Insurance Availability ↓ → Cost of Ownership ↑ → Property Demand ↓ → Property Values ↓

Once property values begin declining, another feedback can emerge:

Property Values ↓ → Mortgage Collateral ↓ → Lending Risk ↑ → Financing Constraints ↑ → Buyer Pool ↓ → Property Liquidity ↓ → Property Values ↓

Insurance therefore does not merely compensate property owners after losses.

It can influence whether a property can be:

Owned → Financed → Sold → Developed → Maintained → Insured

This makes insurance availability and affordability a critical component of real-estate climate risk.


The Major Coupled Feedback Loops

1. Insurance–Property Value Feedback

Climate Risk ↑ → Insurance Losses ↑ → Premiums ↑ / Availability ↓ → Cost of Ownership ↑ → Buyer Demand ↓ → Property Values ↓


2. Property Value–Tax Base Feedback

Property Values ↓ → Tax Base ↓ → Municipal Revenue ↓ → Infrastructure Investment ↓ → Resilience ↓ → Flood Risk ↑ → Property Values ↓


3. Recovery-Deficit Feedback

Disaster Frequency ↑ → Recovery Window ↓ → Unresolved Damage ↑ → Vulnerability ↑ → Next-Event Losses ↑ → Recovery Window ↓


4. Insurance–Mortgage Feedback

Physical Risk ↑ → Insurance Stress ↑ → Coverage Constraints ↑ → Mortgage Risk ↑ → Lending Constraints ↑ → Buyer Pool ↓ → Property Values ↓


5. Commercial Real-Estate Feedback

For income-producing properties:

Climate Risk ↑ → Insurance + Maintenance + Adaptation Costs ↑ → Operating Expenses ↑ → NOI ↓ → Property Value ↓

This relationship is particularly important for multifamily, hospitality, retail, industrial, and other income-producing properties.


The Cascading Real-Estate Framework

The five regional examples reveal several recurring stages in the emerging climate-real-estate cascade:

Physical Hazard

Warming → Sea-Level Rise + Heavier Rainfall + Stronger/Slower Storms + Extreme Heat + Drought

Hazard Coupling

Multiple Hazards → Compound Events → Greater Physical Exposure

Property Damage

Compound Hazard → Structural Damage + Infrastructure Damage + Business Interruption

Insurance Stress

Losses ↑ → Premiums ↑ + Deductibles ↑ + Coverage Restrictions ↑ + Availability ↓

Property Repricing

Insurance Cost ↑ → Cost of Ownership ↑ → Buyer Demand ↓ → Property Values ↓

Financial Amplification

Property Values ↓ → Mortgage Risk ↑ + Investment ↓ + Liquidity ↓

Municipal Amplification

Property Values ↓ → Tax Base ↓ → Infrastructure Investment ↓

Resilience Erosion

Infrastructure Investment ↓ + Recovery Capacity ↓ → Vulnerability ↑

Cascading Risk

Vulnerability ↑ → Future Losses ↑ → Insurance Stress ↑ → Property Values ↓

The resulting closed-loop system is:

Climate Hazard → Physical Loss → Insurance Stress → Property-Value Decline → Investment Decline → Tax-Base Erosion → Infrastructure Deterioration → Recovery Deficit → Greater Vulnerability → Greater Future Loss


The Central Finding

The Multiplicative Climate Risk framework produces a fundamentally different understanding of climate-exposed real estate.

The highest-risk region is not necessarily the region with:

The Most Hurricanes

The Most Wildfires

The Most Rainfall

or

The Highest Sea-Level Rise

Instead, it is the region where multiple risk factors interact:

Hazard Exposure × Hazard Coupling × Vulnerability × Insurance Stress × Recovery Deficit

The resulting system can become self-reinforcing:

Climate Hazard → Insurance Stress → Property-Value Decline → Investment Decline → Tax-Base Erosion → Infrastructure Resilience Decline → Recovery Deficit → Greater Vulnerability → Greater Future Loss

This is the central transition from climate hazard to cascading real-estate risk.

The most consequential property-market question is therefore no longer simply:

Will this property flood, burn, or be damaged by extreme weather?

It is:

Can this property remain insurable, financeable, valuable, maintainable, and economically viable as climate hazards become more frequent and increasingly coupled?

That question shifts climate-risk analysis from the physical event itself to the long-term resilience of the economic system surrounding the property.

And that is where the greatest risks may emerge.

The weather creates the shock.
Coupled hazards amplify the shock.
Insurance translates the shock into financial cost.
Real estate capitalizes the cost into property values.
Weak recovery capacity allows the damage to accumulate.
And cascading feedbacks can turn a climate hazard into a real-estate crisis.

bookmark_borderClimate Change and Flood Insurance

In the 1990s, what was considered a 500-year flood was expected to occur, on average, once every five centuries. By the early 2000s, many of those same events were being reclassified as 100-year floods. By the 2020s, they increasingly resembled 10-year floods. Today, in some regions, comparable flood events are occurring every few years.

The flood itself did not change.

What changed was the climate system.

The Big Picture

Short-term stream gauge records can be heavily skewed by sampling variability, and it is absolutely true that local flood “return period” estimates can change significantly as more data are collected. That is basic hydrology.

But that is not the same as what is happening in the climate system.

We are not dealing with a single river gauge with a short record. We are dealing with thousands of independent observational datasets across independent physical domains—temperature, ocean heat content, atmospheric moisture, cryosphere mass balance, sea level rise, and precipitation extremes—all showing consistent directional change.

That is exactly why climate attribution studies and statistical detection work have been able to identify signals with high confidence across multiple decades and datasets.

On the policy side, agencies such as FEMA and others involved in risk modeling (including mortgage and insurance regulators) have updated flood maps, pricing assumptions, and risk frameworks over time. But that reflects evolving hazard conditions and improved modeling—not a refutation of climate-driven trends.

So the key distinction is this:

  • A local statistical revision in a limited dataset
  • Climate science is based on global, physically consistent, multi-variable observational convergence

They are not equivalent statistical problems.

Flood Insurance Policy

In the early 2000s, I met with representatives from FEMA and Fannie Mae. I went into that meeting assuming there was relatively little institutional movement toward aggressive long-term risk mitigation or structural adaptation.

I was pleasantly surprised.

At that time, FEMA had already begun shifting toward a more proactive risk-management framework, including elements of what is now often described as managed retreat in high-risk areas. There was a clear recognition that some locations face recurring or escalating flood exposure, and that long-term resilience cannot rely solely on repeated reconstruction in place.

A significant part of their effort was also focused on education—helping homeowners, lenders, and local governments understand how the U.S. flood insurance system actually works, including its limitations. Many people are still unaware that standard coverage is constrained by caps, exclusions, and policy limits that may not fully reflect total rebuilding costs, especially over the lifetime of a property.

The broader goal, as it was explained to me, was not just insurance pricing, but reducing systemic exposure over time through a combination of improved mapping, risk communication, and gradual migration away from the highest-risk zones where feasible.

bookmark_borderThe Climate Discount: Underestimating the Decline in Real Estate Values

Nonlinear Acceleration, Cascading Feedbacks, and the Compression of Climate Time

Daniel Brouse¹ and Sidd Mukherjee²
March 11, 2026

¹Independent Climate Researcher, Economist
²Physicist


Abstract

Recent observations across multiple climate indicators confirm that the impacts of global warming are accelerating at a nonlinear rate. We revisit the Nonlinear Acceleration Hypothesis, originally proposed in the early 1990s, which posits that climate impacts increase exponentially rather than linearly due to interacting feedback mechanisms within the Earth system.

By the early 2000s, multiple independent datasets showed evidence of accelerating change, including:

  • Sea-level rise (SLR)
  • Surface and tropospheric temperature trends
  • Greenland and Antarctic ice mass balance loss
  • Ocean heat content
  • Wildfire frequency and burned area
  • Hydrological extremes

Our analysis indicates that the doubling time of observable climate impacts—including extreme heat events, wildfire frequency, cryosphere mass loss, and coastal exposure—has declined from roughly 100 years in pre-industrial conditions to approximately 2–5 years by 2024.

While the physical climate system has received increasing scientific attention, the economic consequences of nonlinear climate acceleration remain widely underestimated. In particular, the interaction between rising flood risk, insurance market withdrawal, and mortgage availability is likely to trigger a systemic repricing of real estate assets in vulnerable regions.

This paper explores how accelerating climate impacts are compressing the time scale over which real estate markets adjust to climate risk, potentially resulting in rapid declines in property values across flood-prone regions.


1. Introduction

Climate change has traditionally been communicated as a gradual process, progressing roughly in proportion to greenhouse gas emissions. However, increasing evidence suggests that many climate processes exhibit nonlinear behavior, where relatively small changes trigger disproportionately large impacts.

The Earth’s climate system is a complex adaptive system governed by interacting physical, chemical, and biological processes. Such systems frequently exhibit:

  • reinforcing feedback loops
  • threshold behavior
  • abrupt transitions
  • chaotic dynamics

In the early 1990s we proposed the Nonlinear Acceleration Hypothesis, suggesting that climate impacts increase exponentially through reinforcing feedback mechanisms.

Over subsequent decades, research across climate science disciplines has increasingly supported the importance of nonlinear processes in climate dynamics.

In our previous work, “Underestimating the Speed of Climate Change,” we examined evidence confirming that:

  • climate impacts are accelerating exponentially
  • the doubling time of impacts is rapidly shrinking
  • coastal hazard exposure has been systematically underestimated
  • interacting feedback systems may be driving cascading tipping-point behavior

The present paper extends that framework to examine economic impacts, specifically the vulnerability of real estate markets to accelerating climate risk.


2. The Nonlinear Acceleration Hypothesis

The Nonlinear Acceleration Hypothesis states that climate impacts follow an exponential growth pattern:I(t)=I0ektI(t) = I_0 e^{kt}I(t)=I0​ekt

Where:

  • I(t)I(t)I(t) = magnitude of climate impact
  • I0I_0I0​ = baseline impact
  • kkk = acceleration constant
  • ttt = time

The doubling time of impacts can be expressed as:Td=ln⁡(2)kT_d = \frac{\ln(2)}{k}Td​=kln(2)​

Historical observations suggest that the acceleration constant kkk has increased over time, implying shorter doubling intervals.

Estimated Doubling Time Evolution

PeriodEstimated Doubling Time
Pre-industrial~100 years
~2000~10 years
~20242–5 years

At current acceleration rates, impacts could increase approximately:26=642^6 = 6426=64

fold within a decade.


3. Climate Risk and Real Estate Markets

Real estate markets are highly sensitive to perceived environmental risk, particularly flood risk.

Property value depends heavily on three interrelated factors:

  1. Insurance availability
  2. Mortgage eligibility
  3. Future habitability

Without insurance, lenders typically refuse to issue mortgages. Without mortgage financing, property liquidity collapses and market values fall sharply.

I began studying FEMA flood insurance, mortgage markets, and climate risk in the 1980s. In the early 2000s, I met with both FEMA and the Federal National Mortgage Association (Fannie Mae) to better understand institutional perspectives on climate risk.

At the time, the official position of many agencies assumed that flood risk could be addressed through localized adaptation measures such as levees and floodplain management.

However, over time federal policy gradually shifted from:

Adaptation → Mitigation → Managed Retreat

FEMA has increasingly acknowledged that rebuilding in highly vulnerable areas may be economically unsustainable.


4. Insurance Market Retreat

The first signs of climate-driven market adjustment appeared in insurance markets.

Timeline of Insurance Market Changes

2010s – Private insurers began raising premiums in high-risk regions, particularly in coastal and wildfire-prone states.

2020s – Many states implemented regulatory restrictions on rate increases. In response, insurance companies began withdrawing from high-risk markets rather than raising prices.

2025 – Florida effectively socialized large portions of its property insurance system, with the state and taxpayers becoming the largest providers of hazard insurance.

Similar patterns emerged in:

  • Louisiana
  • Texas
  • California

As private insurers withdraw, risk is increasingly transferred to public balance sheets, creating growing fiscal exposure.


5. The Doubling Time of Floods

Climate-driven changes in precipitation patterns have significantly increased flood frequency.

Historically, flood risk classifications were based on statistical models assuming stationary climate conditions.

Observed changes suggest dramatic compression in recurrence intervals.

Changing Flood Recurrence Intervals

Historical LabelApproximate Modern Frequency
1,000-year flood~500 years (1990s)
500-year flood~100 years (2010)
100-year flood~10 years (2020)
100-year flood2–5 years (2025)

In practical terms, floods once considered extremely rare are now occurring within a single generation.


6. The 2025 Flash Flood Cascade

The increasing instability of the hydrological cycle was dramatically illustrated during July 2025.

Within a ten-day period, hundreds of flash floods struck communities across the United States, affecting:

  • Texas
  • New Mexico
  • North Carolina
  • Florida
  • Illinois
  • Pennsylvania
  • Delaware
  • New Jersey
  • Maryland
  • Virginia
  • Iowa

At least five “1-in-1,000-year” rainfall events occurred during this short period.

Meanwhile, several states—including Pennsylvania, Delaware, New Jersey, Maryland, Virginia, and Iowa—reported multiple “500-year” floods as extreme rainfall overwhelmed infrastructure.

These events illustrate the collapse of traditional flood-frequency assumptions.


7. The Real Estate Repricing Mechanism

Real estate values depend on long-term expectations of safety and insurability.

When climate risk increases faster than markets can adjust, property prices may remain temporarily inflated.

However, once insurance becomes unavailable or unaffordable, prices can adjust suddenly and sharply.

This process can be described as a climate risk discount:V=R(r+c)V = \frac{R}{(r + c)}V=(r+c)R​

Where:

  • VV = property value
  • RR = expected rental value
  • rr = discount rate
  • cc = climate risk premium

As perceived climate risk ccc increases, property values decline.

When insurance becomes unavailable, the effective climate risk premium may increase dramatically, producing rapid price corrections.


8. Compression of Climate Time

The interaction between accelerating climate impacts and slow-moving financial institutions creates temporal compression.

Climate risks accelerate while economic institutions—insurance markets, mortgage systems, and regulatory frameworks—adapt slowly.

This mismatch creates conditions in which:

  • risk accumulates gradually
  • recognition of risk occurs suddenly
  • market adjustment becomes rapid

The result is a pattern of apparent stability followed by abrupt economic transition.


9. Cascading Economic Feedbacks

A climate-driven decline in real estate values can initiate secondary financial cascades, amplifying economic vulnerability across multiple sectors. Potential systemic risks include:

  • Declining municipal tax bases, reducing funding for essential services and infrastructure
  • Shortfalls in infrastructure investment, limiting the ability to maintain or upgrade flood defenses and public works
  • Increased mortgage default risk, as property values fall below outstanding loan balances
  • Regional population migration, which can destabilize local economies and labor markets
  • Collapse or withdrawal of insurance markets, shifting risk to public balance sheets
  • Credit market stress, as lenders and investors reassess exposure to climate-vulnerable assets

These interacting and interrelated feedbacks suggest that climate impacts can propagate rapidly through the financial system, converting localized property risk into widespread cascading economic instability, rather than producing solely environmental damage.


10. The Climate Minsky Moment

Financial systems often remain stable until risk perceptions suddenly shift. Economist Hyman Minsky described this phenomenon as a “Minsky Moment,” when asset prices collapse following a rapid reassessment of risk.

Climate risk may produce a similar phenomenon in real estate markets.

For decades, housing markets have priced coastal and floodplain property under the assumption that climate risks would remain relatively stable or could be managed through incremental adaptation.

However, the Nonlinear Acceleration Hypothesis suggests that this assumption is increasingly invalid.

When risk perceptions suddenly adjust to accelerating climate impacts, markets may experience a Climate Minsky Moment, characterized by:

  • sudden withdrawal of private insurance
  • rapid repricing of property risk
  • mortgage market contraction
  • abrupt declines in property values

Unlike traditional financial bubbles, the underlying driver is not speculative excess but rapidly changing environmental risk conditions.


11. Trillions of Dollars of Exposure

The scale of potential real estate exposure is enormous.

In the United States alone, trillions of dollars in residential property are located in regions vulnerable to sea-level rise, storm surge, or floodplain expansion.

Recent climate risk analyses estimate that over $1–3 trillion in coastal real estate assets may face chronic flooding risk within this century.

Globally, exposure is far larger.

Major metropolitan regions facing increasing flood risk include:

  • Miami
  • New York
  • Houston
  • New Orleans
  • Jakarta
  • Shanghai
  • Mumbai
  • Bangkok

Many of these cities represent critical nodes in global financial systems.


12. Cascading Financial Feedbacks

Declining property values may trigger broader economic feedback loops:

Municipal Finance Instability

Local governments rely heavily on property tax revenue. Large declines in property values could reduce tax bases, limiting funds available for infrastructure and disaster response.

Mortgage Market Stress

Banks and investors holding mortgage-backed securities could face increased default risk as property values fall below outstanding loan balances.

Insurance System Strain

As private insurers withdraw, governments may be forced to assume increasing financial liability through state-backed insurance programs.

Climate Migration

Declining property values and repeated disasters may accelerate population movement away from vulnerable regions, amplifying regional economic disparities.


13. The Coming $10 Trillion Coastal Repricing

Building on the previous sections, the magnitude of potential repricing is unprecedented.

Preliminary analysis of U.S. coastal real estate suggests:

  • $8–10 trillion in residential and commercial property could be reclassified as uninsurable or high-risk within the next two decades if current climate acceleration trends persist.
  • Global exposure is likely several times larger, concentrated in megacities and financial hubs.

Mechanisms driving this repricing include:

  1. Exponential acceleration of climate impacts (floods, storm surge, and hurricanes)
  2. Insurance withdrawal and regulatory constraints
  3. Mortgage market adjustment as lenders refuse high-risk loans
  4. Local economic decline from falling tax revenue and infrastructure strain

This scenario represents a systemic financial risk, not merely a local market disruption. Trillions in assets may face rapid downward adjustment, triggering secondary economic effects globally.


14. Conclusion

Climate change impacts are accelerating through interacting feedback loops and nonlinear dynamics.

The doubling time of observable climate impacts may now be only a few years, representing a profound compression of environmental time scales.

While the physical consequences of climate change are increasingly documented, the economic implications—particularly for real estate markets—remain widely underestimated.

The interaction between accelerating flood risk, insurance withdrawal, and mortgage market constraints is triggering a rapid declines in climate-vulnerable property values.

This process may culminate in a Climate Minsky Moment, where long-accumulating environmental risk is suddenly reflected in asset prices.

Understanding the economic consequences of climate change therefore requires recognizing that the most significant disruptions may arise not only from the magnitude of climate impacts, but from the speed at which environmental change forces financial systems to adapt.


References

  • IPCC (2023). Sixth Assessment Report: Climate Change 2023.
  • Hansen, J. et al. (2016). Ice melt, sea level rise, and superstorms. Atmospheric Chemistry and Physics.
  • Nerem, R. et al. (2018). Climate-change-driven accelerated sea-level rise detected in satellite altimeter era. PNAS.
  • Sweet, W. et al. (2022). Global and Regional Sea Level Rise Scenarios. NOAA Technical Report.
  • Seeger, K., & Minderhoud, P. S. J. (2026). Sea level much higher than assumed in most coastal hazard assessments. Nature. https://doi.org/10.1038/s41586-026-10196-1
  • Lenton, T. et al. (2019). Climate tipping points — too risky to bet against. Nature.
  • Minsky, H. P. (1986). Stabilizing an Unstable Economy. Yale University Press.

* Our probabilistic, ensemble-based climate model — which incorporates complex socio-economic and ecological feedback loops within a dynamic, nonlinear system — projects that global temperatures are becoming unsustainable this century. This far exceeds earlier estimates of a 4°C rise over the next thousand years, highlighting a dramatic acceleration in global warming. We are now entering a phase of compound, cascading collapse, where climate, ecological, and societal systems destabilize through interlinked, self-reinforcing feedback loops.

Tipping points and feedback loops drive the acceleration of climate change. When one tipping point is toppled and triggers others, the cascading collapse is known as the Domino Effect.

The Human Induced Climate Change Experiment

bookmark_borderFlorida at the Front Line: How Accelerating Sea-Level Rise Is Reshaping the State in Real Time

by Daniel Brouse
December 5, 2025

Florida faces a long list of climate-driven threats — extreme heat, stronger hurricanes, toxic algal blooms, and collapsing insurance markets — but accelerating sea-level rise (SLR) sits at the center of nearly all of them. Although the current rise of a few millimeters per year may sound trivial, the reality is anything but. Sea-level rise is no longer linear; it is entering a phase of nonlinear, exponential acceleration, and Florida is already experiencing the consequences.

1. Sea-Level Acceleration: From Millimeters to Centimeters

Sea level has been rising for a century, but what matters most is the rate of change. Historically, it took roughly a century for the rate to jump from ~3 mm/year to ~6 mm/year. Now, that doubling has happened in just eight years.

This exponential acceleration is driven by:

  • Rapid ice-sheet melt in Greenland and Antarctica
  • Thermal expansion of superheated oceans
  • Slowing ocean circulation (including the AMOC)
  • Increased land subsidence in coastal regions

If current trends hold — and most projections underestimate nonlinear behavior — Florida could see centimeters per year within the next decade and experience multiple surge-years this century where sea levels jump over a foot in a single year due to ice-sheet pulses and ocean heat anomalies.

This is not a distant scenario. It is unfolding now.

2. Everyday Flooding: Surge Without a Storm

Storm surge is no longer just a hurricane problem. Florida now experiences regular tidal flooding with no storms at all, as “sunny-day floods” push seawater into streets, yards, and infrastructure simply because the baseline sea level is higher.

Consequences include:

• Infrastructure decay

Saltwater corrodes electrical systems, sewer lines, bridges, roads, pumps, and underground cables. Critical infrastructure in Miami-Dade, Tampa Bay, the Keys, and Jacksonville is suffering chronic damage.

• Soil and ecosystem collapse

Saltwater intrusion destroys soil structure, kills vegetation, and converts freshwater wetlands into ghost forests.

• Drinking-water contamination

Saltwater is infiltrating freshwater aquifers — especially the Biscayne Aquifer — which supply millions of Floridians with drinking water.

One striking example of the water crisis:

“VERY RARE”: Tampa is currently purchasing about 10 million gallons of water per day — something officials say almost never happens this early in the year.
Saltwater intrusion and low river flows are driving emergency purchases months ahead of schedule.

3. Insurance Market Collapse: Climate as an Economic Wrecking Ball

Extreme saltwater events, chronic flooding, stronger hurricanes, and skyrocketing property risk have triggered a full-scale insurance meltdown in Florida.

The results:

  • Dozens of private insurers have left the state
  • Those remaining have raised premiums by 50–200%
  • Auto insurance rates are rising due to saltwater-related electronics failures and flood losses
  • Citizens Property Insurance — the taxpayer-funded state insurer of last resort — is now the largest insurer in Florida

This means the financial burden is shifting directly onto Florida taxpayers, even if they live nowhere near the coast.

4. The Bottom Line

Florida’s sea-level rise is not “millimeters that don’t matter.”
It is:

  • Accelerating at a historically unprecedented rate
  • Flooding infrastructure even on sunny days
  • Salting soils and destroying ecosystems
  • Contaminating drinking water
  • Collapsing the private insurance market
  • Forcing taxpayers to absorb billions in risk

Florida is already living in the future the rest of the country is headed toward. The question is no longer if sea-level rise will reshape the state, but how fast and how prepared communities will be for what’s coming next.

* Our probabilistic, ensemble-based climate model — which incorporates complex socio-economic and ecological feedback loops within a dynamic, nonlinear system — projects that global temperatures are becoming unsustainable this century. This far exceeds earlier estimates of a 4°C rise over the next thousand years, highlighting a dramatic acceleration in global warming. We are now entering a phase of compound, cascading collapse, where climate, ecological, and societal systems destabilize through interlinked, self-reinforcing feedback loops.

What Can I Do?
The single most important action you can take to help address the climate crisis is simple: stop burning fossil fuels. There are numerous actions you can take to contribute to saving the planet. Each person bears the responsibility to minimize pollution, discontinue the use of fossil fuels, reduce consumption, and foster a culture of love and care. The Butterfly Effect illustrates that a small change in one area can lead to significant alterations in conditions anywhere on the globe. Hence, the frequently heard statement that a fluttering butterfly in China can cause a hurricane in the Atlantic. Be a butterfly and affect the world.

Tipping points and feedback loops drive the acceleration of climate change. When one tipping point is breached and triggers others, the cascading collapse is known as the Domino Effect.

The Human Induced Climate Change Experiment

bookmark_borderClimate-Accelerated Flooding in Delaware and Chester Counties: The Brandywine Creek Threat

by Daniel Brouse
December 2, 2025

Mapping by the U.S. Geological Survey (USGS) highlights Brandywine Creek, the Christina Basin, and multiple watersheds across Delaware County as major flood-risk zones—an assessment that aligns with the region’s accelerating exposure to extreme weather. The USGS flood inundation maps show that the Brandywine is especially prone to rapid rises in water level during heavy rainfall events, often swelling far beyond its banks and inundating nearby neighborhoods, roadways, and infrastructure.

Several factors compound this vulnerability:

• Increased rainfall intensity
Climate data show that the Mid-Atlantic is experiencing more frequent high-intensity rainstorms, with total precipitation delivered in fewer, more extreme bursts. This overwhelms the creek’s capacity and turns tributaries into fast-moving flood channels.

• Watershed geometry and urbanization
Much of Delaware County lies in narrow river valleys with steep topography, which funnels rainfall directly into creeks and accelerates runoff. As urban development expands—adding impervious surfaces such as asphalt and concrete—the watershed loses its natural ability to absorb water, amplifying flash-flood potential.

• Aging and undersized infrastructure
Stormwater systems in many of these communities were not designed for 21st-century rainfall extremes. As a result, drainage networks back up quickly, turning what would once have been manageable floods into dangerous, property-damaging events.

• Climate-driven amplification
Warming oceans and atmospheric moisture increases—roughly 7% more water vapor available in the atmosphere per 1°C of global warming—supercharge storms in the region. This means each storm has the potential to deliver far more rain in a shorter timeframe, a trend consistent with the catastrophic floods the Brandywine watershed has experienced in recent years (e.g., the remnants of Hurricane Ida).

As a result, Delaware and Chester Counties are now among the fastest-escalating inland flood zones in the Mid-Atlantic, with climate-driven rainfall extremes transforming what were once episodic flood events into recurrent, high-impact disasters. Homes, businesses, schools, roadways, critical utilities, and regional transportation corridors along Brandywine Creek, Chester Creek, Darby Creek, and their tributaries face increasing year-over-year risk as the hydrologic regime becomes more volatile.

Chester County: Critical Infrastructure at High Risk

In Chester County, vulnerability extends well beyond residential flooding. The county’s wastewater system is centrally dependent on the Brandywine Creek, meaning multiple municipal sewage treatment facilities sit directly within high-risk floodplains. These facilities are increasingly exposed to:

  • Overbank flooding that can overwhelm treatment capacity
  • Structural inundation leading to electrical and pump failures
  • Raw sewage releases into the Brandywine and downstream into Wilmington’s water supply
  • Loss of operational access for emergency crews during severe flood stages

A major breach or system failure would trigger cascading public-health hazards, contaminate drinking water infrastructure, and disrupt wastewater services for tens of thousands of residents.

Additionally, stormwater basins, dams, aging bridges, and low-lying roadways—many built decades before modern flood-risk standards—are failing more frequently under record rainfall. The increasing intensity of flash-flood events threatens life-safety response times, evacuation routes, and continuity of essential services.

Delaware County: Industrial Legacy + Rising Water = Compounding Hazard

In Delaware County, the risk is even more severe due to the region’s industrialized, low-lying riverfront, much of which was historically built on wetlands, marshlands, and filled swamp soils that were never engineered to withstand modern hydrologic extremes.

Along the Delaware River and lower creek systems, the county hosts:

  • Petroleum refineries and former refinery complexes
  • Bulk fuel storage farms and transfer terminals
  • Chemical manufacturing sites
  • Rail corridors carrying hazardous materials
  • Natural gas infrastructure and distribution hubs
  • Superfund and brownfield sites with residual contaminants in soil and groundwater

As climate-amplified flooding intensifies:

  • Rising groundwater mobilizes petroleum residues, solvents, and heavy metals trapped in fill soils.
  • Floodwaters can inundate storage tanks, pipelines, rail lines, and industrial yards, increasing the risk of spills or chemical releases.
  • Power outages combined with inundation threaten refinery pump systems, tank farm containment walls, and emergency shutoff controls.
  • Flood-driven erosion can undermine pipelines and buried utility conduits, increasing explosion or leak risk.

This combination of subsiding land, sea-level rise, industrial contamination, and extreme rainfall places Delaware County in a uniquely dangerous situation: a region where climate-accelerated flooding threatens not just property and infrastructure, but public health, the regional economy, and environmental stability.

USGS and NOAA both warn that without aggressive climate mitigation and local adaptation—such as updated floodplain zoning, expanded stormwater capacity, and restoration of natural wetlands—the region’s flood severity will continue to worsen as climate change accelerates.

* Our probabilistic, ensemble-based climate model — which incorporates complex socio-economic and ecological feedback loops within a dynamic, nonlinear system — projects that global temperatures are becoming unsustainable this century. This far exceeds earlier estimates of a 4°C rise over the next thousand years, highlighting a dramatic acceleration in global warming. We are now entering a phase of compound, cascading collapse, where climate, ecological, and societal systems destabilize through interlinked, self-reinforcing feedback loops.

What Can I Do?
The single most important action you can take to help address the climate crisis is simple: stop burning fossil fuels. There are numerous actions you can take to contribute to saving the planet. Each person bears the responsibility to minimize pollution, discontinue the use of fossil fuels, reduce consumption, and foster a culture of love and care. The Butterfly Effect illustrates that a small change in one area can lead to significant alterations in conditions anywhere on the globe. Hence, the frequently heard statement that a fluttering butterfly in China can cause a hurricane in the Atlantic. Be a butterfly and affect the world.

Tipping points and feedback loops drive the acceleration of climate change. When one tipping point is breached and triggers others, the cascading collapse is known as the Domino Effect.

The Human Induced Climate Change Experiment

bookmark_borderFlooding at Coastal Sites That Use and Produce Hazardous Substances

Sea level rise and flooding of hazardous sites in marginalized communities across the United States
Published in Nature / 20 November 2025

Sea level rise (SLR) increases the risk of flooding at coastal sites that use and produce hazardous substances. We assess whether socially marginalized populations in the United States are more likely to be impacted by projected SLR-related flooding of hazardous sites that could result in contaminant releases. We identify 5500 facilities at risk of a 1-in-100-year flood event by 2100 under a scenario of continued high greenhouse gas emissions, including coastal power plants, sewage treatment facilities, fossil fuel infrastructure, industrial facilities, and formerly used defense sites. Seven states (Louisiana, Florida, New Jersey, Texas, California, New York, and Massachusetts) account for nearly 80% of projected at-risk facilities. Controlling for population density and county, a one standard deviation increase in the proportion of linguistically isolated households, neighborhood residents identifying as Hispanic, households with incomes below twice the federal poverty line, households without a vehicle, non-voters, and renters is associated with 19-41% higher likelihood of having a site at risk of SLR-related flooding within 1 kilometer.

Flooding at Coastal Sites That Use and Produce Hazardous Substances

Flooding at Coastal Sites That Use and Produce Hazardous Substances