bookmark_borderAntarctic Ice Shelves Shrink at Alarming Rate

“Scientists track ‘alarming’ melt in Antarctic ice shelves”
“Forty percent of Antarctica’s ice shelves are shrinking, worrying scientists”

“We expected most ice shelves to go through cycles of rapid, but short-lived shrinking, then to regrow slowly. Instead, we see that almost half of them are shrinking with no sign of recovery,” said lead author Benjamin Davison, research fellow at the University of Leeds.

“Acceleration of glaciers due to ice shelf deterioration has added about six millimetres to global sea level since the start of the study period,” said Davison. “The ocean absorbs a lot of atmospheric heat and carbon and the Southern Ocean surrounding Antarctica is the largest contributor to that, so it’s a hugely important regulator of global climate.”

“We are seeing a steady attrition due to melting and calving… This is further evidence that Antarctica is changing because the climate is warming,” Anna Hogg, a University of Leeds professor who co-authored the study, said.

The study Annual mass budget of Antarctic ice shelves from 1997 to 2021 concludes:
We show that Antarctic ice shelves have exported 67,000 ± 3200 Gt of freshwater to the Southern Ocean from 1997 to 2021, of which solid ice (calving) provided 60% and which has been fairly constant on annual timescales since 1997 other than spikes in solid ice export from large calving events. These spatially and temporally resolved freshwater flux estimates could be used to inform modeling investigations seeking to constrain any emerging impacts of Antarctic freshwater export on Southern Ocean circulation, iogeochemical cycling, and ecological productivity, compared to other observationally constrained climate forcings, such as changes in sea ice extent and formation rates.

Building on previous studies (7, 45), we show that many Antarctic ice shelves deteriorated significantly from 1997 to 2021 and that the vast majority of those have significant mass loss trends. Pan-Antarctic ice shelf mass decreased overall by 7500 ± 1500 Gt during the 1997–2021 period due to both terminus retreat (6200 ± 700 Gt) and basal melt–induced thinning (4480 ± 1420 Gt), which were partially offset by increases in grounding line discharge (1770 ± 870 Gt), SMB (340 ± 90 Gt), and grounding line retreat (1070 ± 170 Gt). Ice shelf mass loss was regionally concentrated along the Antarctic Peninsula, the Amundsen Sea, and Bellingshausen Sea coastlines in West Antarctica, and in Wilkes Land and Victoria Land in East Antarctica. Pan-Antarctic ice shelf mass has increased since 2002 due to the steady advance of a small number of large ice shelves, but this growth masks significant and sustained reductions in the mass of many Antarctic ice shelves. Basal melt–induced thinning was the dominant mass loss term for a slight majority (52 to 73%) of ice shelves that lost mass. Both basal melt–induced thinning and retreat were significantly positively correlated with grounding line discharge change at many ice shelves, but there was a wide range in the strength and form of the relationship between ice shelves. These new observations provide a more detailed picture of the health of Antarctic ice shelves and drivers of ice shelf mass change than was previously available and highlight the wide-ranging relationships between ice shelf mass change and grounding line discharge change.

Also see:

Climate Change: Rate of Acceleration Brouse and Mukherjee (2023)

Sea-level Rise Mukherjee and Brouse (2022 and 2023)

Climate Change: How Long Is “Ever”? Brouse (2023)
bookmark_border10% of Swiss Glaciers Melt

* As thawing accelerates, Swiss glaciers lost 10% of their volume in the past 2 years
* One glacier had to stop being measured because it disappeared
* The thaw is irreversible
* Much of Europe’s drinking water comes from the glaciers

“The acceleration is dramatic, with as much ice being lost in only two years as was the case between 1960 and 1990. The two extreme consecutive years have led to glacier tongues collapsing and the disappearance of many smaller glaciers,” the Swiss Academy of Sciences said.

The AP reported:
Swiss meteorologists reported in August that the zero-degree Celsius level — the altitude where water freezes — had risen to its highest level ever recorded, at nearly 5,300 meters (17,400 feet), which means that all the Swiss Alpine peaks faced temperatures above freezing.

Matthias Huss, head of the GLAMOS glacier monitoring center, said, “Glaciers are the ambassadors of climate change. They make it very clear what is happening out there because they respond in a very sensitive way to warming temperatures. The study underlines once again that there is big urgency to act now if you want to stabilize (the) climate, and if you want to save at least some of the glaciers.”

“And once we have destabilized ice sheets, there will be no stable coastline for centuries. I repeat: There will be no stable coastline for centuries. I apologize to the children,” said Sidd Mukherjee in the paper Longthaw.

Also see:

Climate Change: Rate of Acceleration Brouse and Mukherjee (2023)

Sea-level Rise Mukherjee and Brouse (2022 and 2023)

Climate Change: How Long Is “Ever”? Brouse (2023)
bookmark_borderCalifornia Homeowners Insurance Consider Climate Change Prices

California use to only allow a max of 7% increase a year on homeowners insurance… and only base premiums on past payouts on a property. Not anymore.

“California will let insurance companies consider climate change when setting their prices, the state’s chief regulator announced Thursday, a move aimed at preventing insurers from fleeing the state over fears of massive losses from wildfires and other natural disasters. The rule change could mean higher rates for homeowners who are already seeing dramatic increases. Eight insurance companies doing business in California have requested rate increases of at least 20% or higher this year, according to the California Department of Insurance,” AP news reported.

“Modernizing our insurance market is not going to be easy or happen overnight. We are in really unchartered territory and we must make difficult choices when the world is changing rapidly.” California Insurance Commissioner Ricardo Lara said.

“Insurers have advanced a very powerful argument that the past is not as good a predictor of the future as it used to be,” said Amy Bach, executive director of United Policyholders. “I think the (Insurance) department did what it needed to do to try to restore a viable market. We don’t have a viable market right now in this state in a lot of areas.”

Florida and Louisiana already have a homeowners insurance crisis with companies fleeing the states. The 9th National Risk Assessment for Homeowners Insurance found 1/4 of all homes in the nation are underpriced for climate risk insurance.

More articles on Flood Insurance, Rising Sea Levels and Global Warming.

bookmark_borderClimate Change: Insurance Risk

The 9th National Risk Assessment for Homeowners Insurance found climate risks place 39 million U.S. homes at risk of losing their insurance. “Sound pricing is going to make it unaffordable to live in certain places as climate impacts emerge.”

“There’s this climate insurance bubble out there,” said Jeremy Porter, the head of climate implications at First Street and a contributor to the report. “And you can quantify it.”

“There’s no education to the public of what’s going on and where the risk is,” said Porter, explaining that most insurance models are proprietary. Even the Federal Emergency Management Agency (FEMA) doesn’t make flood insurance pricing available to the public. Homeowners must obtain coverage through a private insurance broker for a quote.

Wildfires are the fastest growing natural disaster risk. According to the report, “It’s not just wildfires – pressure on flood and wind insurance is increasing, too.”

Porter went on to say, “You don’t want someone to live in a place that always burns. They don”t belong there. We’re subsidizing people to live in harm’s way. Large numbers of people will need to be relocated away from areas that will be uninsurable. There is a reckoning on the horizon and it’s not pretty.”

Flow Speeds

The burning of fossil fuels and other human released emissions have impacted momentum’s impact. A warmer atmosphere can hold more moisture. Warmer air allows for the creation of more massive raindrops. Warmer ocean temperatures create stronger hurricanes. Hail and tornadoes form in strong thunderstorm clouds with intense updrafts, high liquid-water content, and large water droplets.

Sidd added: It’s worse than that. Wind and water flow forces scale as the square of velocity, so as flow speeds increase (say due to more intense heating or heavier rain) the damage scales as the square of the velocity.

So a twenty mile an hour wind exerts four times as much force as a ten mile an hour wind. And a forty mile an hour wind exerts sixteen times as much force as a ten mile an hour wind. A wind of fifty miles an hour exerts twenty five times and a wind of sixty miles an hour exerts thirty six times as much force as one of ten miles an hour. Then you have the density term. Water is about eight hundred times denser than air, So the force exerted by a ten mile an hour flow of water is eight hundred times that of a ten mile an hour wind. So as flow velocities go up due to climate change, force and damage scale as square of the velocities. What is not clear is how much these velocities increase with climate change. But in a sense we are seeing this already as, for example, flood and sewage systems succumb and hillsides fall down, and so on.

Climate change’s influence on wind and water flow forces caused more severe damage and deaths. The Maui wildfire of August 2023 is an example. What would have been a fairly routine wildfire was fanned out-of-control by hurricane force winds. One headline read, “Maui fires: Hawaii blazes fanned by Hurricane Dora”. Another headline read, “Hawaii wildfires kill as ‘apocalypse’ hits Maui island”. The New York Times reported, “Gov. Josh Green of Hawaii said on Thursday that the devastating wildfires that swept through western Maui and killed at least 55 people, and possibly many more, were ‘likely the largest natural disaster in Hawaii state history.'”

Both wind and water flow forces contributed to the devastation. Hurricane Dora was at least 500 miles from Hawaii yet the wind forces impacted the fire in Maui. The winds were so strong that before the fire reached Lahaina extremely hot air blew over the town. The streets were so hot they burnt people’s feet trying to flee. The surface of everything became hot. Even after people jumped into the ocean, they said the debris in the water was too hot to float on. Almost all the boats in the harbor burned.

The blast of hot air over Lahaina created the conditions for a flashpoint. A flashpoint is the temperature at which a particular organic compound gives off sufficient vapor to ignite in air. The entire town ignited so quickly that warning sirens could not be activated and people did not have time to escape.

In an unexpected twist, water flow forces also contributed to the chaos. How could water flow add to the fire emergency conditions? When people fled the heat and fire, they jumped into the sea. ABC news reported: Shawn Dougherty, of Lahaina, was among the hundreds of residents forced to flee the resort city when the wildfire began engulfing their homes.

Like others, Dougherty said his only means of survival was to jump into the ocean with his girlfriend, but while some found safety in nearby jetties, the rocks and coral tore up Dougherty’s body.

“At one point, it seemed like I might drown,” he told ABC News. “{I’m a good swimmer, but the water was just really rough because of the wind and the turbulence.”

Norway Floods 2023

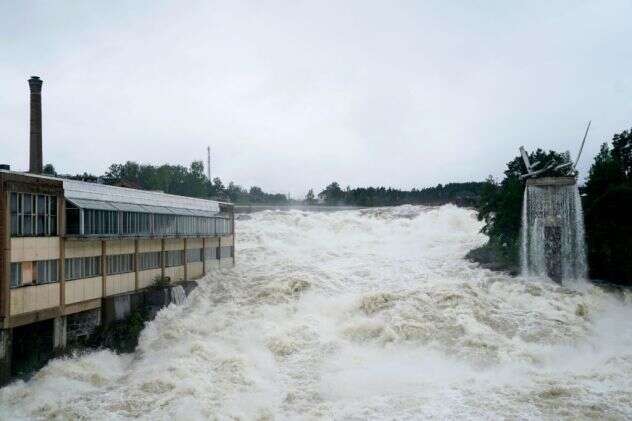
Also in August of 2023, climate change’s influence on water flow forces caused more severe damage and deaths. AccuWeather reported, “Dam bursts open as deadly flooding washes away homes in Norway. Torrents of water gushed through multiple towns across Norway and landslides cascaded down mountainsides after a deluge drenched Norway.”

Summary

By increasing the energy in the system, humans have increased flow volumes, masses and velocities leading to increased damage (and deaths.)

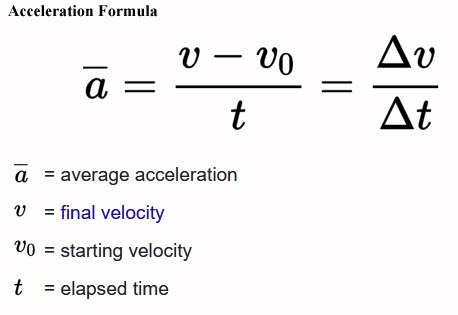
Newton’s second law: F = m * a
F = force
m = mass of an object
a = acceleration

Acceleration Formula

ALSO SEE
Climate Change: Rate of Acceleration
By 2020, there was enough data to see the “doubling period” of some anthropogenic climate affects had gone from 100 years to 10 years. For instance the rate of sea level rise has gone from about 1.5 millimeters per year to over 3 millimeters. We expect to see the doubling period to continue to shrink raising the possibility of sea levels rising a foot/year by 2050.

Tipping points and feedback loops are parts of an equation that determine the rate of acceleration in climate change.

Climate Change: The End of Times

More articles on Flood Insurance, Rising Sea Levels and Global Warming.

bookmark_borderInsurance, and the Lack Thereof

The Washington Post reported, “Home insurers cut natural disasters from policies as climate risks grow“.

“Allstate, American Family, Nationwide, Erie Insurance Group and Berkshire Hathaway — have told regulators that extreme weather patterns caused by climate change have led them to stop writing coverages in some regions, exclude protections from various weather events and raise monthly premiums and deductibles.”

“they will cut out damage caused by hurricanes, wind and hail from policies underwriting property along coastlines and in wildfire country”

“places once considered safe from natural catastrophes could lose crucial insurance protections while their natural disaster exposure expands or intensifies ”

“Allstate said its climate risk mitigation strategy would include “limiting new [auto and property] business … in areas most exposed to hurricanes” and “implementing tropical cyclone and/or wind/hail deductibles or exclusions where appropriate.””

“Nationwide said it no longer underwrites coverage for “properties within a certain distance to the coastline” because of hurricane potential.”

“There’s no place to hide from these severe natural disasters”

“a policy in a region afflicted by hurricanes may exclude coverage for wind or hail damage, or in wildfire country, a policy without fire and smoke protection.”

“Activity has been observed in recent years that has differed from historical norms or modeled expectations.”

More articles on Flood Insurance, Rising Sea Levels and Global Warming.

bookmark_borderClimate Change: Stranded on an Island

by Daniel Brouse

Climate change brings with it the inevitability of rising sea levels. Even if green house gas emissions were stopped completely, the sea will continue to rise for hundreds or thousands of years.

Not only will the submerged properties be affected by the rising tides, so will all the new island properties. Initially, some properties will just be temporarily cut-off from civilization. Eventually, those temporary islands will become permanent.

An initial reaction may be “Oh, I’ve always wanted to live on island;” however, being stranded on a deserted island is not fun. It is important to look forward and evaluate the risk in value to real estate. Much of the newly isolated land will become worthless.

ARS Technica reports, “having a property above water won’t be much good if flooding nearby means you can’t get to a hospital or grocery store when you need to or lose access to electricity or other services. It’s entirely possible for rising seas to leave a property high, dry, but uninhabitable as rising seas cut connections to essential services. A group of researchers has analyzed the risk of isolation driven by sea level rise, and shows it’s a major contributor to the future risks the US faces.”

If you’re interested in comparing the risk of isolation to that of inundation, the researchers built a website that lets you explore the risks under different sea level rise scenarios.

The Journal Nature published “Risk of isolation increases the expected burden from sea-level rise”:

The typical displacement metric for sea-level rise adaptation planning is property inundation. However, this metric may underestimate risk as it does not fully capture the wider cascading or indirect effects of sea-level rise. To address this, we propose complementing it by considering the risk of population isolation: those who may be cut off from essential services. We investigate the importance of this metric by comparing the number of people at risk from inundation to the number of people at risk from isolation. Considering inundated roadways during mean higher high water tides in the coastal United States shows, although highly spatially variable, that the increase across the United States varies between 30% and 90% and is several times higher in some states. We find that risk of isolation may occur decades sooner than risk of inundation. Both risk metrics provide critical information for evaluating adaptation options and giving priority to support for at-risk communities.

More articles on Flood Insurance, Rising Sea Levels and Global Warming.

bookmark_borderAntarctic Ice Sheet Is Melting at Accelerated Rate

The Word Economic Forum published the report The Antarctic ice sheet is melting. And this is bad news for humanity.

* The Antarctic ice sheet has been strongly decreasing since 2016.
* If left unchecked, the complete melting of the West Antarctic ice sheet would cause a global sea level increase of 3.3 metres in the future, says an expert.
* At present, the world is heading towards a warming of 2.8C by the end of this century.
* The Antarctic ice sheet will therefore continue to melt and contribute to sea level rise, which will test the adaptive capacity of humanity.

The consequences of the collapsing ice sheet
The sustained melting of the West Antarctic ice sheet could indicate that an unstable retreat (which reinforces itself) is underway or imminent. However, there is high uncertainty about this phenomenon.

The mechanism that would explain this unstable retreat is known as Marine Ice Sheet Instability.

If the bed, where the ice sheet lies, slopes down towards the interior, it destabilizes the position of the grounding line — zone where this ice sheet starts to float. The thinning of the ice shelf causes this grounding line to retreat, which leads to an influx of ice from the ice sheet to the sea. This, subsequently, causes the thinning of the ice shelf and so on and so forth.

The bottom line is that the melting of the Antarctic ice sheet contributes to and will continue to contribute to sea level rise for a long time, which will test the adaptive capacity of humanity.

The sea level increase by 2100 will particularly affect the tropical countries. And so, what happens in the Antarctic will definitely not stay in the Antarctic.

In February of 2023. the Copernicus Programme issued the repot Copernicus: Antarctic sea ice extent reaches all-time minimum in February – Second warmest winter on record in Europe.

February 2023 – temperature highlights:
* February 2023 was the fifth warmest globally
* Most of Europe had above-average air temperatures, particularly northern Norway and Sweden, and the Svalbard region
* Above-average temperatures occurred in the eastern United States, northern Russia, and in Pakistan and India
* Below-average temperatures were experienced across the Iberian Peninsula, Türkiye, the western United States, * Canada, northeast Russia, and northern Australia

February 2023 – Sea ice highlights:
* Antarctic sea ice reached its lowest monthly extent in the satellite data record, at 34% below the average for February, breaking the previous record of February 2017.
* Antarctic daily sea ice extent also reached an all-time minimum, surpassing the previous record set in February 2022.
* Sea ice concentrations were much below-average in all sectors of the Southern Ocean.
* Arctic sea ice extent was 4% below average, ranking 2nd lowest for February in the satellite data record, jointly with February 2016 and 2017.
* Arctic sea ice concentrations were most below-average in the Barents Sea and Svalbard region.

Sea-level Rise: Greenland and the Collapse of the Antarctic Ice Sheet

More articles on Flood Insurance, Extreme Weather Events, Rising Sea Levels and Global Warming

bookmark_borderManaged Retreat: Relocating Due to Climate Change Extreme Weather Events

The Politico article Dream homes and disasters: Is the government ready to confront climate risk? explains the need for “Managed Retreat”.

“The fact that official Washington is finally addressing the concept of some areas being too vulnerable to insure is noteworthy….”

“For decades, lawmakers and federal agencies in Washington, D.C., have resisted taking harsh action to pull federal insurance funding from especially vulnerable areas, even as climate change made a mockery of 100-year projections…. Now, in the wake of disasters including the deadly Kentucky floods and Hurricane Ian, official Washington is openly wrestling with what to do about the hundreds of thousands of people who are living in areas that climate change is making too risky to inhabit.”

“If large numbers of communities are rendered undesirable because of their climate, local and regional real estate markets could tank. Expensive public infrastructure like water treatment systems and roads could be abandoned or become obsolete as people relocate. Heavy taxpayer spending is likely. Yet many experts say that proactively steering people away from places climate change is making nonviable will seem a bargain compared with the costs of rebuilding in the shadow of past and future disasters, floods and droughts.”

“… as climate change makes disasters more frequent and severe, a once-taboo strategy known as “managed retreat” is getting more serious consideration in Congress and the federal government.”

“Human beings are terrible at assessing risk,” Kralicek (the emergency manager for Tulsa and Tulsa County) said. “We’re awful at it. Which is why things like casinos do so well.”

Recent federal policy changes might help to limit those losses. But until there’s a wholesale rethink of how — and where — cities, towns and counties develop, there will be more hardship.

“The piper is gonna come call, and at some point you got to pay,” Kralicek added. “And you just got to figure out who’s paying.”

Making people pay
One way to push people to make rational decisions is to force them to pay more if they don’t.

In October 2021, FEMA rolled out its long-awaited revamp to the federal flood insurance program, known as Risk Rating 2.0. The effort aims to align insurance premium pricing with the actual flood risk homes face. FEMA hopes doing so will limit losses to the chronically indebted, taxpayer-funded federal flood insurance program and also signal to would-be homeowners that some places face significant danger.

“There is no greater risk-communication tool than a pricing signal. When we distort the price, we distort their understanding of risk,” said Wright, the former FEMA flood insurance chief.

Risk Rating 2.0: Equity in Action
FEMA Flood Insurance Risk Rating 2.0

FEMA is updating the National Flood Insurance Program’s (NFIP) risk rating methodology through the implementation of a new pricing methodology called Risk Rating 2.0.

FEMA is committed to building a culture of preparedness across the nation. Purchasing flood insurance is the first line of defense against flood damage and a step toward a quicker recovery following a flood.

Since the 1970s, rates have been predominantly based on relatively static measurements, emphasizing a property’s elevation within a zone on a Flood Insurance Rate Map (FIRM).

This approach does not incorporate as many flooding variables as Risk Rating 2.0. Risk Rating 2.0 is not just a minor improvement, but a transformational leap forward. Risk Rating 2.0 enables FEMA to set rates that are fairer and ensures rate increases and decreases are both equitable.

FEMA is building on years of investment in flood hazard information by incorporating private sector data sets, catastrophe models and evolving actuarial science.

With Risk Rating 2.0, FEMA now has the capability and tools to address rating disparities by incorporating more flood risk variables. These include flood frequency, multiple flood types—river overflow, storm surge, coastal erosion and heavy rainfall—and distance to a water source along with property characteristics such as elevation and the cost to rebuild.

Currently, policyholders with lower-valued homes are paying more than their share of the risk while policyholders with higher-valued homes are paying less than their share of the risk. Because Risk Rating 2.0 considers rebuilding costs, FEMA can equitably distribute premiums across all policyholders based on home value and a property’s unique flood risk.

Rates can increase 18% per year.

More articles on Flood Insurance, Extreme Weather Events and Global Warming.

bookmark_borderGlobal Carbon Budget 2022

The Global Carbon Budget 2022 was published by Earth System Science Data.

The report says if emissions aren’t brought down, the world will use up its 1.5-degree-Celsius carbon budget — the amount of CO2 we can emit and stay within 1.5C — within nine years. After go beyond 1.5C the amount of tipping points crossed will bring on irreversible and exponential increasing rates of catastrophic damage.

Global fossil CO2 emissions (including cement carbonation) further increased in 2022, being now slightly above their pre-COVID-19 pandemic 2019 level. The 2021 emission increase was 0.46 GtC yr−1 (1.7 GtCO2 yr−1), bringing 2021 emissions to 9.9 ± 0.5 GtC yr−1 (36.3 ± 1.8 GtCO2 yr−1), same as the 2019 emissions level. Preliminary estimates based on data available suggest fossil CO2 emissions continued to increase by 1.0 % in 2022 relative to 2021 (0.1 % to 1.9 %), bringing emissions of 10.0 GtC yr−1 (36.6 GtCO2 yr−1), slightly above the 2019 level.

Emissions from coal, oil, and gas in 2022 are expected to be above their 2021 levels (by 1.0 %, 2.2 % and −0.2 % respectively). Regionally, emissions in 2022 are expected to have decreased by 0.9 % in China (3.1 GtC, 11.4 GtCO2) and 0.8 % in the European Union (0.8 GtC, 2.8 GtCO2) but increased by 1.5 % in the United States (1.4 GtC, 5.1 GtCO2), 6 % in India (0.8 GtC, 2.9 GtCO2), and 1.7 % in the rest of the world (4.2 GtC, 15.4 GtCO2).

atmospheric CO2 concentration

Anthropologic Climate Change

bookmark_border1/3 of World Heritage Glaciers Will Disappear by 2050

The United Nations says, “New UNESCO data highlight the accelerated melting of glaciers in World Heritage sites, with glaciers in a third of sites set to disappear by 2050. But it is still possible to save the other two thirds, if the rise in global temperatures does not exceed 1.5°C compared to the pre-industrial period.”

The UNESCO report World Heritage Glaciers found:

Glaciers across the globe – including the last ones in Africa – will be unavoidably lost by 2050 due to climate change.

Glaciers in a third of UN World Heritage sites will melt within three decades.

Mount Kilimanjaro’s last glaciers will vanish as will glaciers in the Alps and Yosemite National Park in the US.

They will melt regardless of the world’s actions to combat climate change.

50 UNESCO World Heritage sites are home to glaciers (A total of 18,600 glaciers have been identified in these 50 sites, covering around 66,000 km2), representing almost 10% of the Earth’s total glacierized area. They include the highest (next to Mt. Everest), the longest (in Alaska), and the last remaining glaciers in Africa, amongst others, giving a representative overview of the general situation of glaciers in the world.

But a new study by UNESCO, in partnership with IUCN, shows these glaciers have been retreating at an accelerated rate since 2000 due to CO2 emissions, which are warming temperatures. They are currently losing 58 billion tons of ice every year – equivalent to the combined annual water use of France and Spain– and are responsible for nearly 5% of observed global sea-level rise.
Only one effective solution: quickly reduce CO2 emissions

The report concludes that glaciers in a third of the 50 World Heritage sites are condemned to disappear by 2050, regardless of efforts to limit temperature increases. But it is still possible to save the glaciers in the remaining two thirds of sites if the rise in temperatures does not exceed 1.5°C compared to the pre-industrial period.

“We hope we might be wrong, but this is the hard science,” said UNESCO project officer Tales Carvalho Resende, one of the authors. “Glaciers are one of the valuable indicators of climate change, because they’re visible. This is something we can really see happening.”

The remaining glaciers in the other two thirds of UN World Heritage sites could be saved, but only if the world limits global warming to 1.5C, the authors say. Another UN report last week found that the world currently had “no credible pathway” to achieve that.

“What is quite unprecedented in the historical record is how quickly this is happening,” said Beata Csatho, a glaciologist from the University of Buffalo.

“In the middle of the 1900s, glaciers were quite stable,” she said. “Then there is this incredibly fast retreat.”

“This is really a call to take action at every level – not only at the political level, but at our level as human beings,” said Carvalho Resende.

Sea-level Rise: Greenland and the Collapse of the East Antarctic Ice Sheet |
Anthropologic Climate Change