bookmark_borderHow Is Climate Energy Hitting You? Florida Keys: Going Under

by Daniel Brouse

Much of the public discussion of climate change still focuses on historical trends and older climate models. Since 2023–2024, however, our understanding of the climate system has advanced significantly as scientists increasingly examine real-time observations, accelerating changes, feedback loops, and complex Earth system behavior.

Understanding climate acceleration no longer requires multiple advanced degrees or an extensive background in nonlinear chaos theory. The evidence is increasingly visible in the world around us. In many ways, you can begin by simply looking out your window.

Florida Keys: Going Under

Dave Darlington Sr. shared this observation from Tavernier, Florida:

“Our last morning here in Tavernier, I wanted to speak to climate change. Some say it’s a hoax, but as the planet warms, glaciers and ice melt and salt water rises. Change is needed or future generations won’t enjoy what we have. Fran and I have come to this area since 1986 and seen profound change here. I wanted to share it with you. Until this administration cast off the ecologic safeguards there was hope. Will everyone do something? Now we are at a crucial point, vote carefully. Or throw it all away.”

Going Under

The photograph captures the ongoing threats of coastal flooding, tidal inundation, and saltwater intrusion driven by sea-level rise in this low-lying Florida Keys community.

Because these islands sit on highly porous limestone, rising seas threaten them from two directions: seawater can inundate the shoreline and push inland through the ground beneath it. These growing risks have prompted multimillion-dollar infrastructure projects in Tavernier and surrounding communities to protect homes, roads, and other critical infrastructure.

Unfortunately, much of this investment risks becoming a losing battle against accelerating sea-level rise. Over the next decade, protecting the most vulnerable areas will become increasingly difficult and expensive as rising seas intensify the threats facing coastal infrastructure. Managed retreat—planning for the relocation of people, homes, and infrastructure away from areas that can no longer be defended—is the only realistic long-term solution in the most vulnerable locations.

The underlying problem is physical: infrastructure can be elevated, drainage improved, and seawalls strengthened, but these measures cannot permanently overcome rising seas.

Insurance: When the Economics No Longer Work

Given the extent of climate damage already locked into the system, insurance prices serve a purpose beyond determining the cost of coverage. They increasingly reveal where the risks of homeownership are becoming economically unsustainable.

When homeowners insurance becomes unaffordable, it signals that the financial risks of owning property in that location may no longer justify the investment. Premiums, deductibles, coverage restrictions, and the growing difficulty of obtaining insurance all reveal the economic consequences of physical climate risks.

This is the interaction of physics and economics: as climate hazards intensify, the costs of protecting property rise. Eventually, the expense of maintaining and insuring a home can exceed what the property is worth owning.

Ironically, Florida became a prime example of how government intervention can subsidize homeowners insurance and delay the financial recognition of growing climate risks. Such subsidies may temporarily reduce costs for property owners, but they do not eliminate the underlying physical hazards. They shift the financial burden to taxpayers.

Dave responded: “Makes sense to me, that is one reason we left south Florida after Hurricane Andrew.”

His experience illustrates a difficult reality: people who recognize escalating risks and leave vulnerable areas may make their decisions long before the broader housing and insurance markets fully reflect those risks.

The bottom line: Climate change is not just a distant environmental problem. It is reshaping coastlines, threatening infrastructure, increasing insurance costs, and changing the economics of where people can safely and affordably live. The evidence is already visible. The challenge is recognizing what it means—and acting before the costs become overwhelming.

bookmark_borderTrump’s Hypocrisy: White Nationalism, Science Denial, and Government Intervention

Overview

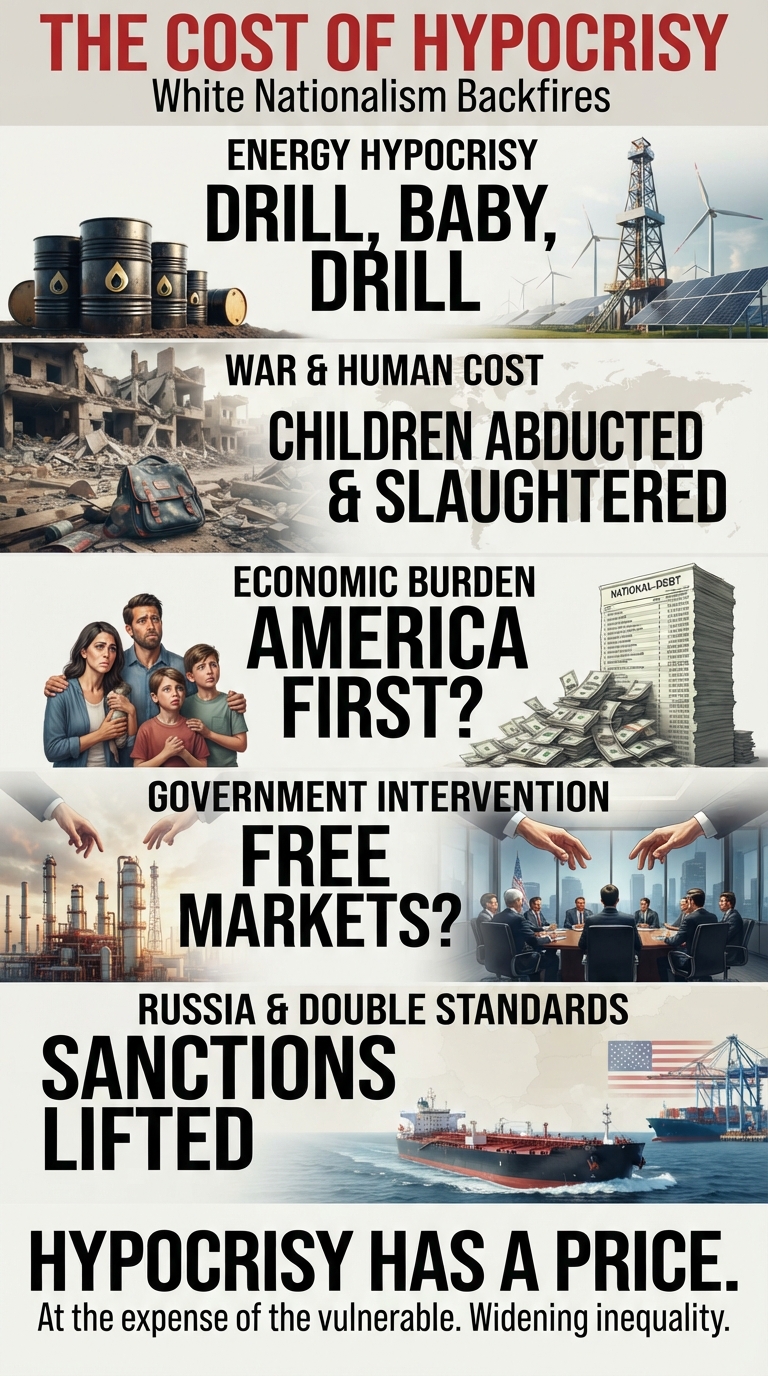
HYPOCRISY HAS A PRICE.

Trump promises to put America first. But his policies tell a different story.

From fossil-fuel subsidies and Russian diesel imports to government intervention, mounting economic burdens, and policies that deepen inequality, the contradictions are impossible to ignore.

Who pays the price? American families, the most vulnerable, and future generations.

Promises versus reality. Political rhetoric versus consequences.

The result: ideological extremism, economic inequality, and a governing agenda that contradicts its own claims.

When hypocrisy becomes policy, we all pay the price.

The Facts

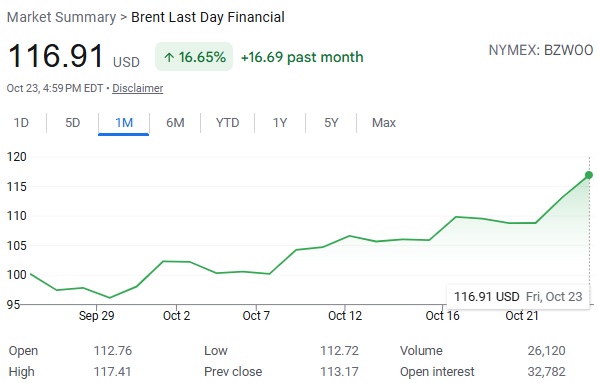
Brent crude futures recently approached $117 per barrel. However, futures prices tell only half the story. Due to the geopolitical instability associated with Trump’s support for Vladimir Putin and Benjamin Netanyahu, both indicted war criminals, the cost of delivering physical oil has soared to approximately half the futures price, pushing the final cost of a barrel to $150–$175.

Ironically, this has triggered the fastest and most significant global shift away from fossil-fuel dependency, directly contradicting Trump’s “Drill, Baby, Drill” ideology and its rejection of climate science. His policies and geopolitical alliances are accelerating the very energy transition his administration seeks to obstruct.

Russia claims to have abducted more than 700,000 Ukrainian children. Meanwhile, Netanyahu’s military campaign in Gaza has killed tens of thousands of Palestinians, including tens of thousands of children..

Trump himself faces allegations of war crimes and crimes against humanity involving U.S. military operations in the Caribbean and the targeting and deaths of schoolchildren at Shajareh Tayyebeh Elementary School in Minab, Hormozgan Province, Iran. These events expose the devastating human consequences of the conflicts associated with these leaders.

The Economy: Tariffs, Deficits, and the Cost of Corruption

Trump’s tariffs, acts of war, anti-science claims, white nationalist policies, and corruption have contributed to unprecedented trade and budget deficits and an unsustainable national debt at record levels. The resulting fiscal pressures compound the economic burden of interest payments, while federal borrowing adds upward pressure to interest rates.

The Trump administration’s claims that racist, bigoted, and white nationalist policies “Make America Great Again” and put “America First” are contradicted by the economic consequences of its policies. Tariffs raise costs, trade conflicts disrupt markets, and government resources are directed toward favored industries while American households bear the burden.

This is not economic nationalism delivering broad-based prosperity. It is an economic agenda that places ideological priorities and political interests above the financial well-being of ordinary Americans. Its rhetoric bears the hallmarks of neo-fascist propaganda: ultranationalism, scapegoating, authoritarianism, and the presentation of exclusionary policies as patriotic necessities.

Fossil-Fuel Subsidies: Government Intervention Disguised as National Security

In his latest move, Trump has used his warmongering to subsidize the fossil-fuel industry. President Donald Trump invoked the Cold War-era Defense Production Act (DPA) to allocate up to $150 million in federal funding to subsidize and expand domestic oil-refining capacity.

This is direct government intervention in private markets, using public money and federal authority to protect and expand fossil-fuel infrastructure. The policy contradicts the administration’s free-market rhetoric while reinforcing dependence on the very fuels driving climate change.

Lifting Russian Diesel Sanctions: Fueling Putin’s War Machine

Trump’s intervention extends beyond domestic subsidies. On October 9, 2026, Trump announced a diesel-supply agreement with Russian President Vladimir Putin and temporarily eased U.S. sanctions on Russian diesel exports. The agreement reverses the direction of U.S. policy established after Russia’s invasion of Ukraine, when restrictions were imposed to deprive Moscow of revenue supporting its war. The U.S. Treasury subsequently issued a license allowing covered Russian diesel shipments to proceed without sanctions through April 2027.

On October 22, the Malta-flagged tanker Agioi Fanendes loaded approximately 40,000 metric tons of Russian diesel at Primorsk and headed for New York. Its cargo of 298,000–320,000 barrels represents just 7–8% of U.S. daily diesel consumption.

The irony is profound: after imposing sanctions to restrict Russian energy revenues and pressure Putin over his invasion of Ukraine, Trump has relaxed those restrictions to facilitate Russian diesel exports. This marginal contribution to U.S. fuel supplies undermines American credibility, weakens sanctions enforcement, and provides Moscow with renewed access to U.S. markets while its war against Ukraine continues.

The policy also exposes the weakness of the administration’s energy-security argument. A shipment representing a small fraction of one day’s U.S. diesel consumption does not resolve America’s structural dependence on volatile global fuel markets. Instead, the agreement ties American energy policy more closely to a Russian government waging war against a U.S. partner.

Trump’s Russian diesel agreement undermines U.S. credibility, weakens the rule-of-law framework behind sanctions, and rewards Putin with renewed access to American buyers. It also demonstrates how quickly the administration abandons its declared principles when political priorities demand it.

Government Ownership: Accusing China of What Washington Is Doing

The intervention extends far beyond oil refining and Russian diesel. As part of a major shift in U.S. industrial policy, ostensibly designed to strengthen national security and reduce reliance on China, the Trump administration has committed more than $26 billion to acquire equity stakes, warrants, or options in dozens of strategic private companies.

Financed through a combination of CHIPS Act funding, Department of Defense programs, and energy-related mandates, the federal portfolio encompasses at least 34 corporate deals.

This is a substantial expansion of government involvement in private enterprise. Rather than leaving investment decisions to private markets, the administration is using public resources to acquire financial interests in strategic businesses and influence the direction of American industry.

The hypocrisy is unmistakable: Trump condemns China for state-directed economic intervention while pursuing an increasingly interventionist industrial policy in the United States.

When China uses government resources to advance national industrial priorities, Trump presents it as a threat to free markets. When his own administration deploys federal funding, government ownership, strategic investment, and sanctions relief to advance its industrial and geopolitical priorities, he presents those actions as national security.

The distinction is political, not economic. Government intervention remains government intervention, regardless of whether it benefits Washington, Beijing, Moscow, or a favored private industry.

The Bottom Line: Hypocrisy as a Governing Strategy

The contradictions are undeniable.

An administration that rejects climate science and champions fossil fuels is presiding over geopolitical and economic developments that accelerate the global transition away from fossil-fuel dependence.

A president who claims to champion free markets is using federal power and taxpayer money to subsidize favored industries, acquire financial interests in private companies, and direct investment toward political and strategic priorities.

A political movement that promises to put America first is pursuing policies that impose substantial costs on American households, increase economic uncertainty, and compound the financial burdens inherited by future generations.

A president who condemns China’s government-directed economic policies is implementing comparable forms of intervention at home while claiming that his actions are fundamentally different.

The central issue is not whether government intervention is always wrong. It is the administration’s selective application of its own principles: free markets when criticizing political opponents, government intervention when advancing its own agenda, and national security as the justification for policies that benefit favored industries.

Trump’s record exposes the contradiction between his public rhetoric and his administration’s actions. White nationalism is presented as patriotism, science denial as economic policy, fossil-fuel subsidies as energy security, and government intervention as free-market leadership.

The result is a governing agenda defined by hypocrisy, ideological extremism, and policies that contradict the promises used to justify them—all at the expense of the most vulnerable, while further widening income inequality.

bookmark_borderHow Is Climate Energy Hitting You? Pennsylvania: Watch for Falling Rock

by Daniel Brouse

Climate Change Is Altering the Conditions That Destabilize Slopes

CONNELLSVILLE, PENNSYLVANIA — OCTOBER 17, 2026

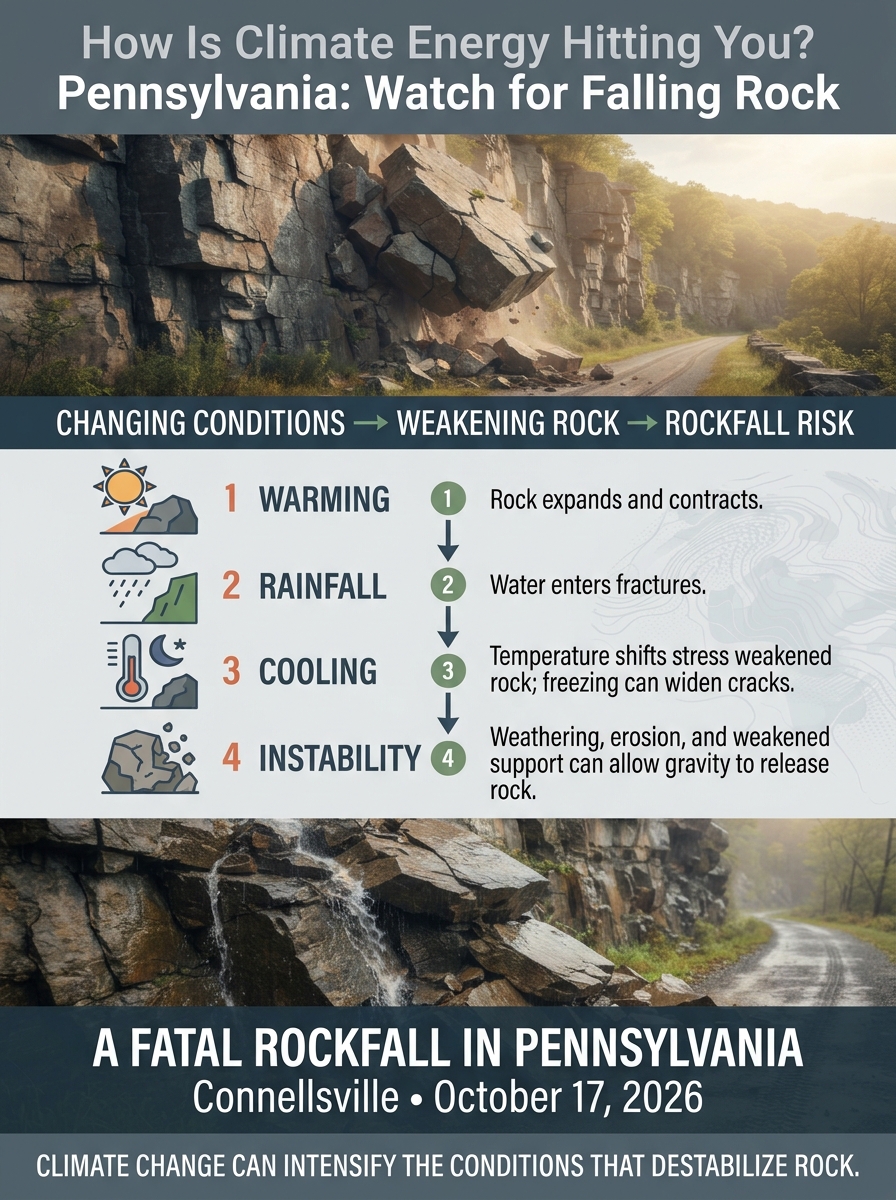
A woman was killed when a falling rock pinned her and her husband while they were bicycling on the Great Allegheny Passage near Connellsville, Pennsylvania. Her husband was seriously injured and airlifted to a hospital. The Pennsylvania Department of Conservation and Natural Resources is investigating the fatal landslide.

This tragedy illustrates a geological hazard that climate change can make more dangerous: the progressive destabilization of rock faces and slopes.

Earthquakes, erosion, gravity, rainfall, and natural weathering have always caused rockfalls. But climate change is altering the background conditions under which these processes operate. Warming, changing precipitation, shifting freeze–thaw patterns, and changing water movement can interact with existing geological weaknesses, contributing to slope instability.

The critical question is not whether climate change created the rocks or the hillside. It is whether changing climate conditions are accelerating the processes that cause rock to break loose.

Pennsylvania Weather: The Conditions Before the Collapse

Historical weather records for Connellsville document a substantial temperature swing during the days preceding the October 17 rockfall.

The recorded sequence was:

DateReported temperature
October 13High of 82°F
October 14High of 77°F
October 15High of 68°F
October 16High of 77°F
October 17Low of 36°F

Historical hourly observations also show rain during October 16 and into the early hours of October 17, followed by much cooler conditions.

The reported October 13 high of 82°F and October 17 morning temperature near 36°F represent a temperature difference of approximately 46°F over four days.

These observations provide a concrete starting point for investigating the environmental conditions preceding the collapse.

The sequence of warming, rainfall, and cooling deserves examination because temperature changes can stress fractured rock, while infiltrating water can alter the forces holding rock masses together.

The weather sequence is documented. Its contribution to the rockfall remains a question for geological investigation.

Four Ways Climate and Weather Can Destabilize Pennsylvania Rock Faces

1. Thermal Expansion and Contraction: Repeated Stress on Fractured Rock

Rock expands as it heats and contracts as it cools. Different minerals respond differently to temperature changes, producing internal stresses that can contribute to cracking and progressive deterioration.

Repeated heating and cooling can gradually weaken susceptible rock, particularly where fractures and joints already exist. This process is known as thermal fatigue.

The Connellsville weather record shows a substantial change in air temperature between October 13 and October 17. Even though the temperature log at the nearest weather station recorded a low of 36°F, microclimates along deep, shaded cliff faces can behave differently.

A large air-temperature swing does not prove that thermal stress triggered this particular collapse. Nevertheless, the mechanism is established and relevant to evaluating the stability of exposed, fractured rock.

2. Freeze–Thaw Weathering: Water Can Widen Existing Fractures

Water enters cracks in rock. When it freezes, ice can exert pressure that widens fractures, particularly where water is confined. Repeated freezing and thawing can progressively loosen blocks until gravity causes them to fall.

The Connellsville-area records show temperatures approaching or reaching the freezing point in the broader period around the incident. The October 17 morning readings include temperatures near a daily low of 36°F.

Climate change modifies the conditions under which freeze–thaw weathering occurs. Warmer winters can reduce freezing in some locations, while changing seasonal temperature patterns can alter when freezing and thawing occur in others.

The local consequences depend on rock type, moisture, exposure, and the frequency and duration of freezing.

3. Rainfall and Water Pressure: Destabilizing Slopes From Within

Rainfall is a major trigger of landslides and slope failures.

Water infiltrating fractured rock and surrounding soil can increase pore-water pressure, reduce the effective forces resisting movement, and weaken susceptible slopes. Runoff can also erode material supporting a rock face, leaving overhanging or poorly supported blocks.

Historical hourly observations for Connellsville show rain during October 16 and into the early hours of October 17. This makes the timing and amount of precipitation important subjects for the investigation.

Climate change is increasing heavy precipitation in many regions, including parts of the eastern United States. A warmer atmosphere can hold more water vapor, contributing to heavier precipitation when atmospheric conditions support rainfall.

Where rainfall intensifies, climate change can increase the conditions that lead to slope failure. Whether it did so in this incident requires a local climate and geological assessment.

4. Vegetation, Roots, and Long-Term Weathering

Plant roots can enter existing rock fractures and gradually widen them. Vegetation can also stabilize soil, reduce erosion, and alter water movement through a slope. Its overall effect depends on the terrain and the type and distribution of vegetation.

Changes in temperature, growing seasons, drought, and precipitation can alter these interactions over time.

A rock face can weaken through years of weathering before a particular combination of rainfall, temperature changes, erosion, or other disturbances contributes to a sudden failure.

The Climate Connection: From Individual Hazards to Accelerating Change

Climate change does not have to create a new geological hazard to make existing hazards more dangerous.

The relevant distinction is between the underlying geological structure and the environmental conditions that influence its stability.

A fractured rock face may remain in place for decades. Changes in temperature, water infiltration, erosion, or the removal of supporting material can gradually alter its stability. Eventually, a relatively small additional disturbance may be sufficient to trigger a collapse.

Where warming or changing precipitation increases a known destabilizing process, the resulting hazard can become more severe.

The same principle applies to infrastructure, roads, railways, hiking trails, and communities built beneath steep slopes.

Global Case Studies: The Scale of Slope Instability

Western North Carolina — September 2024

Hurricane Helene produced extreme rainfall across parts of the southern Appalachians. The U.S. Geological Survey initially identified more than 2,200 landslides associated with the event, with subsequent mapping identifying additional failures.

The landslides damaged roads and other infrastructure and isolated communities.

Helene illustrates how extreme rainfall interacting with susceptible terrain can produce widespread slope failures. Determining the contribution of climate change to the storm and its associated landslides requires separate attribution analysis.

New Zealand — February 2023

Cyclone Gabrielle triggered hundreds of thousands of landslides across affected parts of New Zealand. Government assessments have reported different totals depending on geographic coverage and mapping scope, with estimates exceeding 300,000 and broader national summaries reporting more than 800,000.

The event demonstrates how severe rainfall can produce extensive landsliding across a large region.

The physical mechanism is well established: rainfall infiltrates susceptible terrain, increases water pressure, and can reduce the forces resisting slope movement. The event’s scale alone does not determine the proportion attributable to climate change.

European Alps — Warming, Permafrost Thaw, and Rockfall

Research in the European Alps has documented the destabilizing effects of permafrost thaw and changing glacier conditions. Warm periods can increase concern about rockfall where ice within fractures contributes to rock-mass stability.

The Intergovernmental Panel on Climate Change identifies glacier retreat and permafrost thaw as important drivers of changing mountain hazards.

These processes show how climate change can affect the physical structure of terrain, not simply the weather experienced at the surface.

Himalayas — Multiple Interacting Hazards

The Himalayan region faces risks from intense rainfall, landslides, glacier retreat, permafrost degradation, and glacial-lake outburst floods.

These hazards can interact, producing cascades in which slope failures contribute to debris flows, river blockages, and downstream flooding.

What Pennsylvania Should Do Now

The Connellsville tragedy warrants more than a general discussion of climate change. It calls for a thorough investigation of the failed slope and the conditions preceding its collapse.

Investigators should examine:

  • The failure surface, rock type, fracture patterns, and evidence of previous movement.
  • Recent rainfall, drainage, and the possibility of water infiltration into the slope.
  • Temperature records and the potential effects of heating, cooling, and localized freezing.
  • Evidence of erosion, vegetation-related changes, or the loss of material supporting the rock face.
  • Long-term local climate records to determine whether relevant temperature or precipitation patterns have changed.
  • Similar slopes along the Great Allegheny Passage and other Pennsylvania trails, particularly where rock faces overhang public routes.

Trail managers and transportation authorities should evaluate unstable slopes using current geological assessments and weather-related risk factors rather than relying exclusively on historical conditions.

A hazard that has remained stable for decades is not necessarily guaranteed to remain stable under changing environmental conditions.

Conclusion: Climate Change Can Alter the Conditions That Cause Rockfalls

The fatal rockfall near Connellsville occurred after a documented sequence of warm weather, rainfall, and cooling. That sequence merits examination because temperature changes and water infiltration can contribute to the deterioration and destabilization of fractured rock.

The underlying mechanisms are real, and climate change is altering temperature and precipitation patterns in ways that can increase geological hazards in susceptible locations.

Pennsylvania faces a combination of geological conditions, but the fundamental lesson is the same: rockfalls are not simply events involving gravity. They are often the final stage of a longer process involving fractures, water, weathering, erosion, and changing environmental conditions.

Climate change does not have to create a geological hazard to increase the conditions under which it occurs.

The appropriate response is neither to attribute every rockfall to climate change nor to ignore the climate connection. It is to investigate the evidence, identify the mechanisms at work, and incorporate changing environmental conditions into public safety planning.

How is climate energy hitting you? Sometimes its consequences unfold gradually. Sometimes they emerge as sudden, localized disasters.

Understanding how climate, weather, and geology interact is essential to recognizing and reducing the risks ahead.

bookmark_borderHow Is Climate Energy Hitting You? Super Typhoon Champi

by Daniel Brouse

Super Typhoon Champi: Nonlinear Acceleration and the Growing Power of Earth’s Climate System

Overview

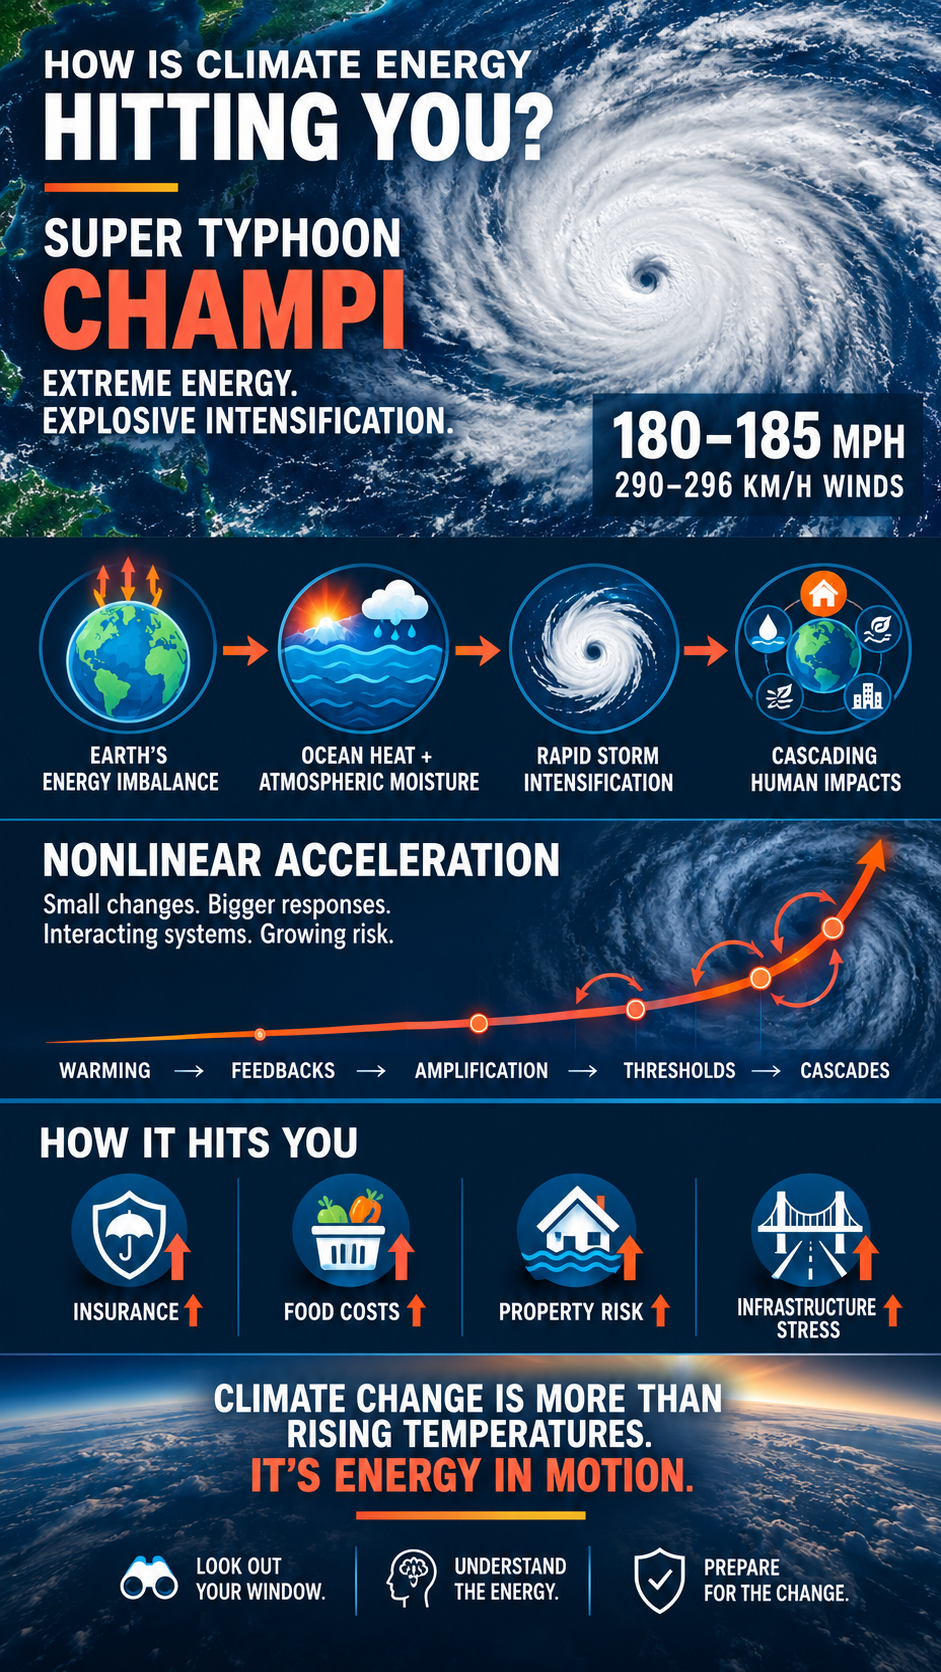
HOW IS CLIMATE ENERGY HITTING YOU? 🌎🌀

SUPER TYPHOON CHAMPI: EXTREME ENERGY. EXPLOSIVE INTENSIFICATION.

Super Typhoon Champi has rapidly intensified, packing maximum sustained winds of 180–185 mph (290–296 km/h).

Earth’s climate system is accumulating excess energy and redistributing it through the oceans, atmosphere, and ecosystems. The change is occurring so fast that measuring the full extent of the energy imbalance and its accelerating consequences is a growing scientific challenge.

🌊 OCEAN HEAT — Earth’s oceans absorb most of the excess heat accumulating in the climate system.

🌀 RAPID INTENSIFICATION — Ocean heat and atmospheric moisture fuel powerful tropical cyclones under favorable conditions.

⚡ NONLINEAR ACCELERATION — Feedbacks interact, changes amplify, thresholds are approached, and consequences cascade through interconnected systems.

🏠 HOW IT HITS YOU — Insurance costs. Food prices. Property risks. Infrastructure damage. Household affordability.

The Nonlinear Acceleration Hypothesis calls for looking beyond average temperatures to examine the speed of change, the interactions among climate processes, and the consequences of Earth’s growing energy imbalance.

This is not simply about a warmer planet. It is about a climate system changing at a rate that challenges our ability to measure, understand, and respond to its full consequences.

THE BOTTOM LINE:

CLIMATE CHANGE IS MORE THAN RISING TEMPERATURES.
IT’S ENERGY IN MOTION.

LOOK OUT YOUR WINDOW.
UNDERSTAND THE ENERGY.
PREPARE FOR THE CHANGE.

#ClimateChange #SuperTyphoonChampi #ClimateScience #NonlinearAcceleration #IntegratedClimateStewardship

1. When Climate Energy Becomes Impossible to Ignore

Climate energy is intensifying so rapidly that we are having trouble measuring the full extent of Earth’s extreme energy imbalance and its consequences.

Super Typhoon Champi has rapidly intensified into a monster Category 5-equivalent storm, packing maximum sustained winds of 180–185 mph (290–296 km/h). This explosive growth makes Champi the strongest tropical cyclone on Earth in 2026 by wind speed, tying or surpassing Super Typhoon Sinlaku. The Weather Network reported peak winds of 296 km/h on October 20, 2026.

Champi is more than an extraordinary weather event. It is a powerful reminder that Earth’s climate system operates through the movement, storage, and redistribution of energy. The atmosphere and oceans are not simply warming uniformly. They are interacting, transferring energy, and producing changes that can develop rapidly when environmental conditions align.

The central question is no longer merely whether the climate is changing. It is how the energy driving that change is affecting the world around us—and how quickly the consequences are emerging.

2. Earth’s Energy Imbalance: The Fuel Behind the Changes

Earth receives energy from the Sun and releases energy back into space. Greenhouse gases reduce the rate at which some of that outgoing energy escapes, creating an energy imbalance. More energy enters the climate system than leaves it.

The oceans absorb the overwhelming majority of the excess heat accumulating in the climate system. The atmosphere, land, and cryosphere also respond, but the ocean is the principal reservoir of this additional energy.

That distinction matters because ocean heat is not merely a measure of warmer water. It represents energy available to influence the entire climate system.

Warm ocean water can supply tropical cyclones with heat and moisture. Higher atmospheric temperatures allow air to hold more water vapor, increasing the potential for intense rainfall. Rising sea levels increase the baseline upon which storm surges act. Changes in sea ice, snow cover, clouds, and atmospheric circulation can further redistribute energy and alter regional conditions.

These processes do not operate independently. Their interactions can amplify or moderate particular outcomes, depending on the conditions.

The result is a climate system in which a relatively gradual global change can produce abrupt, highly localized consequences.

3. The Nonlinear Acceleration Hypothesis

The Nonlinear Acceleration Hypothesis provides a framework for understanding why climate change cannot be evaluated solely by looking at average temperatures or the rate of warming.

In a linear system, a change in the driving force produces a proportional response. In a nonlinear system, the response can become disproportionately large as feedbacks interact, thresholds are approached, and previously limited processes become more influential.

Consider a sequence of interacting processes:

  1. Warming: Greenhouse gas emissions increase Earth’s energy imbalance.
  2. Feedback activation: Changes in water vapor, clouds, ice, ecosystems, and ocean circulation alter the system’s response.
  3. Coupling: Multiple processes begin influencing one another rather than operating independently.
  4. Amplification: Some interactions reinforce the original change.
  5. Thresholds: Certain components undergo rapid transitions when critical conditions are crossed.
  6. Cascades: Changes in one component affect other components, potentially producing additional and increasingly widespread consequences.

The central concern is that the combined response of a complex system may become more difficult to anticipate as its components interact.

4. Champi: A Visible Example of Rapid Intensification

Tropical cyclones offer a dramatic illustration of nonlinear behavior.

A developing storm can intensify gradually and then strengthen much more rapidly when several environmental conditions become favorable. These include warm ocean water, sufficient moisture, relatively low vertical wind shear, and a storm structure that allows heat released through condensation to reinforce its circulation.

As the storm strengthens, its circulation can become more organized, allowing additional heat and moisture to contribute to its development. Under favorable conditions, the result can be explosive intensification.

Champi’s exceptional wind speeds illustrate the potential consequences of this process. Its rapid development also highlights the importance of monitoring changes in storm intensity, rather than relying exclusively on a storm’s earlier classification.

A 2022 study published in Nature Communications found evidence of increasing tropical-cyclone intensification rates in multiple basins, with anthropogenic forcing contributing to the observed changes. The authors also identified increasingly favorable thermodynamic conditions around tropical cyclones.

Separately, NOAA’s Geophysical Fluid Dynamics Laboratory concludes that human-caused ocean warming is likely contributing to more powerful tropical cyclones, while increased atmospheric moisture raises the potential for heavier rainfall.

5. From Ocean Heat to Extreme Weather

How does energy accumulated over decades translate into the weather experienced by people today?

The answer lies in the movement of energy through the coupled ocean-atmosphere system.

Ocean heat: Warmer surface waters and elevated heat content beneath the surface can provide favorable conditions for tropical-cyclone intensification. Subsurface heat matters because strong storms mix ocean water and can bring cooler water toward the surface. A sufficiently deep reservoir of warm water can limit this cooling effect.

Atmospheric moisture: Warmer air can hold more water vapor. When that moisture condenses in a storm, latent heat is released, helping sustain the storm’s circulation. Heavy rainfall can also cause destructive flooding far from the strongest winds.

Sea-level rise: Rising seas elevate the starting point for storm surge. The same storm can therefore produce more damaging coastal flooding than it would under a lower sea-level baseline.

Ice and reflectivity: Declining snow and ice cover can expose darker surfaces that absorb more sunlight. This is an amplifying feedback, although its effects vary by region and season.

Clouds and circulation: Clouds influence how much incoming sunlight is reflected and how much outgoing heat is retained. Their net climate effect depends on cloud type, altitude, location, and other properties. Changes in atmospheric circulation can also redistribute heat and moisture, altering regional extremes.

6. The Domino Effect: When Interactions Matter More Than Individual Changes

The Nonlinear Acceleration Hypothesis becomes particularly important when climate processes are considered as an interconnected system.

A change in one component can affect another. That second change can then influence the first component or activate additional processes.

For example, warming can reduce sea ice, exposing darker ocean water. The resulting increase in absorbed solar energy can contribute to further warming. Meanwhile, additional ocean heat can affect marine ecosystems, ice shelves, and regional weather patterns.

The same systems perspective applies to extreme weather. A storm can produce heavy rainfall, flooding, infrastructure damage, and prolonged disruption. Those impacts can cascade through transportation, electricity, water supplies, insurance markets, food distribution, and household finances.

Not every chain reaction is a self-reinforcing climate feedback. Some are physical feedbacks within the Earth system; others are consequences that propagate through ecological, social, and economic networks.

Both matter when assessing the full impact of climate change.

The important question is not simply how much one variable has changed. It is how changes interact, whether they reinforce one another, and whether the combined effects exceed the capacity of natural or human systems to adapt.

7. How Is Climate Energy Hitting You?

Champi may be developing far from your home, but the consequences of a changing climate do not stop at the storm’s path.

Climate-related risks reach households through several interconnected channels:

  • Insurance: Increasing disaster losses can contribute to higher premiums, larger deductibles, narrower coverage, or reduced availability of insurance in high-risk areas.
  • Housing: Flooding, wind damage, and repeated repairs can threaten property values and increase maintenance costs.
  • Food and water: Heat, drought, flooding, and disrupted transportation can affect agricultural production, food prices, and water supplies.
  • Electricity: Extreme temperatures increase heating or cooling demands, while storms can interrupt power and damage infrastructure.
  • Public finances: Disaster response, infrastructure repair, and recovery compete with other public priorities.
  • Health and safety: Heat exposure, flooding, contaminated water, and storm-related injuries can impose immediate and lasting costs.

These effects do not all occur at the same rate or in every location. Local exposure, building standards, infrastructure, preparedness, and financial resources make a substantial difference.

Nevertheless, the underlying economic principle is straightforward: climate risks can impose costs even on people who never experience a direct hit from a major storm.

The cost of climate change is therefore not limited to disaster declarations and damaged buildings. It can also appear in insurance renewals, utility bills, food purchases, property assessments, and the long-term affordability of housing.

8. Measuring Acceleration Rather Than Looking Only at Averages

Average global temperature remains an essential climate indicator, but it cannot describe every dimension of the changing climate system.

A complete assessment should examine multiple indicators, including:

  • Ocean heat content and the rate at which it is increasing.
  • Earth’s energy imbalance.
  • Sea-surface temperatures and marine heatwaves.
  • Sea-level rise and changes in ice mass.
  • The frequency and intensity of extreme heat and heavy precipitation.
  • Tropical-cyclone intensity, rapid intensification, and rainfall.
  • Changes in cloud properties, surface reflectivity, and ecosystem carbon uptake.

The distinction between a level and a rate of change is crucial. Temperature describes a state; the rate of temperature change describes how quickly that state is changing. Acceleration describes how the rate itself changes over time.

For a variable (X), the rate of change is represented by (dX/dt), while acceleration is represented by (d^2X/dt^2). A further change in acceleration can be described by the third derivative, (d^3X/dt^3).

These mathematical measures are useful only when applied to well-defined variables and sufficiently reliable data. Short-term fluctuations, measurement uncertainty, and natural variability can make apparent acceleration difficult to distinguish from persistent trends. Multiple indicators and appropriate statistical methods are therefore necessary.

The goal is not to assume that every climate indicator is accelerating. It is to determine which processes are changing, how their rates are evolving, and whether their interactions are increasing the risk of abrupt or disproportionate impacts.

9. Preparedness and Integrated Climate Stewardship

Understanding climate energy is useful only if it improves decisions.

Preparedness begins with recognizing that extreme events can intensify, compound, and disrupt interconnected systems. Governments need effective forecasting, evacuation plans, resilient infrastructure, and reliable emergency communications. Communities need to understand their flood, wind, heat, and infrastructure risks. Households need practical ways to reduce exposure and protect essential resources.

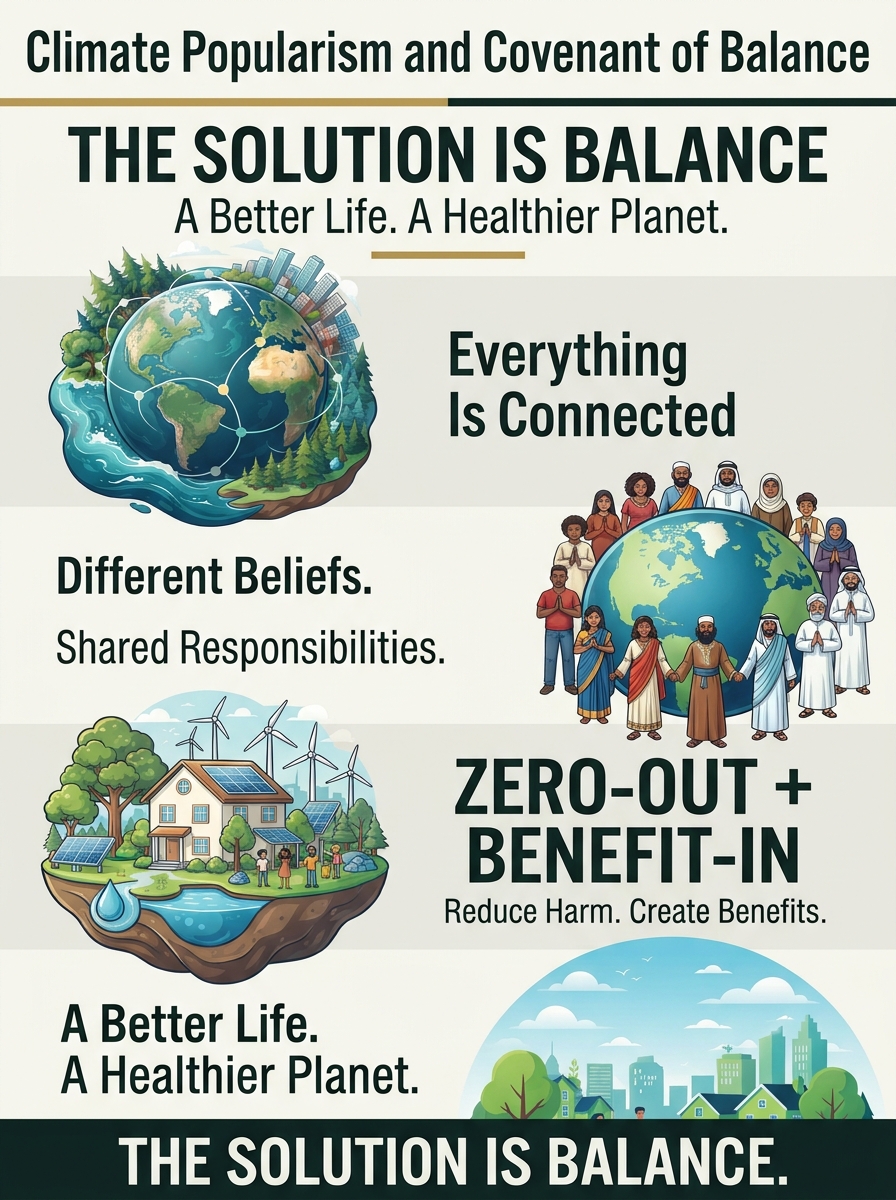
Integrated Climate Stewardship extends that approach into everyday life through two complementary principles: reduce the resources and emissions associated with household living, and increase beneficial contributions to the environment and community.

The objective is not to depend on a single technology or promise that individual actions can eliminate global climate risk. It is to combine practical reductions in energy and resource consumption with resilience, ecological stewardship, and informed economic decisions.

At the community level, investments in safer buildings, drainage, emergency preparedness, and resilient infrastructure can reduce avoidable losses. At the policy level, emissions reductions address the underlying driver of long-term warming, while adaptation helps communities manage risks that are already present or unavoidable.

Both are necessary. Preparing for climate impacts without reducing greenhouse gas emissions leaves the underlying problem growing. Reducing emissions without preparing for existing risks leaves communities exposed to harm.

10. The Bottom Line: Watch the Energy, Understand the Acceleration

Super Typhoon Champi provides a striking example of the power a tropical cyclone can attain under favorable environmental conditions. Its exceptional intensity deserves attention in its own right, while its relationship to climate change must be evaluated through the evidence.

The broader climate challenge is larger than any single storm.

Earth’s energy imbalance is changing the conditions under which weather, ecosystems, and human communities operate. Feedbacks and interactions can amplify some effects, while thresholds and cascading consequences can make the resulting impacts difficult to anticipate.

The Nonlinear Acceleration Hypothesis asks us to look beyond the current state of the climate and investigate how quickly it is changing, whether that rate is accelerating, and how the system’s components influence one another.

The practical question remains the one at the heart of this series:

How is climate energy hitting you?

Look beyond the headlines. Examine the energy, the trends, the interactions, and the consequences in your own community. Understand the risks before they become emergencies. Reduce avoidable vulnerability. And recognize that the climate system is interconnected with the economic, ecological, and social systems on which we all depend.

Climate change is not just a number on a thermometer. It is a changing distribution of energy, a changing set of risks, and a growing challenge for the systems that sustain everyday life.

bookmark_borderHumanity’s Status: Climate Tipping Points Tipped

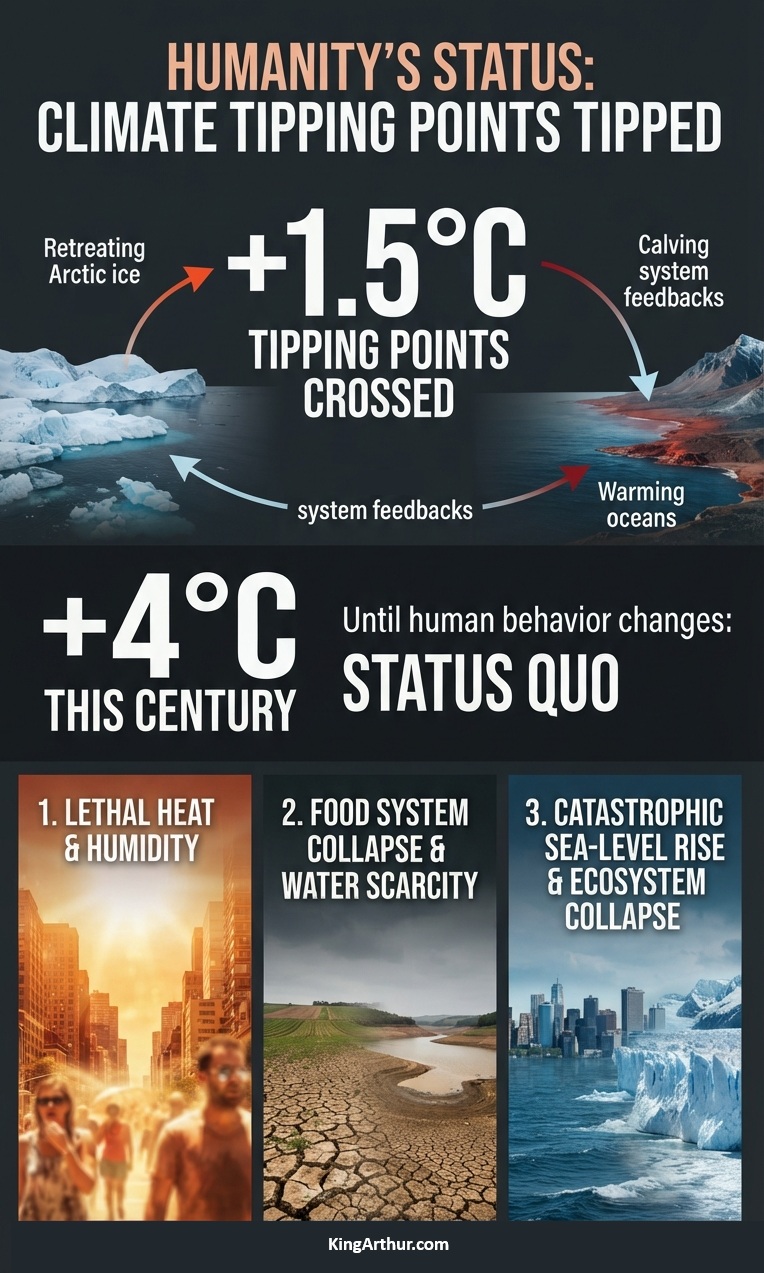
For now, until human behavior shows observable signs of change, the baseline trajectory remains “continued high emissions.” In addition, we have now crossed the 1.5°C threshold of self-reinforcing feedbacks and tipping points.

Under the status quo, human activities are most likely to push global average surface temperatures to +4°C this century.

The consequences include:

  1. Widespread Regional Uninhabitability via Lethal Heat and Humidity
  2. Collapse of the Global Food System and Severe Water Scarcity
  3. Irreversible Tipping Points: Catastrophic Sea-Level Rise and Ecosystem Collapse

https://www.kingarthur.com/global_warming

bookmark_borderRestricted Insurance Coverage Is Transmitting Climate Risk Through the Financial System

by Daniel Brouse and Sidd Mukherjee

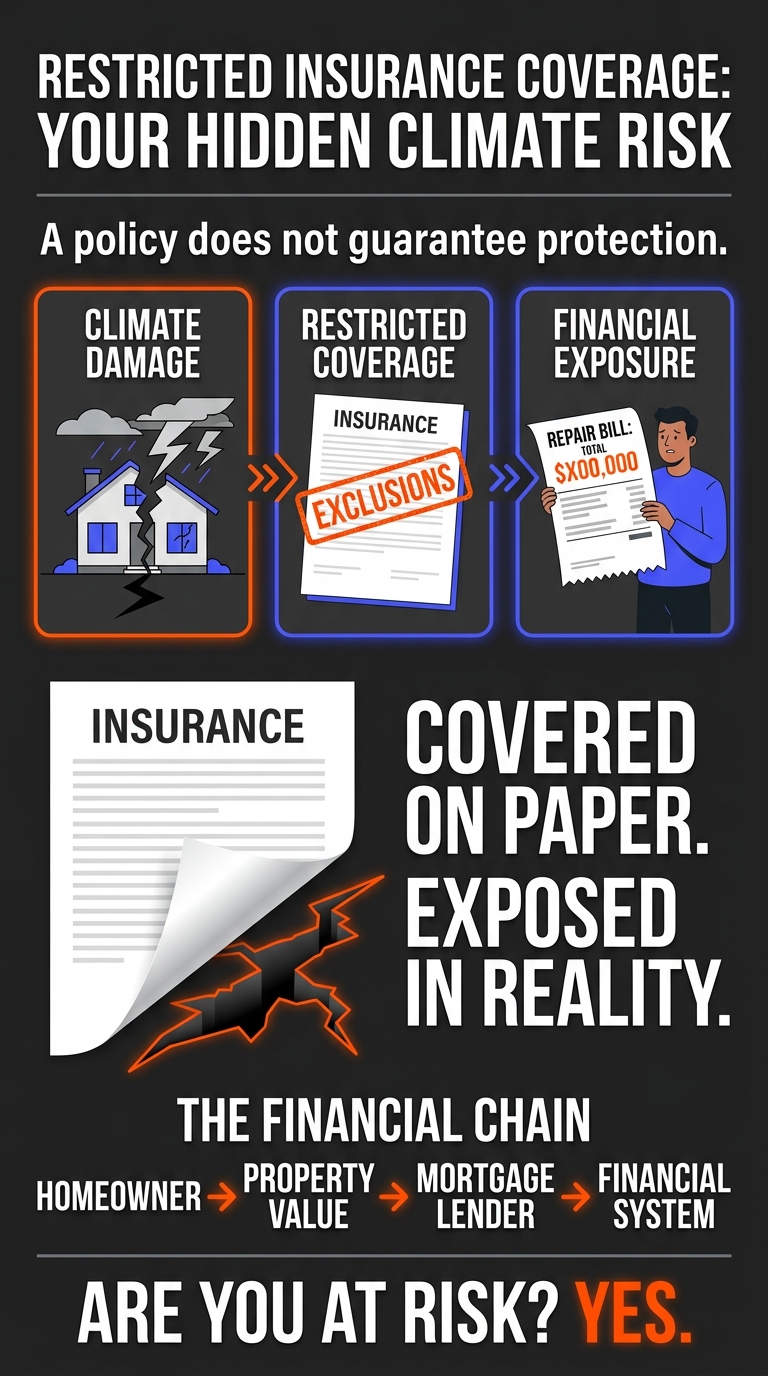
Do you have homeowners insurance? If you answered yes, do you know what is actually covered when climate change and extreme weather damage your property?

Most homeowners insurance policies exclude major categories of extreme weather damage, including flooding, while coverage for wind, hurricanes, and other hazards may be subject to significant limitations and exclusions. These restrictions are becoming more prevalent, creating one of the most significant emerging systemic risks to the global financial system.

In the United States, roof coverage is a particularly important concern. Many homeowners policies restrict roof-damage compensation through exclusions, depreciation provisions, actual-cash-value settlements, deductibles, or other limitations. Depending on the policy, a homeowner may have little chance of receiving enough compensation for a completely new roof, even when the damage is covered. As wind-related risks and losses intensify, these restrictions can leave homeowners responsible for an increasing share of repair and replacement costs.

The same principle applies to automobile insurance. If a tree is blown onto your car during a severe storm, are you covered? The answer depends on your policy, including whether you carry comprehensive coverage and whether any exclusions or limitations apply.

Climate change is already disrupting insurance markets, and the consequences extend far beyond rising premiums. Insurers are increasing prices, restricting coverage, declining renewals, and withdrawing from markets. These developments are creating growing financial vulnerabilities for homeowners, mortgage lenders, investors, businesses, and governments.

One of the most dangerous—and least understood—parts of this crisis is the expansion of restricted coverage. When an insurer refuses to cover a property, the problem is obvious. When a policy remains in force but excludes important risks, limits payouts, or imposes conditions that leave substantial losses uncovered, the danger is hidden. Homeowners may continue paying premiums believing they are protected, only to discover after a disaster that their policies do not cover the damage they suffered.

This is the delayed-disclosure trap: the financial vulnerability exists before the disaster, but its full consequences may not become apparent until a claim is denied or severely limited. By then, the homeowner may face repair costs, continuing mortgage obligations, and a damaged property without the insurance proceeds expected to cover the loss.

Restricted coverage can therefore undermine property values and mortgage security even when insurance remains available. A property may appear insured on paper while carrying substantial uninsured exposure. As these gaps widen, the distinction between having an insurance policy and having adequate financial protection has become increasingly important.

These developments are part of a larger system of interconnected feedbacks. Climate-related losses drive insurance costs higher and encourage insurers to limit their exposure. Higher costs and narrower protection weaken housing affordability and can depress property values. Declining property values and inadequate coverage increase financial risks for lenders and investors. When private insurance retreats, more costs shift to homeowners, businesses, and governments. These additional burdens can weaken the financial resources needed to prevent, withstand, and recover from future climate-related losses.

The central finding is that this feedback crisis is already underway. Rising premiums, insurance withdrawals, coverage restrictions, and growing exposure to uninsured losses are observable market developments. The interactions among these forces create additional risks that can reinforce one another, extending climate-related financial stress well beyond the locations directly affected by disasters.

The ultimate danger is not simply that insurance becomes more expensive. It is that insurance increasingly fails to provide the protection that households, lenders, and financial markets depend on. As this happens, climate risk has become a broader housing, credit, and economic crisis.

The Feedback Crisis Has Already Begun

The Whistleblower Warning: A Campaign to Expand Restricted Coverage

A memo by insurance-industry whistleblowers documents a disturbing development: the insurance industry is already well underway in what the whistleblowers characterize as a subversive campaign to expand restricted coverage, shifting financial risks onto homeowners without their full awareness.

The significance of this warning cannot be overstated. The expansion of restricted coverage changes the nature of the insurance crisis. The problem is no longer limited to rising premiums, canceled policies, or insurers refusing to cover high-risk properties. It also involves the erosion of protection within policies that homeowners continue to purchase and rely upon.

When insurers restrict coverage through exclusions, payout limitations, depreciation provisions, and other policy conditions, they can reduce their own exposure while transferring a greater share of potential losses to policyholders. When those restrictions are not adequately understood by homeowners, the transfer of risk can occur without a corresponding understanding of the financial consequences.

This creates a fundamental imbalance. Homeowners continue paying premiums and may reasonably believe they have protection against major property losses. Yet the actual terms of their policies may leave them responsible for substantial costs following a disaster. The gap between perceived protection and actual coverage can remain hidden until a claim is denied or the insurance payment falls far short of the amount needed to repair or replace damaged property.

The whistleblower warning therefore adds a critical dimension to the delayed-disclosure trap. Financial exposure is not simply increasing because climate-related disasters are becoming more costly. It is also increasing because the insurance protection intended to absorb those losses is being restricted, potentially without homeowners fully recognizing the changes.

The systemic consequences extend beyond individual households. Mortgage lenders may hold collateral whose owners cannot adequately insure or repair it. Investors may underestimate the uninsured exposure embedded in real estate portfolios. Communities may face declining property values and a growing burden of unrecoverable losses. When private insurance transfers more risk to homeowners, the resulting costs do not disappear. They are redistributed through household finances, mortgage markets, lending institutions, businesses, and ultimately, in some circumstances, governments and taxpayers.

This is the critical distinction: an insurance policy can remain active while the financial protection it provides deteriorates. Consequently, policy counts and insurance availability alone can understate the growth of climate-related financial risk.

The whistleblower allegations point to the need for scrutiny not only of insurance prices and market withdrawals, but also of how coverage restrictions are introduced, disclosed, and enforced. Regulators and policymakers must examine whether homeowners can readily understand the risks they are assuming, whether policy changes are adequately communicated, and whether the actual protection provided remains consistent with reasonable expectations.

If the documented practices are as extensive as the whistleblowers contend, the expansion of restricted coverage represents more than an insurance-market adjustment. It is a mechanism through which climate-related financial risk is being transferred to households while remaining largely concealed from homeowners, lenders, investors, and the broader financial system.

That makes restricted coverage a particularly dangerous link in the climate feedback crisis. The physical risk can increase, the financial protection can weaken, and the resulting vulnerability can remain hidden until a disaster exposes the full extent of the loss.

The Protection Gap Is a Critical Link in the Climate Feedback Crisis

The climate-insurance crisis is already unfolding. Rising premiums, restricted coverage, nonrenewals, and insurer withdrawals are changing the financial risks associated with property ownership. These are not merely forecasts of what might happen in a warmer future. They are observable developments whose economic consequences are already being felt.

Restricted coverage deserves particular attention because it can conceal financial exposure rather than eliminate it. When a policy excludes an increasingly important hazard, limits the amount payable, or imposes conditions that prevent a full recovery, the homeowner may remain exposed even while paying for insurance. The inadequacy of that protection may not become apparent until a disaster triggers a claim.

This delayed disclosure creates a dangerous mismatch between perceived security and actual financial resilience. Homeowners may believe their properties are protected. Mortgage lenders may assume that required insurance adequately safeguards their collateral. Investors may underestimate the exposure embedded in real estate portfolios. Yet a property with substantial uninsured risk can suffer serious financial damage even when an insurance policy remains active.

The consequences can reinforce one another. Climate-related damage increases insurance losses. Insurers respond through higher premiums, tighter policy terms, exclusions, and withdrawals. These changes increase ownership costs and expose homeowners to losses they cannot readily absorb. Property values and mortgage security can weaken, while financial distress, defaults, repair costs, and public financial obligations may rise. Governments and taxpayers can then inherit a larger share of the burden.

The feedback does not end there. When households, businesses, lenders, and governments must devote more resources to recovering from losses, fewer resources may remain available for risk reduction, resilience, and adaptation. If that shortfall leaves communities more vulnerable to subsequent disasters, future losses can grow, further intensifying insurance-market stress and financial instability.

This is the feedback mechanism at the heart of the crisis: climate risk increases financial vulnerability, and financial vulnerability is making society less capable of managing the next climate-related loss.

The appropriate response must therefore go beyond monitoring premiums and counting policy cancellations. Regulators, insurers, lenders, and policymakers need to examine what policies actually cover, how exclusions are changing, whether coverage limits remain adequate, and how much risk is being transferred to households and the public. Insurance availability alone is not a sufficient measure of financial protection.

The evidence establishes the need to take the observed disruption seriously and to investigate how its interacting effects are evolving. The precise scale and timing of future financial consequences remain uncertain, but the underlying feedback mechanisms are already visible. Waiting for the full consequences to emerge would mean waiting until hidden financial exposures become actual losses.

The critical question is no longer simply whether homeowners can obtain insurance. It is whether the insurance they can obtain will actually protect them when disaster strikes. As restricted coverage expands, the gap between insured property and adequately protected property has become one of the most consequential—and least visible—channels through which climate change destabilizes the economy.

Insurance can redistribute financial losses, but it cannot eliminate the physical risks that generate them. When those risks undermine the financial systems that support property ownership, lending, and investment, climate change becomes a systemic economic problem.

The insurance feedback crisis has already begun. Whether it remains manageable or develops into much broader financial instability depends on how quickly society recognizes these connections, exposes hidden coverage gaps, and acts to reduce the underlying risks.

bookmark_borderInsurance, Housing, Credit, and the Global Economy

by Daniel Brouse and Sidd Mukherjee

The Insurance Feedback Crisis: Climate Change Is Already Destabilizing Housing, Credit, and the Global Economy

How Rising Costs, Restricted Coverage, and Insurance Withdrawals Are Transmitting Climate Risk Through the Financial System

October 2026

Introduction

Climate change is already disrupting insurance markets, and the consequences extend far beyond rising premiums. Insurers are increasing prices, restricting coverage, declining renewals, and withdrawing from some markets. These developments are creating a growing financial vulnerability for homeowners, mortgage lenders, investors, businesses, and governments.

One of the most dangerous—and least understood—parts of this crisis is the expansion of restricted coverage. When an insurer refuses to cover a property, the problem is obvious. When a policy remains in force but excludes important risks, limits payouts, or imposes conditions that leave substantial losses uncovered, the danger is hidden. Homeowners may continue paying premiums believing they are protected, only to discover after a disaster that their policies do not cover the damage they suffered.

This is the delayed-disclosure trap: the financial vulnerability exists before the disaster, but its full consequences may not become apparent until a claim is denied or severely limited. By then, the homeowner may face repair costs, mortgage obligations, and a damaged property without the insurance proceeds expected to cover the loss.

Restricted coverage can therefore undermine property values and mortgage security even when insurance remains available. A property may appear insured on paper while carrying substantial uninsured exposure. As these gaps widen, the difference between having an insurance policy and having adequate financial protection becomes increasingly important.

These developments are part of a larger system of interconnected feedbacks. Climate-related losses drive insurance costs higher and encourage insurers to limit their exposure. Higher costs and narrower protection weaken housing affordability and property values. Reduced property values and inadequate coverage increase financial risks for lenders and investors. When private insurance retreats, more costs shift to homeowners, businesses, and governments. Those added burdens can weaken the financial resources needed to adapt to future climate risks.

The central finding is that this feedback crisis is already underway. Rising premiums, insurance withdrawals, coverage restrictions, and growing exposure to uninsured losses are observable market developments. The interactions among these forces are creating additional risks that can reinforce one another, extending climate-related financial stress well beyond the locations directly affected by disasters.

The ultimate danger is not simply that insurance becomes more expensive. It is that insurance increasingly fails to provide the protection that households, lenders, and financial markets depend on. When that happens, climate risk can become a broader housing, credit, and economic problem.

1. The Crisis Is Already Underway

For years, the economic consequences of climate change were discussed primarily in terms of future damage: projected disaster losses, future insurance costs, declining property values, and the possibility that some regions would eventually become uninsurable.

That framing is increasingly inadequate.

In vulnerable markets, insurance premiums have already risen sharply, coverage has become more restrictive, and some insurers have stopped writing new policies or withdrawn from particular areas. Property owners are confronting higher deductibles, policy nonrenewals, and fewer affordable alternatives. Public insurance programs have assumed greater importance in some jurisdictions where private coverage has become difficult to obtain.

These are present market developments, not merely projections.

Their significance extends beyond the insurance industry. Insurance is part of the financial infrastructure supporting property ownership, mortgage lending, commercial investment, and infrastructure development. When that infrastructure becomes more expensive or less accessible, the effects propagate into other sectors.

The emerging pattern is therefore not simply:

Climate change → More expensive disasters.

It is:

Climate change → Physical losses → Insurance disruption → Financial stress → Reduced economic resilience → Greater vulnerability to subsequent losses.

The final stages of this chain can feed back into the original problem. Households with fewer financial resources have less capacity to improve their properties. Municipalities under fiscal pressure have less flexibility to invest in protective infrastructure. Businesses facing higher insurance and borrowing costs may defer resilience investments.

The result is a system in which the costs of climate change can make society less capable of absorbing the next climate-related shock.

The insurance market is already exposing this vulnerability.

2. The Industry Is Warning About the Same Systemic Mechanism

The October 14, 2026, memorandum Sounding the Alarm, published by Inside Track x (Re)Insurance, describes concerns reported by senior professionals in the UK and European insurance, reinsurance, and brokerage sectors.

The memo identifies three principal responses to increasing physical risk:

  1. Higher premiums as insurers attempt to price expected losses and uncertainty.
  2. Restricted coverage as insurers narrow the risks they will accept.
  3. Market withdrawal when exposure cannot be made commercially viable.

All three responses are already familiar features of stressed insurance markets.

An insurer can reduce its own exposure by refusing to renew a policy. A reinsurer can protect its capital by increasing prices or reducing capacity. An underwriting department can improve its financial position by avoiding properties it considers too risky.

But none of these decisions removes the physical hazard.

Instead, the financial responsibility moves elsewhere. Homeowners retain more risk. Businesses absorb higher costs. Lenders face greater uncertainty about collateral. Governments confront greater pressure to support disaster recovery and provide insurance alternatives.

This creates a structural conflict between the financial stability of individual institutions and the financial stability of the broader economy.

The memo also warns that commercial incentives, limitations in catastrophe modeling, and fragmented assessments of exposure can prevent the industry from fully recognizing systemic risk.

The central warning reinforces an increasingly important conclusion: conventional risk management can protect individual institutions without adequately protecting the economic system in which they operate.

Restricted Coverage

Insurance is caught in a delayed-disclosure trap. When a homeowner cannot obtain coverage, the problem is immediately apparent. But an equally serious—and less visible—risk is the growing restriction of coverage. Policies may contain exclusions, limitations, and coverage gaps buried in the fine print, leaving homeowners exposed to losses they believe are insured. As insurers respond to rising risks and losses, these restrictions are expanding. The danger often becomes clear only after a disaster, when homeowners discover that their policies do not cover the damage. By then, it is too late to obtain the protection they thought they had.

3. The First Feedback Loop: Physical Losses Drive Insurance Disruption

The initial feedback begins with physical climate risk.

Flooding, wildfire, severe storms, extreme heat, and other hazards can damage buildings, interrupt businesses, destroy infrastructure, and increase claims. The consequences depend on the hazard, location, exposure, and vulnerability of the assets involved.

As insurers experience losses or revise their expectations of future losses, they adjust prices and coverage.

The initial sequence is direct:

Physical risk increases → Expected losses or uncertainty increase → Premiums rise and coverage tightens.

This relationship is already reflected in insurance-market decisions.

The feedback becomes more consequential when higher premiums and restricted coverage affect the financial viability of the properties being insured.

Insurance is not merely another household expense. It is part of the cost of maintaining property, satisfying mortgage requirements, operating a business, and attracting investment.

When insurance costs increase faster than household income or business revenue, the resulting financial pressure can become difficult to absorb. When suitable coverage disappears altogether, the problem changes from affordability to insurability.

The original physical risk has now produced a financial consequence that can persist even after a particular disaster ends.

A homeowner whose property survives a storm may still face a higher renewal premium. A business that escapes direct damage may still experience higher insurance costs. A community that avoids a catastrophic event may nevertheless face market repricing as insurers reassess its exposure.

This is the first critical transition: climate risk is no longer expressed exclusively through damage after a disaster. It is increasingly expressed through the cost and availability of financial protection before the next disaster occurs.

4. The Second Feedback Loop: Insurance Costs Pressure Property Values

Property values depend on more than a building’s physical condition and location. They also depend on the expected costs of ownership, the availability of financing, and the risks associated with future use.

Insurance disruption affects all three.

When premiums rise, the total cost of owning a property increases. When deductibles rise or coverage becomes less comprehensive, owners retain more potential financial loss. When insurers withdraw, buyers may have difficulty obtaining the coverage required by lenders or may have to accept more expensive alternatives.

These conditions can weaken demand for exposed properties.

The resulting feedback is:

Higher insurance costs → Higher ownership costs → Reduced affordability and buyer demand → Downward pressure on property values.

The process is already evident in the way insurance availability has become a growing consideration in real-estate transactions and property-risk assessments. Its magnitude varies by market, and a premium increase alone does not prove that property values have declined. But the economic mechanism is straightforward.

A property can lose economic value without suffering new physical damage. If buyers anticipate years of higher insurance costs, recurring flood losses, or difficulty obtaining a mortgage, they may be willing to pay less for it.

This creates a new form of climate-related financial exposure: the risk that the cost of protecting an asset undermines the value of owning it.

The implications are substantial because residential property represents a major share of household wealth. Commercial property supports business operations, employment, and investment. Property values also contribute to local tax revenues.

As insurance-related affordability problems spread, the consequences can extend beyond individual property owners into household balance sheets, commercial activity, and municipal finance.

5. The Third Feedback Loop: Property Risk Becomes Credit Risk

Mortgage lending depends on borrowers’ ability to repay their loans and on the value of the assets securing those loans.

Insurance supports both sides of that arrangement. It protects against specified losses that could impair collateral, while its premiums form part of the borrower’s ongoing cost of ownership. As insurance becomes more expensive or less available, both protections can weaken.

Higher premiums increase the monthly cost of homeownership. For financially constrained borrowers, that additional expense can reduce the ability to meet mortgage payments and other obligations. At the same time, inadequate coverage can leave a property owner and lender more exposed to the financial consequences of damage. If insurance difficulties reduce property demand or values, the collateral securing outstanding loans may also weaken.

The resulting feedback is:

Insurance disruption → Higher ownership costs and greater retained losses → Mortgage stress and weaker collateral → Increased credit risk.

The systemic concern is concentration. If insurance affordability deteriorates across a large number of properties in the same region, the financial consequences can occur together. Lenders may face correlated risks rather than isolated borrower problems. That possibility is particularly important where local economies, property tax revenues, employment, and household wealth are heavily dependent on real estate.

The risk is already being transmitted into financing decisions where insurance availability affects property transactions and underwriting. The connection between insurance and credit is established. The growing importance of climate-related insurability makes that connection increasingly consequential.

6. The Fourth Feedback Loop: Reinsurance Can Amplify Market Stress

Reinsurance provides financial protection to insurance companies against large or concentrated losses. It helps primary insurers manage their exposures and maintain the capacity to write policies. But reinsurance is itself exposed to catastrophe risk.

When reinsurers reassess expected losses or uncertainty, they may increase prices, change coverage terms, reduce available capacity, or require primary insurers to retain more risk. Primary insurers then face additional financial pressure. They may raise premiums, tighten underwriting, reduce policy limits, or withdraw from markets where acceptable returns cannot be achieved.

The feedback is:

Higher catastrophe losses or uncertainty → Reinsurance pressure → Higher primary-insurance costs or reduced capacity → Less affordable and less available coverage → Greater financial exposure outside the insurance system.

This process can spread the effects of physical risk beyond the location where a disaster occurs. An insurer’s response depends on its portfolio, reinsurance contracts, capital position, and exposure to multiple regions. The important point is that reinsurance does not eliminate catastrophe risk. It redistributes that risk through another layer of the financial system. If multiple insurers and reinsurers simultaneously reassess similar exposures, their decisions can reinforce market-wide tightening.

The October 2026 memo’s concern about interconnected risk is particularly relevant here. A firm may manage its own exposures prudently while the combined decisions of many firms reduce the capacity available to the wider economy.

The memo reinforces the need to monitor the relationship between physical losses, reinsurance costs, primary-market availability, and the financial resources available to absorb future losses.

7. The Fifth Feedback Loop: Public Intervention Transfers Costs to Taxpayers

As private insurance becomes unaffordable or unavailable, governments face growing pressure to intervene.

Public responses can include insurance programs of last resort, disaster assistance, infrastructure repairs, emergency housing, subsidized mitigation, and other forms of financial support.

Such measures can protect households and communities from immediate hardship. They can also preserve economic activity when private insurance capacity is insufficient. But they do not eliminate the physical losses. They redistribute part of the cost to public budgets.

The resulting feedback is:

Insurance withdrawal → Greater uninsured exposure → Increased demand for public support → Higher public expenditure and contingent liabilities → Greater fiscal pressure.

If the same communities repeatedly experience damaging events, governments may face recurring costs rather than a single temporary emergency. Meanwhile, the underlying economic base may weaken. Property values can come under pressure, businesses can suffer interruptions, and residents may relocate or reduce spending. These changes can reduce local revenues just as the need for public spending increases. The resulting fiscal squeeze is a direct consequence of the interaction between physical risk and financial vulnerability.

It is already visible in the expanding importance of public insurance and disaster-recovery arrangements in some exposed markets. The long-term fiscal consequences will depend on the scale of future losses, policy design, tax capacity, and the effectiveness of adaptation.

The danger is that public intervention can become a substitute for reducing underlying risk. If subsidies keep vulnerable properties insured without improving their resilience, governments may accumulate liabilities while leaving the physical exposure largely unchanged.

A sustainable response must therefore combine financial assistance with measures that reduce expected losses.

8. The Sixth Feedback Loop: Financial Stress Can Reduce Resilience

The preceding mechanisms reveal a more troubling feedback: the financial consequences of climate risk can reduce the capacity to manage future climate risk.

Consider a household facing higher premiums, a larger deductible, and rising repair costs. It may have less money available to install flood protection, replace a vulnerable roof, improve drainage, or strengthen the property against future damage.

Consider a municipality facing repeated disaster-recovery expenses and declining property revenues. It may have less capacity to upgrade stormwater infrastructure, maintain protective systems, or invest in long-term resilience.

Consider a business facing higher insurance and borrowing costs. It may delay investments that would otherwise reduce its exposure to future hazards.

The resulting feedback is:

Climate losses → Higher financial costs → Reduced capacity for adaptation → Greater vulnerability to subsequent losses.

This is a critical transition from a sequence of separate financial problems to a self-reinforcing system.

The original hazard creates damage or increases expected losses. Those losses generate financial pressure. Financial pressure constrains adaptation. Reduced adaptation leaves assets more exposed to future hazards. The next event then encounters a system that may be less prepared than before.

This mechanism is not merely theoretical. The financial constraints on households, municipalities, and businesses are real, and the need to pay for insurance and recovery competes with the need to invest in resilience.

9. The Combined Feedback System Is More Dangerous Than Any Individual Effect

The six feedbacks are interconnected.

Higher physical losses can raise insurance and reinsurance costs. Higher insurance costs can weaken property affordability. Reduced affordability can affect demand and financing. Weaker property values can increase credit risk and undermine local tax revenues. Public intervention can shift losses to taxpayers. Financial pressure can then reduce the resources available for adaptation.

These are not independent problems. They form a connected system in which stress in one sector can reinforce stress elsewhere.

The combined mechanism can be represented as follows:

Climate-related physical losses

↓

Higher insurance and reinsurance costs; restricted coverage and withdrawals

↓

Higher property ownership costs and greater uninsured exposure

↓

Weaker affordability, property demand, and financing conditions

↓

Increased mortgage vulnerability and public financial pressure

↓

Reduced resources for adaptation and recovery

↓

Greater vulnerability to future losses

The final step closes the feedback loop.

The significance is that the total economic effect can exceed the direct cost of any individual disaster. Financial interactions can prolong losses, transmit them to unaffected sectors, and weaken the capacity to recover. This is why insurance-market stress deserves attention as a systemic economic warning rather than simply an industry problem.

It also explains why waiting for an insurer or a major bank to fail would be the wrong approach. Financial instability can develop through declining affordability, reduced coverage, weaker investment, and growing public liabilities long before a dramatic institutional failure occurs.

The feedbacks do not need to culminate in a global financial collapse to cause substantial economic damage. They are already imposing persistent costs on households, businesses, and governments.

10. Why the 2008 Financial Crisis Is a Warning

The October 2026 industry memo compares the potential consequences of widespread uninsured property risk with vulnerabilities associated with the 2008 mortgage-market crisis. The comparison is useful because it highlights how problems involving property and credit can spread through interconnected financial relationships.

The 2008 crisis involved mortgage underwriting failures, excessive leverage, complex financial instruments, and weaknesses in financial oversight. Climate-related insurance disruption has a different underlying driver: changing physical risk and the difficulty of financing assets exposed to that risk.

The important similarity is the transmission mechanism. In both cases, problems involving the value, financing, or risk assessment of property can extend into lending and broader financial markets.

Climate-related insurance disruption can undermine property finance if coverage becomes unavailable, ownership costs rise sharply, or collateral values weaken. If these developments occur across many regions simultaneously, they could contribute to a broader financial shock.

The lesson is to recognize interconnected vulnerabilities before they become acute. Regulators and financial institutions should not wait for widespread defaults to begin evaluating how insurance-market disruption could affect lending, collateral, and public finance.

11. What the Evidence Already Shows

Observed developments

Insurance markets in several exposed regions are experiencing higher premiums, coverage restrictions, nonrenewals, and insurer withdrawals. Public insurance and disaster-assistance arrangements are increasingly important in some markets. Insurance availability is also an increasingly significant factor in property transactions and financial risk assessment.

These developments establish that insurance-market stress is already occurring.

Established economic mechanisms

Insurance costs affect property ownership expenses. Coverage requirements influence mortgage financing. Property values affect collateral. Reinsurance influences primary-market capacity. Public disaster spending affects government budgets.

These relationships provide a sound basis for evaluating how insurance disruption can transmit financial pressure across the economy.

Emerging systemic feedbacks

The interaction of insurance costs, property affordability, mortgage exposure, public liabilities, and reduced adaptation capacity creates a credible pathway toward self-reinforcing economic stress.

Uncertain outcomes

The crisis is already observable in its component parts. The systemic danger is that those parts can reinforce one another faster than institutions respond.

12. The Policy Response Must Address the Feedbacks, Not Just the Symptoms

The appropriate response is not simply to subsidize insurance premiums or require insurers to maintain coverage regardless of risk.

Those measures may provide temporary relief, but they cannot eliminate physical hazards. If they suppress risk signals without reducing exposure, they may encourage continued investment in vulnerable locations and transfer increasingly large liabilities to taxpayers.

A more effective response must address the causes and interactions of the feedback system.

Reduce the underlying physical risk

Greenhouse gas emissions influence long-term warming and many associated hazards. Reducing emissions limits additional future climate risk, although it cannot prevent all near-term losses.

Mitigation must be accompanied by adaptation because significant physical risks already exist.

Improve the resilience of exposed assets

Building standards, flood protection, drainage improvements, wildfire mitigation, resilient infrastructure, and risk-informed land use can reduce expected losses.

Investments should be evaluated against transparent estimates of their costs, benefits, maintenance requirements, and remaining exposure.

Where protection is not physically or economically sustainable, policymakers must consider fair and orderly relocation rather than assuming every property can be protected indefinitely.

Monitor the entire financial transmission chain

Regulators should examine insurance affordability and availability alongside mortgage performance, property values, reinsurance capacity, bank exposure, and public liabilities.

Stress tests should include scenarios in which insurance markets tighten across multiple regions at the same time.

The objective should be to identify correlated exposure before it generates substantial financial losses.

Improve catastrophe-model transparency

Insurers and reinsurers should clearly disclose material assumptions and uncertainties in their risk assessments. Independent review should investigate credible concerns about commercial pressure, inadequate data, and the underestimation of changing hazards.

The goal is to ensure that decisions reflect defensible estimates of risk rather than incentives to understate it.

Protect vulnerable households without concealing risk

Public support may be necessary to prevent immediate hardship and preserve access to essential coverage. But support should be linked, where appropriate, to mitigation, stronger building practices, and realistic assessments of long-term exposure.

A policy that preserves coverage without reducing the underlying risk defer costs rather than solve the problem.

13. Conclusion: The Feedback Crisis Has Already Begun

The Protection Gap Is a Critical Link in the Climate Feedback Crisis

The climate-insurance crisis is already unfolding. Rising premiums, restricted coverage, nonrenewals, and insurer withdrawals are changing the financial risks associated with owning property. These are not merely forecasts of what might happen in a warmer future. They are observable developments whose economic consequences are already being felt.

Restricted coverage deserves particular attention because it can conceal financial exposure rather than eliminate it. When a policy excludes an increasingly important hazard, limits the amount payable, or imposes conditions that prevent a full recovery, the homeowner may remain exposed even while paying for insurance. The inadequacy of that protection may not become apparent until a disaster triggers a claim.

This delayed disclosure creates a dangerous mismatch between perceived security and actual financial resilience. Homeowners may believe their properties are protected. Mortgage lenders may assume that required insurance adequately safeguards their collateral. Investors may underestimate the exposure embedded in real estate portfolios. Yet a property with substantial uninsured risk can suffer serious financial damage even when an insurance policy remains active.

The consequences can reinforce one another. Climate-related damage increases insurance losses. Insurers respond through higher premiums, tighter terms, exclusions, and withdrawals. Those changes increase ownership costs and expose homeowners to losses they cannot readily absorb. Property values and mortgage security can weaken, while defaults, repair costs, and public financial obligations may rise. Governments and taxpayers can then inherit a larger share of the burden. If these pressures reduce the resources available for prevention and adaptation, future losses can become even greater.

This is the feedback mechanism at the heart of the crisis: climate risk increases financial vulnerability, and financial vulnerability can make society less capable of managing the next climate-related loss.

The appropriate response must therefore go beyond monitoring premiums and counting policy cancellations. Regulators, insurers, lenders, and policymakers need to examine what policies actually cover, how exclusions are changing, whether coverage limits remain adequate, and how much risk is being transferred to households and the public. Insurance availability alone is not a sufficient measure of financial protection.

The evidence establishes the need to take the observed disruption seriously and to investigate how its interacting effects are evolving. The precise scale and timing of future financial consequences remain uncertain, but the underlying feedback mechanisms are already visible.

The critical question is no longer simply whether homeowners can obtain insurance. It is whether the insurance they can obtain will actually protect them when disaster strikes. As restricted coverage expands, the gap between insured property and adequately protected property may become one of the most consequential—and least visible—channels through which climate change destabilizes the economy.

Insurance can redistribute financial losses, but it cannot eliminate the physical risks that generate them. When those risks undermine the financial systems that support property ownership, lending, and investment, climate change becomes a systemic economic problem.

The feedback crisis has already begun. Whether it remains manageable or develops into much broader financial instability depends on how quickly society recognizes the connections and acts to reduce the underlying risks.


References and Further Reading

Primary industry source

Inside Track x (Re)Insurance. (October 14, 2026). Sounding the Alarm: Insurance and Reinsurance Memo.

https://static1.squarespace.com/static/697b3c8cf1bdde2c6ff1b5d5/t/6acebb5992f73c3954b746e5/1791933273139/Insurance+and+Reinsurance+Memo.pdf

This memo provides the principal industry perspective on physical risk, insurance repricing, coverage restrictions, market withdrawal, catastrophe modeling, and systemic financial vulnerability. Its findings should be interpreted in light of its aggregated and anonymized methodology.

Related research

Brouse, D., and Mukherjee, S. Climate Change and the Insurance Crisis: Rising Costs, Shrinking Availability, and the Limits of Insurability.

https://www.kingarthur.com/global_warming/Insurance-Cost-and-Availability.html

Brouse, D., and Mukherjee, S. Climate Change and Insurance: Costs, Availability, and Sustainability.

https://www.kingarthur.com/global_warming/Insurance-Cost-and-Availability-2025.html

Brouse, D., and Mukherjee, S. The Collapse Point: How Climate Change Is Breaking Insurance—and Capitalism With It.

https://www.kingarthur.com/global_warming/Insurance-Economic-Climate-Collapse.html

Brouse, D., and Mukherjee, S. Climate Risk, Insurance Market Instability, and Systemic Threats to Capital Formation.

https://www.kingarthur.com/global_warming/Insurance-Collapse-intro.html

Brouse, D. Financial Planning for Climate Change.

https://www.kingarthur.com/global_warming/Financial-Planning-for-Climate-Change.html

Brouse, D., and Mukherjee, S. Coupled Climate Feedbacks and Cascading Real Estate Risk.

https://www.kingarthur.com/global_warming/Feedbacks-Cascading-Real-Estate-Risk.html

Methodological note

This paper synthesizes an industry memorandum, related climate-insurance research, and established economic mechanisms. It does not present a new statistical model or independently estimate the probability of a global financial crisis. Claims about observed insurance-market disruption are distinct from claims about the magnitude of interconnected feedbacks or the timing of future systemic outcomes. Those latter questions require continued empirical investigation using insurance, reinsurance, property, credit, and public-finance data.
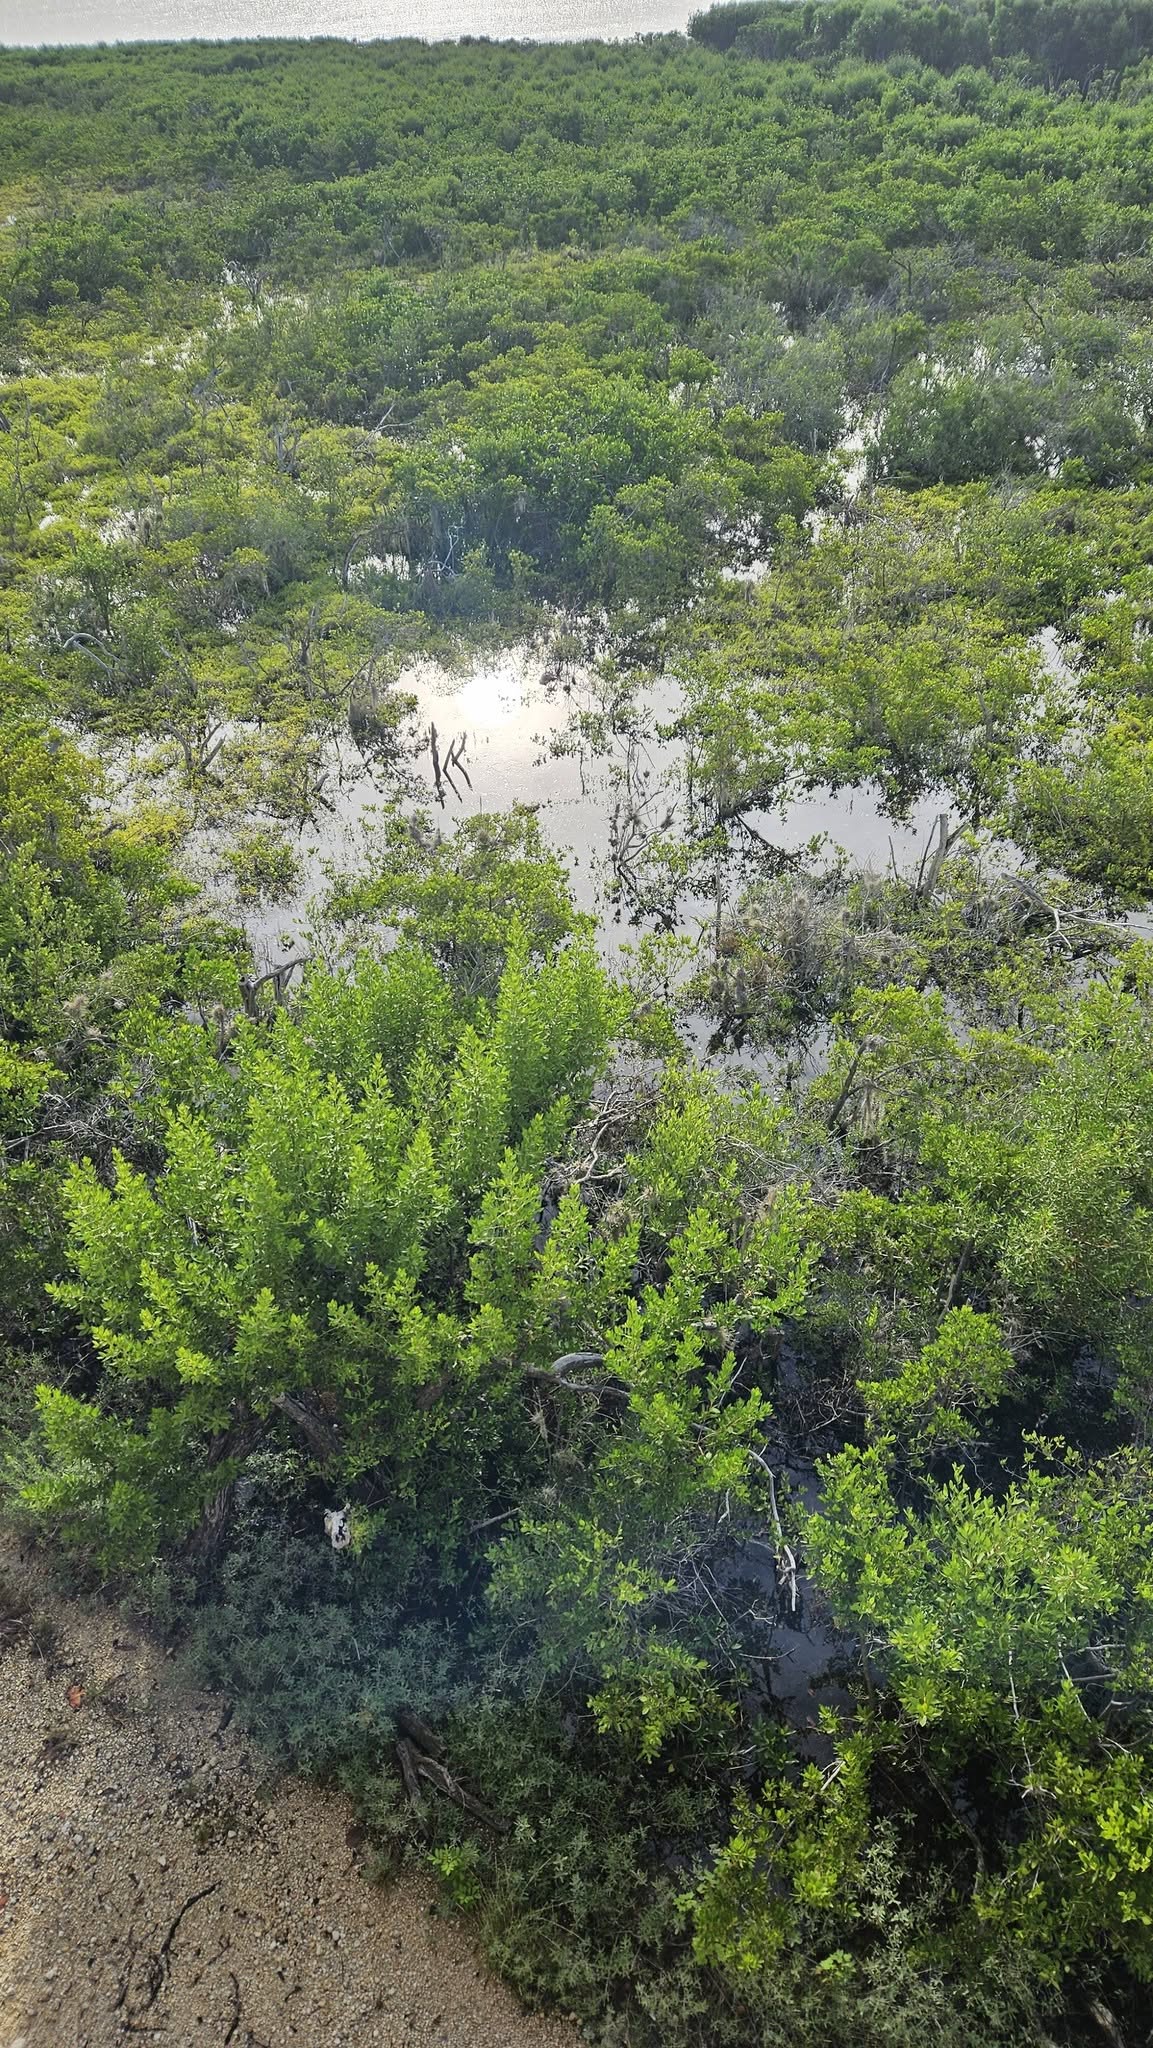
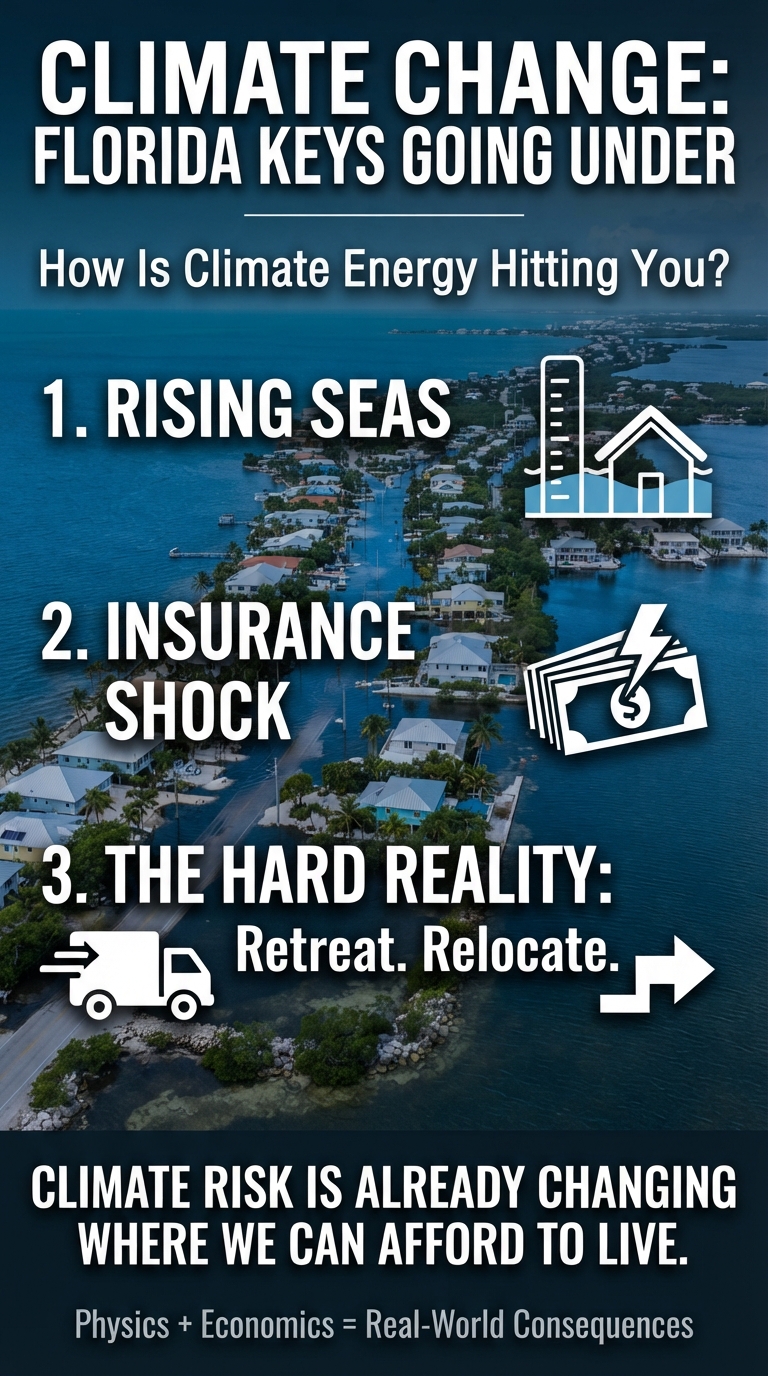
bookmark_borderThe Solution Is Balance: Making Climate Action Work for Everyone

A Practical Path to a Healthier Planet and a Better Life

Climate change is more than a problem of rising temperatures. It affects our homes, food supplies, health, economy, and the natural systems that support life. Addressing it requires science, practical solutions, shared values, and cooperation.

But there is a challenge: people are busy trying to make ends meet. They have bills to pay, families to support, and communities to protect. Climate action must address these everyday concerns if it is to gain lasting public support.

Two complementary ideas offer a way forward: Climate Popularism and the Covenant of Balance.

Start With What Matters to People

Climate Popularism, developed by Caroline Lucas and Rupert Read, argues that climate action should connect with the things people care about most.

Lower energy bills. Affordable food. Reliable transportation. Comfortable homes. Cleaner air and water. Safer communities.

These are not separate from climate action. Many practical improvements can help meet these needs while also reducing pollution and preparing communities for future risks.

For example, improving home insulation can reduce energy use and heating costs. Better public transportation can make travel more affordable. Protecting forests and restoring natural areas can support wildlife, protect water supplies, and help communities manage heat and flooding.

The goal is to make climate action useful in people’s daily lives.

What Does Balance Mean?

The Covenant of Balance builds on this practical approach by connecting climate science with shared ethical principles.

Earth is an interconnected system. The atmosphere, oceans, forests, soils, and living things all affect one another. Human life and our economy depend on these systems working well.

Climate change is one sign that this system is being pushed out of balance.

Earth receives energy from the Sun and releases energy back into space. Greenhouse gases from human activities trap additional heat, causing Earth’s climate system to gain energy. The oceans absorb most of this excess heat, while temperatures rise, ice melts, sea levels increase, and ecosystems change.

These effects can also interact. For example, when ice melts, darker surfaces are exposed. These surfaces absorb more sunlight, adding further warming.

Understanding these connections helps explain why reducing greenhouse gas emissions and protecting natural systems are both essential.

Balance does not mean that nature must never change. It means respecting the conditions that allow people and other living things to thrive.

Integrated Climate Stewardship: ZERO-OUT + BENEFIT-IN

Integrated Climate Stewardship’s guiding formula is simple:

ZERO-OUT + BENEFIT-IN

ZERO-OUT means reducing actual sources of harm. This includes cutting greenhouse gas emissions, wasting less energy, reducing pollution, and using fewer resources when doing so makes sense.

BENEFIT-IN means choosing improvements that also provide real benefits to people. These may include lower bills, better comfort, improved health, stronger local economies, and greater protection against extreme weather.

Consider a home that uses less energy for heating and cooling. The household may save money while also reducing pollution associated with energy use. A community that reduces food waste can save resources and lower disposal costs. A town that protects trees and improves stormwater management can create healthier neighborhoods while reducing certain local risks.

Not every project will produce every benefit. Costs, safety, local conditions, and actual environmental results must be considered.

The important point is to look for solutions that work in the real world.

Balance the Economy With the Environment

A healthy economy depends on healthy natural systems. Businesses need reliable supplies of water, energy, food, materials, and other resources. Communities need safe homes, functioning infrastructure, and a healthy population.

Economic growth that ignores environmental damage can create costs that others must eventually pay.

A better approach asks whether an activity meets a real need, whether it can be done with fewer resources, and whether its benefits justify its full costs.

This does not require rejecting markets, business, economic growth, or new technology. It means accounting for environmental damage rather than treating it as someone else’s problem.

Practical climate solutions should also consider fairness. Families with limited incomes may struggle to afford improvements even when those improvements would save money over time. Public programs, better financing, and community cooperation can help make effective solutions accessible to more people.

From Individual Action to Community Progress

Personal choices matter, but individual households cannot solve climate change by themselves.

Electricity generation, industry, transportation, agriculture, buildings, and public policy all play important roles. Businesses and governments must also reduce pollution and invest in practical improvements.

Communities can help by sharing useful information, improving public infrastructure, supporting vulnerable residents, and measuring progress openly.

The same standard should apply to everyone: look at the results.

Are emissions falling? Is energy being used more efficiently? Are costs manageable? Are communities becoming safer? Are natural systems being protected?

Good intentions are important, but measurable results are essential.

The Solution Is Balance

Climate Popularism offers a way to connect climate action with people’s everyday needs. The Covenant of Balance adds a broader ethical foundation, bringing together science, economics, environmental responsibility, and shared values.

Integrated Climate Stewardship provides the practical link between them: reduce actual harm while seeking measurable benefits for people and the planet.

We do not need to agree on every political, religious, or economic question to make progress. We need to recognize that our choices affect one another and that our long-term well-being depends on the natural systems that sustain us.

The goal is not to make people choose between a healthy planet and a better life.

The goal is to build a future in which protecting the planet helps people live healthier, safer, more affordable, and more fulfilling lives.

Different beliefs. Shared responsibilities. Practical solutions.

The solution is balance.


See:

Climate Popularism: https://assets.climatemajorityproject.com/Climate%20popularism%206Oct26.pdf

Covenant of Balance: https://www.kingarthur.com/global_warming/Covenant-of-Balance.html

bookmark_borderHow Is Climate Energy Hitting You? Biting: The Longest Mosquito Season

by Daniel Brouse

How Is Climate Energy Hitting You?

Biting: The Longest Mosquito Season

Southeastern Pennsylvania’s 2026 mosquito season has been prolonged, with mosquito activity extending into October. A combination of spring rainfall, warm temperatures, standing water, and persistent humidity can create favorable conditions for mosquito breeding and survival, potentially extending the season beyond its traditional peak.

The extended season is another example of how changing weather patterns can affect everyday life, from outdoor comfort to public health. However, confirming that 2026 is the region’s longest mosquito season would require historical surveillance data and consistent year-to-year comparisons.

The 2026 Mosquito Season: A Timeline

Early Start (April–May)

Warmer spring temperatures and rainfall can accelerate mosquito development and bring earlier seasonal activity. Standing water in yards, storm drains, and other locations provides breeding habitat. Establishing the precise start of the 2026 season requires local monitoring records.

Peak Season (June–August)

Summer heat can speed up mosquito development, while rainfall and persistent moisture can replenish breeding sites. Some mosquito species can complete their life cycle in as little as several days under favorable conditions. Urban drainage systems, containers, and low-lying areas can provide recurring sources of standing water.

Extended Autumn (September–October)

Mosquitoes can remain active well into autumn when temperatures and moisture levels remain favorable. Activity generally declines as temperatures fall, although the timing varies by species and local conditions. A hard frost can sharply reduce activity, but it does not necessarily eliminate all mosquitoes or their eggs.

Health Risks and Regional Hotspots

An extended mosquito season can prolong opportunities for exposure to mosquito-borne diseases, including West Nile virus (WNV). Actual risk, however, depends on local mosquito surveillance, virus detection, species distribution, and human exposure—not simply the length of the season.

The Vectors

Culex pipiens, commonly known as the northern house mosquito, is an important West Nile virus vector in Pennsylvania. It can thrive in urban environments, including storm drains and catch basins.

Aedes albopictus, the Asian tiger mosquito, is another important species in the region. It breeds in small collections of standing water, including water trapped in containers, and can remain active during suitable autumn weather.

West Nile Virus Surveillance

Pennsylvania and the Centers for Disease Control and Prevention monitor mosquito populations and mosquito-borne disease activity. Positive mosquito samples indicate that the virus is circulating in a particular area, but they do not, by themselves, establish the level of risk to residents.

Claims about early-season positive samples in Bucks County or other Southeastern Pennsylvania locations should be verified against the relevant 2026 surveillance records before publication.

What You Can Do

Residents can reduce mosquito breeding and exposure by taking a few practical steps:

  • Empty standing water from containers, flowerpots, buckets, and outdoor equipment.
  • Clean clogged gutters and maintain drainage around the property.
  • Use screens on windows and doors.
  • Apply an EPA-registered insect repellent according to its label.
  • Wear long sleeves and long pants when mosquitoes are active, particularly around dawn and dusk.

The Bottom Line

A longer mosquito season is more than an outdoor nuisance. It is a direct, increasingly visible consequence of a warming climate. Rising temperatures extend the period when mosquitoes can survive, reproduce, and remain active, pushing seasonal biting activity further into autumn and prolonging opportunities for exposure to mosquito-borne diseases.

Climate change is the primary long-term driver of warming temperatures and increasingly favorable conditions for extended mosquito seasons. Rainfall, humidity, standing water, mosquito species, and public-health interventions influence the severity of individual seasons, but a warming climate shifts the underlying conditions in favor of longer periods of mosquito activity.

The question is not just how much energy is accumulating in the climate system. It is how that energy translates into consequences we experience in our own backyards. In Southeastern Pennsylvania, a mosquito still biting in October offers a tangible reminder that climate change is not a distant threat. It is changing the conditions of everyday life—one bite at a time.

bookmark_borderINTEGRATED CLIMATE FEEDBACK (Alternative Version)

by Daniel Brouse

INTEGRATED CLIMATE FEEDBACK, COUPLING, AND TIPPING-POINT NETWORK

POLAR AMPLIFICATION, CRYOSPHERE, AND ICE-SHEET NETWORK

POLAR AMPLIFICATION → Arctic warming exceeding the global average → weakened equator-to-pole temperature gradients → changes in atmospheric circulation, storm tracks, and polar jet-stream dynamics → accelerated Arctic sea-ice loss + Greenland ice melt → changes in surface albedo, ocean heat exchange, freshwater input, and atmospheric stability →

ICE–ALBEDO FEEDBACK: sea-ice + snow + land-ice loss → darker ocean + land surfaces exposed → reduced surface albedo → greater absorption of incoming solar radiation during sunlit periods → additional surface warming → further ice + snow loss ↺

MELT–ELEVATION FEEDBACK: Greenland + ice-sheet surface melting → reduced ice-sheet elevation → exposure of the ice surface to warmer atmospheric conditions at lower elevations → faster surface melt → further elevation loss ↺

REGIONAL LAPSE-RATE FEEDBACK: Arctic warming → changes in the vertical atmospheric temperature gradient and atmospheric stability → altered vertical temperature contrasts + near-surface radiative cooling → enhanced near-surface warming under favorable polar conditions → additional sea-ice and surface-ice loss ↺

ARCTIC OCEAN HEAT STORAGE–WINTER SEA-ICE FEEDBACK: Arctic sea-ice loss → increased summer solar absorption by open water → increased upper-ocean heat storage → autumn + winter ocean-to-atmosphere heat release → delayed freeze-up + reduced winter sea-ice growth → further sea-ice loss ↺

COUPLED CRYOSPHERIC AMPLIFICATION: sea-ice loss + snow retreat + glacier and ice-sheet melting + permafrost thaw → reduced surface reflectivity + changes in land and ocean heat exchange + freshwater input + altered ground hydrology → atmospheric circulation changes + ocean stratification changes + additional cryospheric stress →

SNOW–ALBEDO FEEDBACK: warming → reduced snow cover + earlier seasonal snowmelt → darker land surface exposed → reduced reflectivity → increased solar absorption → additional land-surface warming → further snow loss ↺

GLACIAL-RETREAT FEEDBACK: atmospheric warming + ocean heat reaching glacier fronts → surface melting + submarine melting in susceptible regions → glacier retreat + ice discharge → changes in ice-surface elevation + local albedo + freshwater input → additional cryospheric and oceanic changes ↺ → SEA-LEVEL RISE → coastal inundation + erosion + saltwater intrusion + altered coastal ecosystems + infrastructure stress + changes in coastal carbon storage → increased environmental and socioeconomic vulnerability →

EXTREME PRECIPITATION–CRYOSPHERE FEEDBACK: warming → increased atmospheric moisture capacity + changes in precipitation intensity, phase, and seasonal distribution → altered snowfall accumulation + rain-on-snow events + surface-meltwater delivery → changes in glacier and ice-sheet mass balance + runoff + basal hydrology → changes in ice accumulation or loss → further cryospheric change ↺

WEST ANTARCTIC ICE-SHEET TIPPING ELEMENT: ocean warming + basal ice-shelf melting → ice-shelf thinning → reduced buttressing in susceptible regions → increased grounded-glacier discharge → potential marine ice-sheet instability → persistent ice loss + sea-level rise → additional coastal and cryospheric stress →

ICE-SHEET MELT–COASTAL CARBON CROSS-LINK: ice-sheet mass loss → sea-level rise → coastal flooding + erosion + saltwater intrusion → changes in wetlands, marshes, mangroves, and other coastal ecosystems → possible loss of stored carbon + reduced future sequestration → additional atmospheric CO₂ relative to a healthy-ecosystem baseline → increased greenhouse forcing where net carbon storage declines ↺

WILDFIRE–SNOW AND ICE-ALBEDO CROSS-LINK: wildfire emissions → black-carbon deposition on snow + ice → reduced reflectivity → increased solar absorption → accelerated snowmelt + glacier melt → greater exposure of darker surfaces → further absorption of solar energy ↺

BOREAL FOREST–SNOW–ALBEDO COUNTEREFFECT: boreal forest loss → increased snow exposure during snow-covered seasons → increased surface reflectivity → potential regional cooling that partially offsets greenhouse warming. At the same time, forest loss → reduced carbon storage + altered evapotranspiration + changes in surface roughness + potentially greater fire susceptibility → additional warming or ecosystem stress. Net effect depends on latitude, season, snow cover, forest type, and the balance of biogeophysical and carbon-cycle effects.

PERMAFROST–FIRE–DEEPER THAW CROSS-LINK: warming + drying → increased fire susceptibility in some permafrost landscapes → wildfire → combustion of vegetation + loss of insulating organic layers → altered ground thermal properties + deeper seasonal thaw → increased exposure of frozen organic carbon to decomposition → CO₂ + CH₄ emissions under suitable conditions → additional greenhouse forcing → further warming and thaw ↺

EARTH MASS REDISTRIBUTION–ROTATION CONNECTION: global land-ice loss + redistribution of terrestrial water and ice mass → changes in Earth’s moment of inertia + angular momentum distribution → small changes in Earth’s rotation rate, length of day, and polar motion. Groundwater depletion and redistribution also affect Earth’s mass distribution and rotation. These are geophysical consequences of mass redistribution, not independent climate feedbacks.

OCEAN HEAT CONTENT, STRATIFICATION, CARBON, AND CIRCULATION NETWORK

PLANETARY ENERGY IMBALANCE–OCEAN HEAT CONTENT: planetary energy imbalance → accumulation of excess heat in the Earth system, with the ocean absorbing the majority of the excess energy → increased ocean heat content (OHC) → changes in ocean temperature, vertical heat distribution, circulation, and ocean–atmosphere exchange → altered regional climate and cryospheric conditions →

OCEAN HEAT VARIABLES—DISTINCT BUT COUPLED: ocean heat content → total heat stored throughout the ocean; sea-surface temperature → surface conditions governing evaporation, convection, and air–sea exchange; vertical mixing + stratification → redistribution of heat between surface and deeper waters; ocean–atmosphere heat exchange → transfer of heat between ocean and atmosphere. These variables interact but are not interchangeable: increasing OHC does not require uniform surface warming or uniform warming at every depth.

ALBEDO–CLOUD–OCEAN HEAT CONTENT TRIAD: low-level cloud decline in regions and seasons where clouds exert a net cooling effect → reduced reflection of incoming shortwave solar radiation → increased absorbed solar energy → increased ocean heat uptake + OHC → ocean warming → changes in atmospheric moisture + stability + circulation → further low-level cloud decline where conditions favor the response ↺

OHC–CRYOSPHERE FEEDBACK: OHC ↑ → ocean warming + changes in vertical heat distribution → increased subsurface heat exposure to marine-terminating glaciers or ice shelves in susceptible regions → basal ice melting + ice discharge → freshwater input + ice loss → changes in ocean stratification + surface albedo → further oceanic and cryospheric changes ↺

OCEAN STRATIFICATION–MARINE HEATWAVE FEEDBACK: surface ocean warming + freshwater input → stronger upper-ocean stratification under favorable conditions → altered vertical mixing and heat redistribution → increased persistence of elevated upper-ocean temperatures in susceptible regions → marine heatwaves + ecosystem stress → changes in marine carbon uptake + air–sea heat exchange → additional regional ocean changes, with feedback direction dependent on local conditions ↺

NORTH ATLANTIC STRATIFICATION–GLACIER-FRONT HEAT FEEDBACK: Greenland meltwater + changes in precipitation and evaporation → upper-ocean freshening + altered stratification → changes in deep convection, mixing, and ocean heat redistribution → regionally altered subsurface heat delivery to marine-terminating glacier fronts where circulation permits → changes in basal melting + ice discharge → additional freshwater input ↺

OHC–AMOC FEEDBACK: OHC ↑ + changes in freshwater input + density structure + wind forcing + ocean mixing → changes in North Atlantic stratification and deep convection → potential AMOC weakening + altered ocean heat transport → regional redistribution of ocean heat → changes in subsurface heat exposure + atmospheric heat exchange + moisture transport → further oceanic, atmospheric, and cryospheric changes ↺

AMOC–CIRCULATION CROSS-LINK: AMOC changes → altered North Atlantic and hemispheric heat distribution → changes in ocean–atmosphere heat exchange + atmospheric temperature gradients → potential changes in Northern Hemisphere storm tracks, regional precipitation, and circulation → changes in Greenland melt + Arctic sea ice + freshwater distribution → further ocean and atmospheric responses. The strength and direction of the response are regionally dependent; AMOC weakening does not establish that collapse is inevitable.

AMOC–CLOUD FEEDBACK: AMOC changes → North Atlantic sea-surface temperature + circulation changes → altered moisture transport + atmospheric stability → changes in low-level cloud formation, altitude, thickness, and persistence → changes in shortwave reflection + longwave trapping → regional changes in absorbed energy → further ocean warming or cooling and potential AMOC stress, depending on the net radiative response ↺

AMOC–ICE-MELT FEEDBACK: AMOC changes → altered North Atlantic heat transport → regional ocean–atmosphere temperature redistribution → changes in Greenland + Arctic ice melt → freshwater discharge → changes in North Atlantic surface salinity + density → changes in deep-water formation and overturning circulation → potential additional AMOC weakening ↺

AMOC–STRATIFICATION–OCEAN CARBON FEEDBACK: AMOC changes + ocean warming + stratification changes → altered ventilation + nutrient transport + carbon redistribution → changes in ocean CO₂ uptake and storage → changes in atmospheric CO₂ relative to an alternative circulation scenario → altered greenhouse forcing → further ocean and atmospheric changes where net effects reinforce the original change ↺

OCEAN CARBON SINK–CIRCULATION FEEDBACK: ocean warming + stratification + circulation changes → altered CO₂ solubility + ventilation + nutrient supply + biological carbon export → changes in ocean carbon uptake and storage → changes in atmospheric CO₂ → altered radiative forcing → further climate and ocean changes ↺. The ocean remains a major carbon sink; uptake changes in magnitude and distribution rather than necessarily stopping.

OCEAN OXYGEN–ECOSYSTEM–CARBON FEEDBACK: ocean warming + stratification → reduced oxygen supply to subsurface waters in susceptible regions → deoxygenation + changes in nutrient cycling + marine ecosystem stress → altered biological carbon export + carbon storage + greenhouse-gas production in some environments → changes in ocean–atmosphere carbon exchange → additional climate forcing where net effects reinforce warming ↺

TROPICAL OCEAN VARIABILITY–GLOBAL CIRCULATION NETWORK: ENSO + other tropical ocean variability → changes in tropical sea-surface temperature patterns + convection → changes in atmospheric heating + pressure patterns + moisture transport → shifts in planetary waves, jet streams, monsoons, and storm tracks → changes in regional heat + rainfall + drought + wildfire conditions → changes in land and ocean energy, water, and carbon exchanges → further regional climate responses. Greenhouse warming changes the background conditions on which natural variability operates.

TROPICAL CIRCULATION–CLOUD–OCEAN HEAT FEEDBACK: tropical ocean warming patterns → changes in convection + atmospheric circulation + moisture transport → changes in cloud distribution + altitude + persistence + reflectivity → altered shortwave absorption + longwave trapping → changes in regional solar absorption + ocean-surface heating → changes in sea-surface temperature gradients + tropical circulation → further cloud and ocean-heat redistribution ↺

OHC–ATMOSPHERIC INSTABILITY–LIGHTNING NETWORK: ocean warming + changes in atmospheric moisture and convection → changes in convective instability in susceptible regions → changes in lightning activity → lightning-generated nitrogen oxides (NOₓ) → increased tropospheric ozone formation under suitable chemical and meteorological conditions → vegetation damage → changes in carbon uptake + evapotranspiration → changes in atmospheric moisture + clouds → altered radiation and regional climate forcing.

LOW-LEVEL CLOUDS, WATER VAPOR, AEROSOLS, AND RADIATION NETWORK

LOW-LEVEL CLOUD–OCEAN HEAT FEEDBACK: low-level cloud cover ↓ in regions and seasons where clouds exert a net cooling effect → reflected shortwave radiation ↓ → absorbed solar energy ↑ → ocean heat uptake + OHC ↑ → ocean warming + changes in atmospheric stability and moisture → changes in cloud formation + persistence → further cloud decline where the response reinforces the initial change ↺

CLOUD SHORTWAVE–LONGWAVE RADIATION BALANCE: changes in cloud cover + altitude + thickness + droplet properties + geographic distribution → changes in reflected incoming shortwave sunlight + absorption and emission of outgoing longwave radiation → changes in net cloud radiative effect → changes in planetary energy balance and regional temperatures. Low clouds often cool by reflecting sunlight; high clouds can warm by trapping outgoing infrared radiation. The net effect depends on cloud type, location, altitude, optical thickness, season, and underlying surface.

LOW-LEVEL CLOUD DECLINE–ARCTIC AMPLIFICATION CROSS-LINK: low-level cloud decline during periods and in regions where clouds have a net cooling effect → increased solar energy reaching the surface → enhanced surface and ocean warming → sea-ice loss + reduced albedo → Arctic amplification → changes in atmospheric stability + moisture + circulation → further changes in cloud formation. During polar night and cold seasons, low clouds can exert a warming effect through longwave trapping; cloud decline does not produce uniform warming in all conditions.

ATMOSPHERIC WATER-VAPOR FEEDBACK: warming → increased atmospheric water vapor where moisture is available → increased absorption of outgoing infrared radiation → stronger greenhouse trapping → additional warming → increased atmospheric moisture capacity + changes in evaporation → further water-vapor increases where moisture supply permits ↺. Water vapor is primarily a feedback on warming, while long-lived greenhouse gases are major external drivers.

AEROSOL–CLOUD–RADIATION COUPLING: wildfire smoke + industrial pollution + changing biogenic emissions + other aerosols → altered aerosol abundance + composition + particle properties → changes in cloud-droplet formation + cloud lifetime + reflectivity + precipitation → altered shortwave and longwave radiation → regional warming or cooling + hydrological changes → further vegetation stress and fire risk under favorable conditions ↺

AEROSOL COOLING COUNTEREFFECT: certain anthropogenic aerosols + volcanic aerosols → scattering or reflection of sunlight and, for some aerosols, cloud-brightening effects → reduced incoming solar energy reaching the surface → temporary cooling that partially offsets greenhouse-gas warming. Aerosol effects vary by composition, altitude, location, and cloud interactions; cooling effects do not remove the health and environmental harms of air pollution.

LOW-LEVEL CLOUD–OZONE COUPLING: tropospheric ozone → vegetation damage + altered stomatal function → changes in transpiration and surface moisture → changes in boundary-layer development + atmospheric humidity + low-level cloud formation → changes in shortwave reflection + longwave trapping → regional warming or cooling depending on cloud response → changes in ozone chemistry and vegetation stress under suitable conditions ↺

AMOC–OZONE FEEDBACK: AMOC changes + altered atmospheric circulation → changes in atmospheric chemistry + ozone-precursor transport → changes in tropospheric ozone formation and distribution → vegetation damage → reduced photosynthesis and altered stomatal conductance → changes in evapotranspiration + atmospheric moisture → changes in low-level cloud formation → altered radiation where cloud properties change → additional regional warming or cooling and possible further ocean stress. Each link is conditional on local chemistry and meteorology.

OZONE–CARBON SINK FEEDBACK: tropospheric ozone → plant injury + reduced photosynthesis and, in sensitive vegetation, altered stomatal function → reduced terrestrial carbon uptake relative to a healthier-vegetation baseline → greater atmospheric CO₂ retention → increased greenhouse forcing → additional warming → further vegetation stress and possible carbon-sink degradation under favorable conditions ↺

ATMOSPHERIC CIRCULATION, JET STREAM, AND EXTREME WEATHER NETWORK

JET-STREAM COUPLING: Arctic amplification + changes in tropical heating + stratospheric conditions + internal variability → changes in meridional temperature gradients and atmospheric circulation → changes in polar jet-stream structure + Rossby-wave propagation + storm tracks → possible changes in jet-stream waviness, progression, and blocking → persistent weather patterns in susceptible configurations → heat extremes + drought + heavy precipitation + stalled atmospheric rivers → hydroclimatic whiplash → agricultural + infrastructure + ecosystem + public-health stress → increased vegetation stress and wildfire risk → further land–atmosphere changes ↺. The effects vary by region, season, and circulation regime.

SOIL MOISTURE–EVAPOTRANSPIRATION–HEAT FEEDBACK: warming → soil drying where precipitation and water supply are insufficient → reduced soil moisture availability → reduced evaporation + plant transpiration → reduced evaporative cooling + increased sensible heat flux → higher land-surface and near-surface air temperatures → increased atmospheric moisture demand → further soil drying ↺ → increased risk of heat extremes + drought + vegetation stress + wildfire.

LAND–ATMOSPHERE DROUGHT COUPLING: prolonged heat + reduced precipitation → declining soil moisture → reduced evapotranspiration → increased near-surface sensible heating + atmospheric moisture demand → boundary-layer changes + reduced local moisture recycling → greater heat and drought stress where circulation and moisture supply reinforce the response ↺

VEGETATION–ROUGHNESS–CIRCULATION FEEDBACK: forest loss + canopy degradation → changes in surface roughness + albedo + energy and water exchange → changes in boundary-layer mixing + atmospheric stability + cloud formation + rainfall → additional heat and moisture stress where the response is reinforcing → further vegetation degradation ↺

WILDFIRE–CLOUD FEEDBACK: wildfire smoke + vegetation loss → altered aerosol loading + surface energy balance + moisture flux → changes in cloud formation + persistence → altered shortwave reflection + longwave trapping → regional warming or cooling depending on aerosol and cloud properties → precipitation disruption in susceptible conditions → greater drought and fire risk where conditions reinforce the cycle ↺

EXTREME PRECIPITATION–SOIL MOISTURE CROSS-LINK: warming → changes in atmospheric moisture capacity and precipitation extremes → intense rainfall and flooding in some regions + longer dry intervals in others → changes in soil-water storage, runoff, erosion, vegetation condition, and groundwater recharge → altered drought and flood vulnerability → further land–atmosphere and ecosystem impacts.

WILDFIRE, LIGHTNING, AND ATMOSPHERIC CHEMISTRY NETWORK

WILDFIRE–OZONE FEEDBACK: warming + drought → increased wildfire risk under conducive weather and fuel conditions → vegetation loss + smoke + atmospheric emissions → increased ozone precursors → tropospheric ozone formation under suitable chemical conditions → vegetation damage → reduced carbon uptake and changes in evapotranspiration → greater warming and drying relative to a healthier-ecosystem baseline → increased wildfire risk ↺

LIGHTNING–OZONE FEEDBACK: warming + changes in convective instability → changes in lightning frequency and intensity → lightning-generated NOₓ → increased tropospheric ozone formation under suitable chemical conditions → vegetation damage → changes in carbon uptake and evapotranspiration → further ecosystem and climate stress → changes in future lightning potential. The pathway depends on storm type, moisture, background chemistry, and atmospheric transport.

LIGHTNING–WILDFIRE FEEDBACK: warming + drying → increased fuel flammability in susceptible ecosystems → lightning ignition → wildfire → vegetation loss + carbon emissions + changes in surface energy balance → additional warming and drying where net effects reinforce the initial conditions → greater wildfire risk ↺

FIRE–CARBON–SOIL FEEDBACK: warming + drought → wildfire → vegetation loss + soil-carbon combustion + post-fire decomposition → reduced ecosystem carbon storage + altered soil structure + moisture retention → reduced regeneration + increased surface heating + greater fuel vulnerability → additional carbon release and wildfire susceptibility ↺

AEROSOL–FIRE–PRECIPITATION COUPLING: wildfire emissions → changes in aerosol properties + cloud microphysics + atmospheric heating → changes in cloud development + precipitation efficiency + regional circulation → altered drought and fuel-moisture conditions → further wildfire risk under favorable conditions ↺

WILDFIRE AEROSOL–SNOW/ICE CROSS-LINK: wildfire smoke → aerosols in the atmosphere → changes in incoming solar radiation + cloud microphysics, with possible short-term cooling or warming depending on conditions. Separately, black-carbon deposition on snow and ice → reduced albedo → increased solar absorption → accelerated melting. Atmospheric smoke effects and deposited soot effects must be distinguished.

LAND CARBON, FORESTS, VEGETATION, AND ECOSYSTEM FEEDBACK NETWORK

CARBON-SINK DEGRADATION NETWORK: tropospheric ozone + warming + drought + wildfire + land-use change → reduced vegetation productivity and photosynthesis + increased carbon release in affected ecosystems → declining terrestrial carbon uptake relative to a healthier-ecosystem baseline → more atmospheric CO₂ retained → increased greenhouse forcing → additional warming → stronger ecosystem stress → further carbon-sink degradation where the response reinforces the initial change ↺

LAND CARBON SINK–ATMOSPHERIC CO₂ FEEDBACK: heat + drought + ozone damage + wildfire + ecosystem degradation → reduced photosynthesis and carbon storage, plus increased respiration or combustion emissions in some conditions → atmospheric CO₂ accumulation relative to a healthier-ecosystem baseline → increased radiative forcing → additional warming → greater ecosystem stress ↺. Land ecosystems can continue to absorb carbon where conditions remain favorable.

BOREAL FOREST TIPPING ELEMENT: warming + drought + wildfire + ozone damage + insect and disease stress → forest degradation and possible persistent forest transition → reduced carbon uptake + increased carbon release in affected systems → changes in albedo + snow exposure + evapotranspiration + surface roughness → regional cooling through snow exposure in some seasons, but potential warming through carbon loss and hydrological changes → further forest stress where net effects reinforce degradation ↺

AMAZON RAINFOREST TIPPING ELEMENT: warming + drought + fire + ozone damage → reduced plant function + photosynthesis + evapotranspiration in susceptible areas → reduced rainfall recycling and changes in cloud formation → increased drought stress where moisture recycling weakens → forest degradation + possible persistent forest loss → reduced carbon storage + carbon release → additional warming → further forest stress ↺. The extent of this pathway depends on regional rainfall, land use, fire, ecosystem resilience, and future climate.

VEGETATION–MOISTURE–CLOUD FEEDBACK: vegetation damage + forest loss → changes in transpiration + moisture recycling → changes in atmospheric humidity + cloud formation + rainfall → increased regional heat and drought stress where moisture recycling weakens → additional vegetation damage ↺. In other settings, cloud and rainfall responses may differ.

VEGETATION–OZONE–FIRE COUPLING: ozone damage + drought → reduced plant productivity and altered stomatal function → reduced carbon uptake + changes in evapotranspiration → greater atmospheric CO₂ retention and reduced evaporative cooling under susceptible conditions → increased heat and drought stress → greater wildfire susceptibility → further vegetation loss + carbon emissions ↺

OZONE–SOIL MOISTURE–HEAT EXTREMES CROSS-LINK: ozone exposure → plant injury + altered stomatal conductance and transpiration → changes in soil-water use and surface energy partitioning → potentially reduced evaporative cooling + increased sensible heating → greater risk of local heat extremes under susceptible conditions → additional plant stress. Reduced transpiration can conserve soil water in some circumstances, so the net soil-moisture response depends on species, rooting depth, soil, and weather.

PERMAFROST, WETLANDS, AND METHANE NETWORK

PERMAFROST TIPPING ELEMENT: Arctic warming → permafrost thaw → exposure of previously frozen organic matter to decomposition → release of CO₂ + CH₄ under suitable conditions → additional greenhouse forcing → further warming → additional permafrost thaw ↺

PERMAFROST HYDROLOGY–THERMOKARST FEEDBACK: Arctic warming → permafrost thaw + ground-ice loss → ground subsidence + thermokarst formation → altered drainage + wetland formation or drying → changes in soil moisture, oxygen availability, and anaerobic conditions → altered soil-carbon decomposition + CO₂ and CH₄ emissions → additional greenhouse forcing → further permafrost thaw ↺. Thaw can make some landscapes wetter and others drier.

WETLAND–METHANE FEEDBACK: warming + altered precipitation + permafrost thaw → changes in wetland extent + water-table depth + anaerobic conditions → changes in microbial methane production and emissions → changes in atmospheric CH₄ → altered greenhouse forcing → further warming → additional wetland and permafrost changes ↺. Regional drying can reduce methane emissions while increasing CO₂ emissions from drained organic soils.

PERMAFROST–FIRE–CARBON FEEDBACK: Arctic + boreal warming → drying vegetation + increased fire susceptibility in some landscapes → wildfire → combustion of vegetation + exposed soil organic carbon → reduced surface insulation + altered ground thermal properties → deeper seasonal thaw + additional carbon release → further warming and ecosystem stress ↺

COUNTERACTING AND STABILIZING CLIMATE RESPONSES

PLANCK RESPONSE: surface and atmospheric warming → increased outgoing longwave infrared radiation → greater energy loss to space → a stabilizing negative feedback that opposes the initial warming, without necessarily offsetting the full forcing from increased greenhouse-gas concentrations.

CONDITIONAL LOW-CLOUD COUNTERFEEDBACK: changes in circulation + atmospheric stability + moisture + aerosols → increased low-level cloud cover in some regions or seasons → increased reflection of incoming sunlight → reduced local or regional solar energy absorption. The net effect depends on the cloud’s longwave trapping, altitude, thickness, location, and season.

SNOWFALL AND ICE-ACCUMULATION COUNTEREFFECT: increased atmospheric moisture in some cold regions → increased snowfall where temperatures and precipitation conditions permit → temporary increases in snow accumulation or glacier and ice-sheet mass → partial offset of surface-melt losses. The net mass balance still depends on melt, rain-on-snow, and ice discharge.

AEROSOL COOLING COUNTEREFFECT: certain anthropogenic and volcanic aerosols → scattering or reflection of sunlight + possible cloud-brightening effects → reduced solar energy reaching the surface → temporary cooling that partially offsets greenhouse warming. The effect varies with aerosol composition, altitude, location, and cloud interactions.

CONTINUING TERRESTRIAL AND OCEAN CARBON UPTAKE: plant growth + terrestrial ecosystem recovery + ocean carbon uptake → removal of some atmospheric CO₂ → partial moderation of greenhouse-gas accumulation. Uptake depends on ecosystem health, nutrient and water availability, ocean chemistry, temperature, and circulation; neither terrestrial nor oceanic uptake should be assumed to cease universally.

COUNTERACTING FEEDBACKS ARE NOT PROOF OF CLIMATE STABILIZATION: negative feedbacks and regional cooling effects operate alongside reinforcing feedbacks and external forcing. The net climate trajectory depends on their relative magnitude, timing, geographical distribution, and interaction with human emissions.

EXTERNAL FORCING, FEEDBACK, TIPPING ELEMENTS, AND IMPACTS

EXTERNAL AND ANTHROPOGENIC FORCING: greenhouse-gas emissions → increased absorption of outgoing infrared radiation → planetary energy imbalance → atmospheric + land + ocean warming. Additional forcings include anthropogenic aerosols, land-use change, and natural solar and volcanic variability, each with distinct effects on the climate system.

REINFORCING FEEDBACKS: warming or another initial disturbance → changes in water vapor, cloud radiative effects, albedo, ocean circulation, soil moisture, or carbon storage → additional change in the original direction where the net feedback is positive ↺

COUNTERACTING FEEDBACKS: warming or another disturbance → changes that oppose the original disturbance, including increased outgoing infrared radiation and certain regional cloud, aerosol, or snow responses → partial stabilization or redistribution of energy.

TIPPING ELEMENTS: Greenland and Antarctic ice sheets + Arctic sea ice + AMOC + permafrost carbon stores + boreal forests + Amazon rainforest → components that may undergo substantial persistent change if particular thresholds are crossed. Thresholds, reversibility, confidence, and timescales differ by system; not every feedback is a tipping point.

CLIMATE CONSEQUENCES AND IMPACTS: persistent warming + changes in circulation, hydrology, cryosphere, and ecosystems → sea-level rise + extreme heat + drought + heavy precipitation + wildfire + agricultural stress + ecosystem disruption + infrastructure damage + water insecurity → economic + migration + public-health + political stress.

SOCIETAL–ENVIRONMENTAL CROSS-LINK: climate-related food + water + infrastructure + economic stress → changes in migration, public policy, land use, and resource demand → potential changes in emissions, ecosystem protection, and vulnerability → further environmental and societal consequences. These effects depend on human choices, institutions, adaptation, and resilience; they are not an inevitable one-way cascade.

INTEGRATED DOMINO EFFECT AND SYSTEM-WIDE COUPLING

ARCTIC WARMING → polar amplification → changes in equator-to-pole temperature gradients and atmospheric circulation → changes in weather persistence and regional extremes → drought + wildfire + vegetation stress in susceptible regions → altered carbon sinks + evapotranspiration → changes in clouds + atmospheric chemistry → changes in planetary energy balance → further warming where net effects reinforce the initial change ↺

OCEAN WARMING → OHC ↑ → changes in surface temperature + vertical heat redistribution + stratification + air–sea heat exchange → marine heatwaves + glacier-front melting + altered circulation → potential AMOC stress + changes in clouds and ocean carbon storage → changes in regional albedo + absorbed solar energy + atmospheric CO₂ → further ocean and atmospheric changes where net effects reinforce the initial disturbance ↺

VEGETATION DAMAGE → ozone + drought + wildfire + land-use change → photosynthesis and carbon uptake ↓ in affected ecosystems + changes in evapotranspiration → atmospheric CO₂ retention ↑ relative to a healthier-ecosystem baseline + changes in atmospheric moisture → warming + cloud changes → drought and fire risk ↑ in susceptible regions → further vegetation damage ↺

ICE LOSS → albedo changes + freshwater discharge ↑ + sea level ↑ → regional energy redistribution + ocean stratification and circulation changes + coastal ecosystem stress → additional cryospheric, hydrological, and ecological changes where feedbacks reinforce the initial disturbance ↺

ATMOSPHERIC CHEMISTRY–ECOSYSTEM COUPLING: greenhouse gases + ozone precursors + aerosols + wildfire emissions → changes in radiative forcing + plant function + cloud microphysics → altered carbon sinks + hydrological processes + atmospheric circulation → additional climate-system changes. The net response depends on chemical conditions, aerosol properties, cloud type, and ecosystem sensitivity.

GLOBAL CARBON–ENERGY COUPLING: terrestrial carbon-sink changes + ocean carbon uptake changes → changes in atmospheric greenhouse-gas concentrations relative to a baseline → changes in radiative forcing → further warming → additional ecosystem + ocean stress → further changes in carbon uptake and storage where net effects reinforce the initial change ↺

INTEGRATED DOMINO EFFECT: climate warming → feedback activation or modification → feedback coupling → nonlinear amplification or counteraction → possible threshold approach or crossing → potential tipping-element destabilization → cascading Earth-system changes → food + water + infrastructure + economic + migration + political stress → additional environmental and societal vulnerability.

OVERARCHING DYNAMICAL SEQUENCE

ENERGY IMBALANCE → HEAT REDISTRIBUTION → FEEDBACK ACTIVATION → FEEDBACK COUPLING → AMPLIFICATION OR COUNTERACTION → THRESHOLD APPROACH → POSSIBLE THRESHOLD CROSSING → POTENTIAL TIPPING-ELEMENT DESTABILIZATION → CASCADING SYSTEM RESPONSE → FURTHER CHANGES IN ENERGY, WATER, AND CARBON FLOWS ↺

TIMESCALE CLASSIFICATION

FAST ATMOSPHERIC PROCESSES: cloud formation and changes, water-vapor responses, aerosol–radiation interactions, atmospheric chemistry, lightning, storms, and many heat extremes → response over days to years, depending on the mechanism.

INTERMEDIATE OCEAN–LAND–ECOSYSTEM PROCESSES: upper-ocean heat redistribution, marine heatwaves, soil-moisture feedbacks, regional circulation changes, forest stress, wildfire recovery, and changes in carbon uptake → response over seasons to decades or longer.

SLOW AND THRESHOLD-SENSITIVE PROCESSES: deep-ocean adjustment, large ice-sheet retreat, long-term sea-level rise, permafrost carbon release, and persistent forest or ecosystem transitions → response over decades to centuries or longer, with some changes potentially persisting for millennia.

CROSS-SCALE COUPLING: fast atmospheric responses → changes in intermediate ocean, land, and ecosystem processes → potential activation of slow or threshold-sensitive responses → long-lasting changes that can influence the atmosphere and ocean well before the slow component has fully adjusted.

Interpretive principle: A reinforcing pathway indicates the potential for amplification, not proof of inevitability. A tipping element requires evidence of threshold-sensitive behavior, and a coupled network must be assessed link by link. The central systems question is how energy, water, and carbon move through the Earth system—and whether their interactions strengthen, weaken, or persist as conditions change.