bookmark_borderThe Collapse Point: How Climate Change Is Breaking Insurance — and Capitalism With It

by Daniel Breouse / November 26, 2025

As extreme weather accelerates, humanity is nearing a tipping point where insurance — and the economic system built upon it — may no longer function. One of the world’s largest insurers, Allianz SE, has issued an unusually blunt warning: the climate crisis is destabilizing global capitalism from within, and the breakdown has already begun.

Allianz board member Gunther Thallinger, who also chairs the company’s investment board, argues that rising temperatures and worsening climate disasters are pushing many risks past the limits of insurability. And when insurance fails, everything built on top of it — mortgages, real estate markets, infrastructure investment, business lending, and even municipal budgets — begins to unravel.

His message is simple and grim:
“Heat and water destroy capital.”

Flooded homes lose value. Overheated cities become uninhabitable. Billion-dollar infrastructure corrodes, warps, or burns. Entire asset classes are degrading in real time.

The consequences ripple far beyond insurance claims. They threaten the foundational assumptions of modern capitalism itself.

A Financial System on the Brink

The planet is currently on track for 2.2°C to 3.4°C of warming — well beyond the thresholds that insurers, governments, and markets are designed to withstand. Global temperatures have already surpassed 1.5°C and are projected to blow past 3°C within a decade.

At that level of heating:

  • The number and severity of disasters become too frequent to price.
  • Extreme losses arrive faster than insurers can rebuild capital.
  • Governments cannot bail out the private sector at the required scale.
  • Entire regions become economically nonviable.

The numbers already paint the picture of an economy under siege:

  • $2 trillion in climate-related damages from 2013–2023 (Aviva).
  • $400 billion in 2024 alone (Gallagher RE).
  • A fivefold increase in annual weather-related losses in Europe since the 1980s.

Insurers like Zurich now openly state that achieving net-zero emissions by 2050 is essential to prevent systemic collapse.

Thallinger’s warning:
We may not have until 2050.

In California, major carriers have already stopped writing home insurance in fire-prone regions. In Florida, companies are fleeing as storm intensities shred actuarial models. These are not hypotheticals — they are the first cracks in the global financial foundation.

When the Math Breaks Down

Insurance only works when the risks are measurable and the premiums remain affordable. Climate change destroys both conditions.

Thallinger is explicit:

“As temperatures rise to 1.5°C, 2°C, 3°C, insurers will no longer be able to offer coverage. The premiums required exceed what people or companies can pay. This is already happening.”

If insurance fails:

  • Banks cannot issue mortgages.
  • Developers cannot secure financing.
  • Cities cannot bond infrastructure.
  • Home values collapse.
  • Industries become stranded.
  • Governments face spiraling bailout demands they cannot meet.

This is the hidden climate tipping point — a systemic failure that happens quietly, through spreadsheets and canceled policies, before it erupts into a full-blown economic crisis.

What the Industry Says Must Happen (and Why It Isn’t Happening)

Klaus-Peter Röhler, another Allianz board member, outlines what is required to keep insurance viable:

1. Massive prevention and adaptation

Climate-resilient building codes, flood defenses, and infrastructure upgrades.
Europe has completed only 5% of its planned flood protection projects.
At the current pace, it will take 100 years to finish.

2. Risk-based pricing

Political pressure often forces insurers to keep premiums artificially low — a recipe for insolvency. Without prices that reflect real risk, insurers collapse sooner.

3. Government stop-loss support for extreme events

Governments should backstop only the rarest, most catastrophic disasters — not routine damage that should be prevented through better planning.

No country has successfully implemented this triad.
Some, notably the United States, demonstrate what happens when policymakers block these measures:

  • California: Wildfire risk makes coverage unavailable at any price.
  • Florida: Storm losses and dysfunctional regulation have triggered an insurance exodus.
  • State-run bailout insurers are failing under the load.

The lesson is clear: Insurability is not guaranteed.
It must be preserved — and it is being lost region by region.

What Happens Next

Allianz emphasizes that policyholders, governments, and insurers all have roles to play — but adaptation can only delay collapse if emissions continue rising.

Without rapid decarbonization:

  • More regions will become uninsurable.
  • Financial shocks will cascade into housing, banking, and municipal finance.
  • Capitalism, which relies on pricing risk, will have no mechanism to allocate it.
  • Entire coastal and heat-exposed regions could lose economic viability.

We are approaching a world in which the question will not be whether people can afford insurance — but whether insurance can afford people.

The Real Tipping Point Isn’t Just Environmental — It’s Economic

Climate change is often framed as a humanitarian crisis or an environmental challenge. It is far more than that.

It is a capital destruction engine operating on a planetary scale.

Insurance is simply the first part of the system to falter, because it is the first to directly feel the mathematical impossibility of infinite losses on a finite balance sheet. But what follows is not limited to insurers:

  • Mortgage markets fail.
  • Municipal bond markets seize up.
  • Infrastructure investment dries out.
  • Property values collapse.
  • Supply chains face continuous disruption.
  • Governments pick up costs they cannot bear.
  • Capitalism enters an unmanageable risk spiral.

Unless warming is rapidly halted, we will cross a line where risk can no longer be transferred, financed, or recovered.

That is the collapse point.

* Our probabilistic, ensemble-based climate model — which incorporates complex socio-economic and ecological feedback loops within a dynamic, nonlinear system — projects that global temperatures are becoming unsustainable this century. This far exceeds earlier estimates of a 4°C rise over the next thousand years, highlighting a dramatic acceleration in global warming. We are now entering a phase of compound, cascading collapse, where climate, ecological, and societal systems destabilize through interlinked, self-reinforcing feedback loops.

What Can I Do?
The single most important action you can take to help address the climate crisis is simple: stop burning fossil fuels.

Tipping points and feedback loops drive the acceleration of climate change. When one tipping point is toppled and triggers others, the cascading collapse is known as the Domino Effect.

The Human Induced Climate Change Experiment

bookmark_borderRecord Deficit, Falling Confidence, and Rising Prices: Today’s Economic Data Paints a Bleak Picture

The U.S. economy delivered another round of troubling signals today, November 25, 2025, as new data from multiple federal agencies showed weakening consumer confidence, persistent inflation pressures, and a federal deficit spiraling far beyond expectations — despite record tariff revenue.

A Deficit Explosion Masked by Tariff Receipts

The U.S. Treasury Department reported a $284 billion federal budget deficit for October, a figure significantly worse than analysts had projected. What makes the number even more alarming is that it came despite record-breaking tariff revenue — revenue that was supposed to “pay down the deficit” under the administration’s claims.

Instead, higher tariffs have functioned like a stealth tax on American consumers, raising prices while failing to stabilize federal finances. Any short-term revenue boost is being swamped by:

  • Declining economic activity
  • Slowing consumer spending
  • Rising interest costs on the national debt
  • Lower income tax receipts from a weakening labor market

The result is a fiscal picture deteriorating faster than any point since the early pandemic.

Producer Prices Rising Again — Especially Energy

The Bureau of Labor Statistics reported that the Producer Price Index (PPI) rose 0.3% in September, driven largely by higher energy costs — costs that have surged under the administration’s tariff-heavy trade agenda and expanded fossil fuel subsidies.

Key details:

  • PPI (YoY): +2.7%
  • Core PPI (ex. food & energy): +0.1% for the month, +2.6% YoY

These increases signal that inflationary pressures are not abating, and many of these wholesale price increases typically pass through to consumers in subsequent months.

Consumer Confidence Plunges to a 7-Month Low

The most immediate sign of economic stress is coming from households.

The Conference Board’s Consumer Confidence Index dropped from 95.5 in October to 88.7 in November, its lowest level since April. The decline was broad and severe:

  • Consumers expect worsening business conditions
  • Their current financial situations have deteriorated
  • Expectations of future income growth have declined
  • Confidence in the labor market has weakened noticeably
  • The recent government shutdown further eroded trust and stability

A sustained drop in confidence typically precedes slower holiday spending, weaker hiring, and reduced investment — creating a negative feedback loop that deepens economic downturns.

What Today’s Data Really Means

Taken together, these indicators show an economy:

  • Struggling under the weight of tariffs, which have raised costs while reducing imports and slowing output
  • Weakening from the bottom up, as consumers face rising prices and falling confidence
  • Running dangerously large deficits, even at a time when tariff revenues are unusually high

This is the same pattern seen in past economies strained by protectionism and political instability: higher prices, slower growth, and worsening fiscal health.

Tariffs were promised to make America stronger.
Instead, they’re making everything more expensive — while the deficit keeps climbing anyway.

Trumpenomics

bookmark_borderSudden Sea Level Pulses: How “Cork Release” Ice-Sheet Failures Could Rapidly Reshape Global Coastlines

By Daniel Brouse and Sidd Mukherjee

November 25, 2025

Introduction: The Shift From Gradual to Abrupt Sea Level Rise

Sea level rise (SLR) is one of the most revealing indicators of the accelerating pace of climate change. A century ago, global SLR was doubling roughly every 100 years. Ten years ago the doubling time had collapsed to a decade. By 2023, the doubling time had plunged to only two years.

This extraordinary acceleration led us to focus on a much more dangerous and poorly modeled phenomenon:

Sudden Sea Level Pulses (SSLPs) — rapid, stepwise jumps in sea level triggered by abrupt ice-sheet failures, subglacial “cork release” events, and ice-shelf structural collapse.

These pulses are not hypothetical. They are beginning to occur.

Examples include:

  • Greenland Subglacial Flood: A massive outburst where trapped meltwater burst through the ice, demonstrating the potential for sudden hydrofracture.
  • Alaska’s Mendenhall Glacier Outburst: A glacial flood that produced rapid, dangerous water-level increases downstream.

A detailed overview is archived at:
http://membrane.com/global_warming/Greenland-Ouburst.html

These events reveal something ice-sheet models have not yet fully integrated: meltwater can accumulate beneath ice until pressure surpasses structural integrity, causing the ice surface to fail catastrophically — a “cork release.” When this occurs at scale, sea levels can jump not millimeters per year, but multiple feet per year.

Why This Matters: The Risk of Abrupt, Multi-Foot Sea Level Jumps

The public still imagines sea level rise as a slow, linear process. But the Earth system does not behave linearly. When hydrofracture and ice-cliff collapse become common, we could face:

  • Multi-foot sea level increases within a single decade
  • 1–3 feet of rise within a single year in extreme pulse scenarios
  • Little or no time for adaptation in cities like Miami, New York, Mumbai, Lagos, and Shanghai

Current global climate models fail to incorporate most “cork release” pathways because:

  • Subglacial water transport is poorly mapped
  • Meltwater storage and pressurization are not well parameterized
  • Ice-shelf fracture mechanics are only partially resolved
  • Positive feedback loops — such as meltwater-driven lubrication and ice-cliff collapse — are not modeled dynamically

The Greenland outburst events show that ice sheets can undergo abrupt, nonlinear failures — far faster than infrastructure, economies, or governance systems can adapt.

Sidd summarized it best:

“Under-ice hydrology is hard to observe… but once enough pressure builds, ice doesn’t melt — it fractures.”

Antarctica: The System Most Likely to Produce Catastrophic Pulses

While Greenland contributes meaningfully to long-term SLR, Antarctica is the critical risk for abrupt sea level pulses.

The East Antarctic Ice Sheet (EAIS)

  • Holds ~170 feet of potential sea level rise
  • Once thought stable for millennia
  • Now showing early signs of warming-driven destabilization
  • Marine-based sectors may begin collapsing this century

The West Antarctic Ice Sheet (WAIS)

  • Highly vulnerable
  • Resting on retrograde (downward-sloping) bedrock
  • Warm ocean water is eroding the shelves from below
  • Pinning points are failing, which removes the natural “brakes”

Sidd’s assessment:

Greenland: “Effectively lost,” 100–300 years, +20 ft
West Antarctica: Likely collapse within decades to ~100 years, +10 ft

Total plausible rise by 2125: 20–30 feet, with the possibility of sudden pulses:

“We could dawdle along at half an inch a year, then see a few years at a foot per year.”

New Evidence: The Impending Failure of Thwaites Eastern Ice Shelf (TEIS)

In November 2025, Advancing Earth and Space Sciences published a landmark study:
“Evolution of Shear-Zone Fractures Presages the Disintegration of Thwaites Eastern Ice Shelf”
(https://agupubs.onlinelibrary.wiley.com/doi/10.1029/2025JF008352)

The TEIS is a keystone structure. Once it collapses, the glacier behind it — the “Doomsday Glacier” — will accelerate dramatically. The study found:

Key Findings

  1. Long-term shear fracturing (2002–2017):
    Large fractures formed parallel to flow as the shelf strained against its pinning point.
  2. Recent explosive tensile fracturing (2017–2022):
    Smaller, orthogonal fractures began proliferating, indicating that structural integrity is failing.
  3. Dynamic destabilization:
    Satellite and GPS data reveal velocity perturbations rippling across the shelf as fractures expand — a sign of imminent collapse.
  4. Transition of the pinning point from stabilizer to destabilizer:
    Echoing Benn et al. (2022), the pinning point now increases fracture stress instead of reducing it.
  5. Self-reinforcing feedback loop:
    The shelf appears to be entering the “damage-acceleration-damage” feedback proposed by Lhermitte et al. (2020), a hallmark of impending disintegration.

What This Means

When TEIS collapses — an event many glaciologists now expect within years to a decade — Thwaites Glacier could:

  • accelerate dramatically
  • initiate ice-cliff collapse
  • trigger multi-foot sea level pulses within short timescales

This is the largest currently unfolding structural failure in the cryosphere.

Cork-Release Events: A Distinct Class of Tipping Point

We define a “cork release” event as:

A sudden failure of ice or subglacial pressure systems causing rapid, high-volume discharge of water or ice into the ocean.

These events include:

  • subglacial lake drainage
  • rapid ice-shelf collapse
  • meltwater-driven hydrofracture
  • ice-cliff structural failure

Unlike gradual melt, cork-release events:

  • are nonlinear
  • occur suddenly
  • accelerate with warming
  • have global consequences within months to years
  • are triggered by thresholds that are difficult to predict

This makes them one of the most dangerous — and least modeled — climate feedbacks.

Conclusion: The Urgent Need to Model Abrupt Sea Level Change

The climate system is not simply warming. It is accelerating, destabilizing, and producing events far outside historical norms. Sea level rise will not be a smooth curve; it will be stepwise, punctuated by abrupt pulses.

To prepare for what is coming, climate science and adaptation planning must incorporate:

  • ice-shelf fracture dynamics
  • under-ice hydrology
  • subglacial pressurization
  • ice-cliff collapse physics
  • nonlinear feedbacks
  • sudden sea level pulse scenarios

Human systems are built for gradual change. The cryosphere is not.

The question is no longer if abrupt sea level pulses will occur — but how soon, how large, and how many.

* Our probabilistic, ensemble-based climate model — which incorporates complex socio-economic and ecological feedback loops within a dynamic, nonlinear system — projects that global temperatures are becoming unsustainable this century. This far exceeds earlier estimates of a 4°C rise over the next thousand years, highlighting a dramatic acceleration in global warming. We are now entering a phase of compound, cascading collapse, where climate, ecological, and societal systems destabilize through interlinked, self-reinforcing feedback loops.

What Can I Do?
The single most important action you can take to help address the climate crisis is simple: stop burning fossil fuels. There are numerous actions you can take to contribute to saving the planet. Each person bears the responsibility to minimize pollution, discontinue the use of fossil fuels, reduce consumption, and foster a culture of love and care. The Butterfly Effect illustrates that a small change in one area can lead to significant alterations in conditions anywhere on the globe. Hence, the frequently heard statement that a fluttering butterfly in China can cause a hurricane in the Atlantic. Be a butterfly and affect the world.

→ “Solutions to the Fossil Fuel Economy and the Myths Accelerating Climate and Economic Collapse.“

Tipping points and feedback loops drive the acceleration of climate change. When one tipping point is toppled and triggers others, the cascading collapse is known as the Domino Effect.

The Human Induced Climate Change Experiment

bookmark_borderA Treasury Secretary Out of His Depth: Bessent’s Bungled Defense of Rising Prices and Tariff Failures

The Treasury Secretary offered up a last-ditch, visibly strained defense on NBC’s Meet the Press while discussing the administration’s sudden decision to roll back tariffs on a range of food products. What followed was one of the most awkward and revealing interviews of the administration’s economic team to date.

When journalist Kristen Welker pressed Bessent, 63, with the obvious question — “Isn’t the fact that you’re rolling back tariffs an admission that they ultimately do drive up prices?” — he interrupted abruptly with a bizarre deflection:

“Kristen, how much does your arm weigh?”

Welker, understandably taken aback, tried to steer the conversation back to the facts. But Bessent doubled down:

“You know how much you weigh, and you get on the scale every morning. Inflation is a composite number and we look at everything, so we are trying to push down the things we can control.”

Instead of answering the straightforward economic question, the Treasury Secretary offered a metaphor that made no economic sense and evaded the issue entirely. He then launched into a broad — and equally unconvincing — defense of the administration’s economic record, insisting that energy prices were “flattening” and that “other prices will follow,” despite consumer data showing the opposite trend.

This exchange came immediately after Bessent visibly stumbled while attempting to explain a contradiction now central to Trump’s economic policy. Months ago, he enthusiastically claimed that tariffs were good for consumers. Today, Trump is being forced to roll back tariffs on essential consumer goods because prices for everyday items — including staples like bananas and coffee — have surged under the tariff regime.

The contradiction is not subtle. It is not complicated. And Bessent was unable to reconcile it.

A Treasury Secretary Without the Basics

Many observers are now openly questioning why Bessent is Treasury Secretary at all. His résumé only deepens the concern:

  • No prior experience in government finance or macroeconomic policy
  • Previously a hedge fund manager, not an economist
  • Before that, a history teacher, with no discernible background in fiscal or monetary analysis
  • No published economic work, no record of policy scholarship, and no demonstrated expertise in inflation mechanics, taxation, or global trade

In short, nothing in his background suggests even a foundational understanding of the economic tools he is now attempting — unsuccessfully — to defend on national television.

The administration’s tariff policies have been widely criticized by economists across the political spectrum for raising prices, dampening consumer demand, and contributing to a broader economic slowdown. Sunday’s interview only underscored what many feared: the nation’s chief economic policymaker cannot explain the consequences of his own policies and appears unfamiliar with basic economic principles.

What should have been a straightforward discussion about tariffs and consumer prices instead became an uncomfortable display of confusion, deflection, and economic incoherence — raising even deeper concerns about who is steering the country’s financial policy at one of the most volatile moments in modern economic history.

Trumpenomics

bookmark_borderThe Evolving Scientific Understanding of SARS-CoV-2, COVID-19, and Long COVID

by Daniel Brouse
November 22, 2025

The scientific consensus continues to strengthen around a critical reality: COVID-19 does not end when the acute infection clears. A growing body of evidence now shows that SARS-CoV-2 causes a wide spectrum of long-term health complications, driven primarily by two mechanisms—persistent infection and epigenetic disruption. Together, these processes help explain the profound and lingering health, social, and economic impacts of the pandemic.

Persistent SARS-CoV-2 Infection

Persistent COVID-19 refers to the continued presence of viral material in organs long after a person has tested negative. Viral RNA, proteins, and replication-competent virus have been detected in the brain, gut, heart, lymph nodes, lungs, and other tissues months or even years after the initial infection.

This persistence can recreate or prolong many early symptoms, including:

  • Brain fog and cognitive decline
  • Profound fatigue
  • Dysautonomia and POTS
  • Night sweats and temperature dysregulation
  • Autoimmune-like manifestations
  • Loss or distortion of taste and smell

This mechanism is now widely recognized as a driver of Long COVID, chronic inflammation, and immune dysfunction.

Post-Infection Vaccination as Therapy

Emerging research indicates that post-infection mRNA vaccination can act as a form of immunological “reset.” By reintroducing viral antigens safely, the vaccine can:

  • Stimulate targeted immune clearance of residual viral reservoirs
  • Reduce systemic inflammation
  • Improve symptoms associated with persistent infection

This therapeutic effect underscores the importance of vaccination not only for prevention but for post-infection recovery and long-term health protection.

Epigenetic Impacts of SARS-CoV-2

The second major mechanism of long-term harm is epigenetic modification. Epigenetics involves chemical tags that control whether genes are turned on or off without changing the underlying DNA sequence.

SARS-CoV-2 has been shown to induce significant epigenetic changes, which can:

  • Activate oncogenes associated with cancer
  • Increase risk for diabetes, metabolic disorders, and cardiovascular disease
  • Disrupt neurological function and accelerate brain aging
  • Trigger or worsen autoimmune conditions

These changes act as biological “switches” that can remain altered for years. When combined with other stressors—pollution, heat, poor air quality, co-infections—the effects do not simply add up; they multiply, increasing vulnerability across multiple organ systems.

Even more concerning, epigenetic shifts can be transgenerational: stress-induced modifications in one generation can be passed down, increasing disease risk in their children and grandchildren.

The Economic Fallout of Long COVID

Long COVID—defined as symptoms persisting three months after SARS-CoV-2 infection—is now understood as one of the most economically damaging mass disabling events in history.

Key findings:

  • Global prevalence: ~36% of all infected individuals
  • Annual economic burden: ~$1 trillion worldwide
  • Annual lost earnings in the U.S.: ~$170 billion
  • Long COVID leads to sustained unemployment, reduced labor force participation, and financial hardship for years after infection.

The economic burden from epigenetic damage is even harder to quantify. How do we measure:

  • Increased chronic pain, disability, and early mortality?
  • Healthcare costs spanning decades?
  • The loss of human potential?
  • The inherited burden passed to future generations?

These are the hidden costs that will shape global health for decades.

Conclusion: A Critical Warning

Climate change, pollution, and zoonotic disease are not separate threats—they are interconnected components of a dangerous biological feedback loop.

  • Extreme heat accelerates biological aging and shortens telomeres.
  • Air pollution increases susceptibility to COVID-19 and worsens outcomes.
  • COVID-19 and heat stress both trigger harmful epigenetic modifications.
  • Climate-driven shifts in pathogens increase exposure risks while weakened immune systems amplify their impact.

Together, these processes compound the long-term health consequences of SARS-CoV-2 and increase the population’s vulnerability to future pandemics.

Understanding this interplay is essential. The choices governments make now—whether to fund or defund infectious disease research, climate science, and vaccine development—will determine the health and stability of generations to come.

The Human Induced Health Collapse

bookmark_borderThe Non-Linear Acceleration of Climate Change: Evidence, Confirmation, and the Emerging Domino Effect

By Sidd Mukherjee and Daniel Brouse
November 22, 2025

In the 1990s, we developed what became known as The Non-Linear Acceleration Hypothesis—the proposition that climate change is not progressing linearly but is accelerating exponentially. Working together, with Sidd’s background as a Doctor of Physics from Ohio State and my own experimental and observational analyses, we produced the foundational evidence for this theory. By the early 2000s, our work had evolved into a recognized climate framework, validated repeatedly through independent replication and supported by an expanding body of empirical data. Over the decades, this body of confirmation has solidified into the scientific consensus we see today.

Shrinking Doubling Times and Escalating Impacts

One of the most compelling indicators of nonlinear acceleration is the dramatic contraction of the doubling time of climate impacts—the interval in which damage effectively doubles due to interacting feedback processes. In the mid-20th century, the doubling time was on the order of 100 years. By the early 2000s, it had fallen to 10 years, and recent analyses show that it has now plunged to approximately 2 years.

This means that the impacts of climate change today are twice as severe as they were two years ago. If the doubling time remains constant, they will be four times worse in two years, eight times worse in four years, and potentially sixty-four times worse within a decade. These estimates are conservative; the doubling period continues to shorten as feedbacks intensify. With no meaningful global mitigation underway, the trajectory is unmistakable and vastly more catastrophic than previously projected.

Hansen’s Confirmation of the Acceleration Hypothesis

We have long regarded Dr. James E. Hansen as one of the principal founders of modern climate science. In April 2025, Hansen’s paper Global Warming Acceleration: Impact on Sea Ice provided a direct, data-driven confirmation of our hypothesis. His analysis demonstrated that global warming is accelerating, and that climate sensitivity is higher than IPCC estimates, fundamentally altering expectations for 21st-century warming.

Hansen concluded that IPCC models underestimate both climate sensitivity and key feedback processes. Under current emissions levels, he projects that warming by 2100 is likely to exceed 7°C, dramatically raising the probability of crossing multiple climate tipping points.

In November 2025, Hansen, Kharecha, and Morgan published Warning! This “Colorful Chart” Is Censored by IPCC, offering further confirmation.

Accelerated Forcing Growth

Their analysis centers on a chart showing the five-year running mean of the annual increase in greenhouse gas forcing. Over the past 15 years, they find that the rate of increase has surged to ~0.5 W/m² per decade—far higher than IPCC projections. This acceleration is not reflected in IPCC scenarios and is fundamentally incompatible with its claims of remaining “pathways” to 1.5°C or 2°C.

Implications for Climate Scenarios

  • Current forcing trajectories align closely with RCP 8.5, the high-end “business-as-usual” pathway.
  • They diverge sharply from RCP 2.6, the scenario often used for policy optimism.
  • Achieving RCP 2.6 today would require $2.4–5 trillion per year using current technology.
  • RCP 2.6 also presumes unrealistic levels of biomass burning plus carbon capture, which Hansen calls politically and practically unviable.

Critique of IPCC’s Modeling and Transparency

Hansen and colleagues argue that the IPCC relies too heavily on Integrated Assessment Models (IAMs), which they describe as opaque “dark boxes”—tools that embed assumptions that are rarely examined in public-facing science.

They highlight that:

  • Scientists have not adequately communicated the severity of accelerating forcings.
  • Carbon pricing is vastly more effective than prescriptive international agreements.
  • Missed opportunities since the Montreal Protocol have allowed forcings to climb unchecked.
  • Early COP negotiations excluded nuclear power from the Clean Development Mechanism—a decision they view as scientifically indefensible.

Climate Sensitivity and Near-Term Risk

Hansen’s findings, along with related analyses, suggest climate sensitivity in the range of 4–5°C per CO₂ doubling, substantially above many IPCC estimates. They warn that without extraordinary action within the next 5–10 years, Earth could be locked into a high-warming trajectory that destabilizes major climate systems.

Strengths of Hansen’s Argument

  • Data-driven approach grounded in measured forcings with ~10% uncertainty.
  • Clear policy relevance connecting forcing to cost, mitigation feasibility, and economic risk.
  • Strong emphasis on accelerating risk, consistent with observed feedback behavior.
  • Valid critique of IAM transparency, echoing long-standing concerns within the scientific community.

Broader Implications

If Hansen et al. are correct, the window for avoiding catastrophic warming is significantly narrower than models suggest. Their work underscores the need for:

  • Greater transparency in climate modeling
  • Rapid implementation of carbon pricing
  • Reevaluation of technological pathways
  • Public communication that aligns with empirical reality

Their findings also increase the urgency of addressing the accelerating feedback loops we identified decades ago.

The Domino Effect: Cascading Tipping Points

Building on nonlinear thermodynamics and chaos theory, we now know that climate tipping points are not isolated events—they interact. As major systems destabilize, they trigger secondary failures, creating a cascade of compounded impacts.

Our recent synthesis of 2024–2025 data shows:

  • CO₂ concentrations, fossil fuel emissions, and global temperatures all reached record highs.
  • Natural carbon sinks are beginning to convert into carbon sources.
  • Feedbacks across ice loss, ocean circulation, albedo decline, and atmospheric chemistry are synchronizing.
  • These interactions are driving what we call the Domino Effect—a system-wide cascade that threatens global habitability within this century.

* Our probabilistic, ensemble-based climate model — which incorporates complex socio-economic and ecological feedback loops within a dynamic, nonlinear system — projects that global temperatures are becoming unsustainable this century. This far exceeds earlier estimates of a 4°C rise over the next thousand years, highlighting a dramatic acceleration in global warming. We are now entering a phase of compound, cascading collapse, where climate, ecological, and societal systems destabilize through interlinked, self-reinforcing feedback loops.

What Can I Do?
The single most important action you can take to help address the climate crisis is simple: stop burning fossil fuels. There are numerous actions you can take to contribute to saving the planet. Each person bears the responsibility to minimize pollution, discontinue the use of fossil fuels, reduce consumption, and foster a culture of love and care. The Butterfly Effect illustrates that a small change in one area can lead to significant alterations in conditions anywhere on the globe. Hence, the frequently heard statement that a fluttering butterfly in China can cause a hurricane in the Atlantic. Be a butterfly and affect the world.

→ “Solutions to the Fossil Fuel Economy and the Myths Accelerating Climate and Economic Collapse.“

Tipping points and feedback loops drive the acceleration of climate change. When one tipping point is toppled and triggers others, the cascading collapse is known as the Domino Effect.

The Human Induced Climate Change Experiment

bookmark_borderFlooding at Coastal Sites That Use and Produce Hazardous Substances

Sea level rise and flooding of hazardous sites in marginalized communities across the United States
Published in Nature / 20 November 2025

Sea level rise (SLR) increases the risk of flooding at coastal sites that use and produce hazardous substances. We assess whether socially marginalized populations in the United States are more likely to be impacted by projected SLR-related flooding of hazardous sites that could result in contaminant releases. We identify 5500 facilities at risk of a 1-in-100-year flood event by 2100 under a scenario of continued high greenhouse gas emissions, including coastal power plants, sewage treatment facilities, fossil fuel infrastructure, industrial facilities, and formerly used defense sites. Seven states (Louisiana, Florida, New Jersey, Texas, California, New York, and Massachusetts) account for nearly 80% of projected at-risk facilities. Controlling for population density and county, a one standard deviation increase in the proportion of linguistically isolated households, neighborhood residents identifying as Hispanic, households with incomes below twice the federal poverty line, households without a vehicle, non-voters, and renters is associated with 19-41% higher likelihood of having a site at risk of SLR-related flooding within 1 kilometer.

Flooding at Coastal Sites That Use and Produce Hazardous Substances

Flooding at Coastal Sites That Use and Produce Hazardous Substances

bookmark_borderHow Bitcoin’s Shift to a Risk-Off Asset Is Rewiring Market Dynamics

By Daniel Brouse November 20, 2025

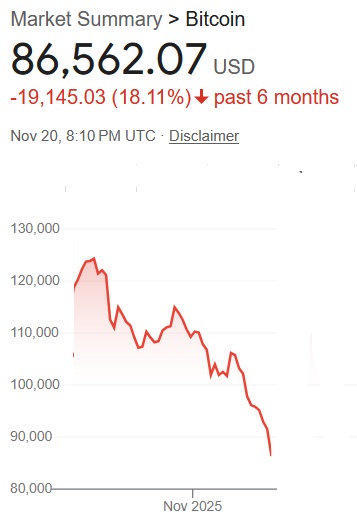
Bitcoin has fallen from $120,000 to under $90,000 in just six weeks. What’s behind the move?
Two forces are doing most of the work:

  1. Leverage
  2. A fundamental shift in how markets classify Bitcoin—from risk-on to risk-off

1. Leverage: The Amplifier Behind the Drop

While we can’t pin down an exact percentage of leveraged Bitcoin exposure, it is unquestionably large, reflexive, and sensitive to volatility.

  • Cumulative open interest in perpetual BTC futures recently climbed to about $43.6 billion, indicating enormous leveraged positioning.
  • Leveraged ETFs now represent nearly 25% of open interest on the CME, and some estimates put total market leverage even higher.

When BTC softens, margin calls begin. Loans are called, collateral thresholds are breached, and automated liquidations kick in. Those liquidations create forced selling, which drives prices lower—triggering still more liquidations. It’s a classic cascade: leverage doesn’t just add fuel; it adds momentum to both rallies and crashes.


2. Bitcoin’s Identity Crisis: From Risk-On Hedge to Risk-Off Liability

For years, Bitcoin was lumped in with gold as a “risk-on” inflation hedge. When deficits ballooned, inflation expectations rose, or geopolitical stress intensified, BTC often rallied.

But that perception has flipped. Entire macro trading systems are now treating Bitcoin as a risk-off asset—something to dump, not buy, when stress rises.

Why the reversal?

  • Bitcoin has become tightly intertwined with leveraged speculative flows.
  • Institutional quant desks increasingly treat BTC as a proxy for market liquidity, not inflation.
  • Rising real yields and tighter financial conditions have made Bitcoin behave less like digital gold and more like a high-beta liquidity sponge.

When markets rotate into fear, Bitcoin isn’t the refuge—it’s the first asset sold in bulk.


3. The Stock Market Parallel: A Leverage Environment Ripe for Contagion

To understand the broader implications, it helps to look backward. The 1929 crash was fueled by roughly 10% leverage in equities. Today, by many measures, equity leverage is above that threshold, once you include:

  • Margin debt
  • Options exposure
  • Leveraged volatility products
  • Structured derivatives
  • High-frequency strategies embedding synthetic leverage

Since “Liberation Day’s” correction, traders have again viewed equities as a risk-on bet. But here’s the critical shift:
Many algorithmic trading models now treat Bitcoin’s behavior as a signal for equity risk.

Meaning:

  • When Bitcoin sells off in a risk-off pattern
  • Models assume broader liquidity stress is rising
  • So the algorithms reduce equity exposure right alongside Bitcoin

This creates a cross-asset feedback loop that didn’t exist a few years ago.


4. The New Market Regime: Bitcoin as a Sentiment Barometer

Bitcoin’s transformation from a risk-on hedge to a risk-off trigger is reshaping market structure:

  • Bitcoin weakness → signals liquidity stress
  • Liquidity stress → triggers systematic de-risking
  • Systematic de-risking → amplifies equity volatility
  • Heightened equity volatility → creates more Bitcoin selling

In other words, Bitcoin—once touted as a portfolio diversifier—is increasingly becoming a sentiment accelerant. It now behaves not like gold, but like a voltage meter for market fragility.

5. Is Bitcoin Speculative?

A: Yes, very speculative. And there’s a deeper issue that rarely gets discussed: it’s unlikely Bitcoin will ever fully regain its old “digital gold” status because its long-term vulnerabilities are fundamentally different from those of a physical asset like gold.

Gold exists in the real world. You can hold it, store it, bury it, vault it — and none of that depends on software, electricity, networks, miners, or cryptographic standards remaining unbroken for decades.

Bitcoin, by contrast, relies on a long chain of non-tangible systems: a functioning global internet, distributed mining infrastructure, long-term cryptographic stability, wallet software, recovery mechanisms, and digital interfaces that all must operate flawlessly. If any link in that chain fails, the ability to access or verify ownership can collapse. And with quantum computing likely to break the underlying cryptographic algorithms, Bitcoin’s current security model—and therefore its value—could be rendered effectively worthless.

That dependency stack makes it far more fragile than physical gold — and that fragility is exactly why many investors now treat Bitcoin as pure speculation rather than a durable store of value.

Bitcoin Price November 2025

bookmark_borderThe Epstein Files Cover-Up: Trump’s Two-Term Obstruction Exposed

“…At my direction, the Dept. of Justice has already turned over close to fifty thousand pages of documents to Congress. Do not forget — The Biden Admin did not turn over a SINGLE file or page related to Democrat Epstein, nor did they ever even speak about him. Democrats have used the “Epstein” issue, which affects them far more than the Republican Party, in order to try and distract from our AMAZING Victories…” – President Donald J. Trump

This is classic Trump projection.
The only administration that actually blocked Epstein files — twice — was Trump’s.

During his first term:

  • Trump’s DOJ fought the Miami Herald’s FOIA requests.

  • His appointees appealed court orders that would’ve unsealed Epstein documents.

  • Barr and Sessions withheld FBI files, internal DOJ memos, and the full immunity list tied to Epstein’s 2008 deal.

  • Trump publicly defended Acosta, Prince Andrew, and even said “I wish her well” about Ghislaine Maxwell. His DOJ acted accordingly: protect, delay, obstruct.

During his second term:

  • Trump’s DOJ used “ongoing investigation” excuses to slow-walk or deny disclosures.

  • They invoked executive privilege to block Congress when the documents related to Trump allies, donors, or Mar-a-Lago associates.

  • The “50,000 pages” he brags about are the same redundant, low-value materials delayed since his first term — and they were released only once Republicans controlled the narrative.

Meanwhile, the fact he omits:
Most major Epstein releases — including thousands of pages of Maxwell case documents and FBI summaries — came out under Biden, because Biden’s DOJ didn’t fight the courts.

Trump spent years blocking the files.
Now he pretends he liberated them.

This isn’t transparency — it’s revisionism.

Trumpenomics: The Decline of the US

bookmark_borderThe Physics Behind the 252-mph Gust: Why Hurricane Melissa Signals a New Era of Extreme Storms

By Daniel Brouse / November 19, 2025

Hurricane Melissa recorded a 252 mph wind gust, which shatters the previous highest record of 248 mph from Typhoon Megi in 2010, according to UCAR.

If you’re interested in flow dynamics… this is the highest verified hurricane wind speed ever recorded on Earth.

Climate change is increasing both the frequency and the intensity of extreme systems because the added thermal energy in the climate system does not stay as “heat” — it expresses itself through non-linear atmospheric dynamics. Warmer oceans load storms with more latent heat, more moisture, and stronger pressure gradients. That extra energy then appears as faster wind velocities, more violent updrafts, tighter eyewalls, and explosive rapid intensification cycles that didn’t occur at today’s frequency in the past.

In other words, we aren’t just “warming the air.”
We’re supercharging the fundamental physics of storms — momentum, turbulence, vorticity, and flow — which is why records like this are being broken more often and with greater severity.

The atmosphere is running on a different set of rules now — not because anyone “believes” in climate change, but because the math and the measurements leave no room for debate.

Start with the simplest fact in atmospheric science:
A warmer atmosphere holds about 7% more water vapor per 1°C of warming. That’s not a theory — that’s the Clausius–Clapeyron relation, a physical law.

We’ve warmed the planet more than 1°C already. That means storms today have 10–15% more moisture available, which translates directly into dramatically more energy and more violent rain.

Now connect this to flow dynamics:

1. Violent Rain: Mass × Velocity = Momentum

Raindrop size is increasing. Raindrop count is increasing.
And storms are producing higher wind velocities, which accelerate the droplets further.

Momentum p=mv.

More mass → more momentum.
More velocity → more momentum.
More momentum → more turbulence, more kinetic energy, more destructive power.

This isn’t speculation — it’s measurable.

2. Energy Release: Latent Heat

That extra water vapor carries enormous latent heat.
When it condenses, it releases energy that intensifies updrafts, pressure gradients, and storm organization. This creates:

  • faster strengthening
  • more explosive rainfall rates
  • more dangerous mesoscale convective systems
  • more catastrophic flash floods

This is why storms that used to drop 1–3 inches now dump 5–15 inches in a day.

3. Flow Dynamics After Rainfall

Once water hits the ground, the physics get even more brutal.

Force scales with the square of velocity (v²).

A 40 mph flow has 16× the force of a 10 mph flow.
And water is ~800× denser than air.

That is why modern flash floods move cars, rip out culverts, scour foundations, and carve out roads in seconds.

4. What You’re Calling “Not Climate Change”

The real world says otherwise:

  • Record-breaking rainfall events are happening at 4× the historical rate.
  • “1,000-year floods” are now occurring every few years.
  • Storms are intensifying faster and producing higher peak rainfall.
  • Several regions have already documented rainfall rates once considered meteorologically impossible.

This isn’t politics.
This isn’t a belief system.
This is physics — and we are watching it unfold in real time.

So yes… Climate change. Absolutely climate change.

Footnotes

NCAR has confirmed the 252 mph dropsonde gust in Hurricane Melissa as legitimate. Yes — it’s the highest ever recorded by a dropsonde and essentially tied with Cyclone Olivia’s 253 mph gust measured with ground instruments.

But focusing on whether it’s 1 mph higher or lower is meaningless in context. A 1 mph difference is statistically irrelevant when you’re dealing with storms undergoing record-breaking rapid intensification, unprecedented energy transfer, and historic drops in barometric pressure. These are the metrics that matter scientifically — and they’re the ones that are changing fastest.

The real story isn’t the bragging rights of a single gust measurement.
It’s that we are now routinely seeing:

  • extreme pressure falls that used to be once-in-a-lifetime events,
  • rapid intensification windows that defy past climatology,
  • and nonlinear energy spikes driven by warm SSTs and excess atmospheric moisture.

Melissa’s 252 mph gust is just one data point in a larger pattern: tropical cyclones are entering regimes of intensity that were virtually unknown in the pre-warming climate.

Recent Papers

The Human Induced Climate Change Experiment