U.S. consumer inflation accelerated sharply in May 2026, reaching its highest level in three years according to the latest data released by the Bureau of Labor Statistics (BLS).
The Consumer Price Index (CPI), the government’s primary measure of inflation, rose 4.2% over the previous twelve months, up from 3.8% in April and marking the highest annual inflation rate since April 2023.
Key Economic Figures
Headline CPI: +4.2% year-over-year
Monthly CPI Increase: +0.5%
Core CPI: +2.9% year-over-year (excluding food and energy)
Energy Index: +3.9% in May alone
Gasoline Prices: +7.0% during May
Energy prices accounted for more than 60% of the monthly increase in consumer prices, highlighting the dominant role of oil and fuel markets in the current inflation surge.
The Oil Shock Behind the Inflation Spike
The primary driver of rising inflation remains the disruption of global energy markets resulting from the ongoing conflict with Iran and restrictions affecting shipping through the Strait of Hormuz.
The Strait of Hormuz remains one of the world’s most important energy chokepoints, carrying a significant portion of globally traded crude oil. Continued military tensions have reduced available supply and pushed crude prices sharply higher.
Higher crude oil prices quickly filter through the economy:
Higher gasoline prices
Increased transportation costs
Rising manufacturing expenses
Higher food distribution costs
Increased utility and electricity prices
As a result, inflation pressures are spreading beyond energy markets into nearly every sector of the economy.
Other Major Inflation Categories
Americans are also facing rising costs in several essential categories:
Apparel: +4.8%
Electricity: +5.9%
Shelter: +3.4%
These increases are placing additional pressure on household budgets at a time when many consumers are already struggling with elevated borrowing costs and slowing wage growth.
A New Challenge for the Federal Reserve
The inflation report presents a significant challenge for newly appointed Federal Reserve Chairman Kevin Warsh.
While financial markets largely expect the Federal Reserve to leave interest rates unchanged at its next meeting, traders are increasingly pricing in the possibility of additional rate increases later this year if inflation continues to accelerate.
This creates a difficult balancing act:
Raising rates further risks slowing economic growth.
Failing to contain inflation risks allowing expectations to become entrenched.
Once businesses and consumers begin expecting higher inflation, they often adjust behavior accordingly—raising prices, demanding higher wages, and accelerating purchases. These behavioral changes can become self-reinforcing and make inflation significantly harder to control.
What makes the current situation particularly concerning is the condition of U.S. emergency oil reserves.
In an effort to offset rising fuel costs, the administration has aggressively drawn down the Strategic Petroleum Reserve (SPR), resulting in some of the largest withdrawals in the program’s history.
Record-Breaking Withdrawals
According to recent Energy Information Administration (EIA) data:
Nearly 10 million barrels were withdrawn during a single week in May.
Approximately 25 million barrels were released over a three-week period.
Total SPR inventories have fallen to roughly 349 million barrels, approaching levels not seen since the early 1980s.
The scale and speed of these withdrawals represent one of the largest emergency reserve deployments ever recorded.
Why the Reserve Is Being Drained
The releases are part of a broader coordinated effort among members of the International Energy Agency (IEA) to stabilize global energy markets.
Rather than conducting traditional sales, many of the releases have been structured as emergency exchanges, allowing energy companies to borrow crude oil now and return both the original volume and an additional premium after the crisis subsides.
The objective is straightforward: increase short-term supply and reduce pressure on fuel prices.
However, this strategy carries risks.
The Risks Ahead
The Strategic Petroleum Reserve exists as an emergency buffer against major supply disruptions.
As inventories fall, policymakers have fewer tools available to respond to future shocks.
If geopolitical tensions persist or worsen, markets may begin focusing less on current supply and more on the shrinking emergency reserve itself.
That creates the possibility of:
Higher oil-price volatility
Additional inflation pressures
Rising interest rates
Increased recession risks
Greater fiscal strain from higher government borrowing costs
Conclusion
The May inflation report highlights a growing reality: energy remains the foundation of the global economy.
Oil price shocks continue to ripple through transportation, manufacturing, housing, food production, and consumer spending.
With inflation now at a three-year high, interest rates under pressure, and emergency oil reserves being depleted at historically rapid rates, policymakers face increasingly difficult choices.
The coming months will likely depend heavily on developments in global energy markets and whether the current geopolitical disruptions prove temporary—or become a longer-lasting source of economic instability.
How hard will our generation make the struggle to thrive become a struggle merely to survive?
by Daniel Brouse and Sidd Mukherjee
June 10, 2026
Introduction
Unfortunately, we have already lost things that cannot be replaced or restored.
One of my favorite questions for people who dismiss the significance of climate change is simple:
How long do you think it takes to make six-million-year-old ice?
The answer, of course, is millions of years.
When ancient glaciers, ice sheets, ecosystems, coral reefs, forests, and species disappear, they do not return on timescales relevant to human civilization. Some losses are effectively permanent from the perspective of any society that will exist over the coming centuries or even millennia.
The reality is that many of the changes now unfolding across the Earth system cannot be reversed within a human lifetime. Yet this does not mean that the future is predetermined or that human actions no longer matter.
In fact, they matter enormously.
The Continued Role of Human Activities
A growing body of evidence suggests that Earth’s major climate systems are increasingly interconnected through a network of reinforcing feedback loops. Sea-level rise, polar amplification, ocean heat content, marine heatwaves, atmospheric rivers, Rossby-wave persistence, AMOC weakening, wildfire feedbacks, permafrost thaw, methane release, ecosystem shifts, and climatic whiplash all appear to be interacting in ways that increase complexity and reduce predictability.
Through our analysis of highly coupled nonlinear systems, we remain convinced that human forcing is still the primary driver and determinant of the ultimate outcome.
Many subsystems appear to be approaching—or perhaps have already crossed—important thresholds. The interactions among these systems make prediction increasingly difficult, and cascading responses are a legitimate concern. In a highly interconnected system, a seemingly modest perturbation can propagate through multiple pathways and produce consequences far larger than the original disturbance.
This possibility is precisely what makes climate change so dangerous.
Has the Climate System Become Autonomous?
An important question is whether humanity has already pushed the climate system beyond a point where it will continue to deteriorate regardless of future actions.
We are not yet convinced that this is the case.
The atmosphere, oceans, cryosphere, and biosphere are all responding to an energy imbalance that human activities continue to create. Greenhouse gas concentrations continue to rise. Fossil fuel combustion, land-use change, industrial processes, and ecosystem degradation continue to alter the balance of incoming and outgoing energy.
In this context, the strength, duration, and trajectory of human forcing still matter enormously.
While some tipping elements may already be in motion, there is little evidence that all future outcomes are now entirely independent of human influence. Rather, current observations suggest that human activities remain one of the most important variables governing how rapidly the climate system changes and how severe the consequences ultimately become.
Will the World Ever Be as It Was?
That does not appear possible.
The climate of the twentieth century is gone.
Many glaciers are retreating beyond recovery. Ancient ice is melting. Species are disappearing. Ecosystems are shifting. Ocean chemistry is changing. Sea levels will continue rising for centuries, and some changes already underway will persist for generations.
The question is no longer whether we can preserve the world exactly as it was.
We cannot.
The more important question is whether we can influence the world that follows.
Can We Influence How Bad It Gets?
The answer remains yes.
This is why continued focus on the acceleration of climate change is so important.
If human activities remain the dominant forcing mechanism, then reducing that forcing can still alter the trajectory of the system, even if we can no longer prevent many of the changes already set in motion.
The difference between a world that warms another degree and one that warms several more degrees is not an academic distinction.
It is the difference between:
More manageable versus catastrophic sea-level rise.
Regional crop disruptions versus widespread food insecurity.
Occasional extreme heat versus chronic heat stress.
Increased adaptation costs versus systemic economic disruption.
Partial ecosystem loss versus widespread ecological collapse.
Small differences in average temperature translate into enormous differences in impacts because climate risks do not increase linearly. They compound through feedbacks, thresholds, and cascading interactions.
The Moral Question
Ultimately, climate change is not simply an environmental issue. It is a question of human welfare, opportunity, and survival.
The decisions made today will determine the quality of life experienced by many generations to come. They will influence access to food, water, shelter, health, security, and economic stability. They will shape the future of coastal communities, agricultural regions, and ecosystems around the world.
Perhaps the most important question is not whether climate change can be stopped entirely.
It is this:
How hard will our generation make the struggle to thrive become a struggle merely to survive?
The future may no longer be capable of becoming what it once could have been. But it is still capable of becoming far better—or far worse—depending on the choices humanity makes today.
The world as it was may be gone.
The world that will be is still being written.
Feedback Loops → Tipping Points → Domino Effect
Feedback loops amplify climate change and can push interconnected Earth systems past critical tipping points. As tipping points are crossed, they can trigger additional feedback loops and destabilize other climate systems. This cascading “Domino Effect” compresses timescales, accelerates change, and increases the risk of rapid, nonlinear climate transformations.
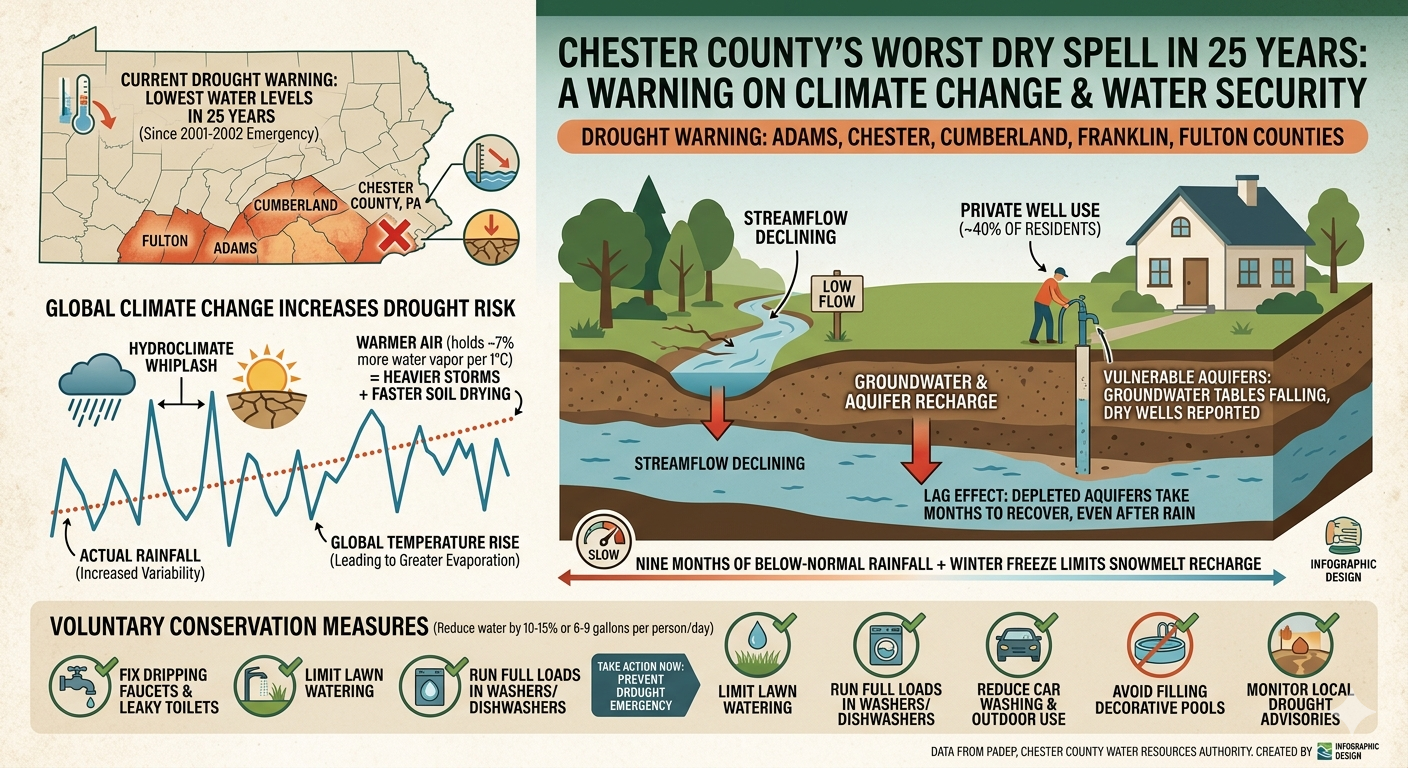
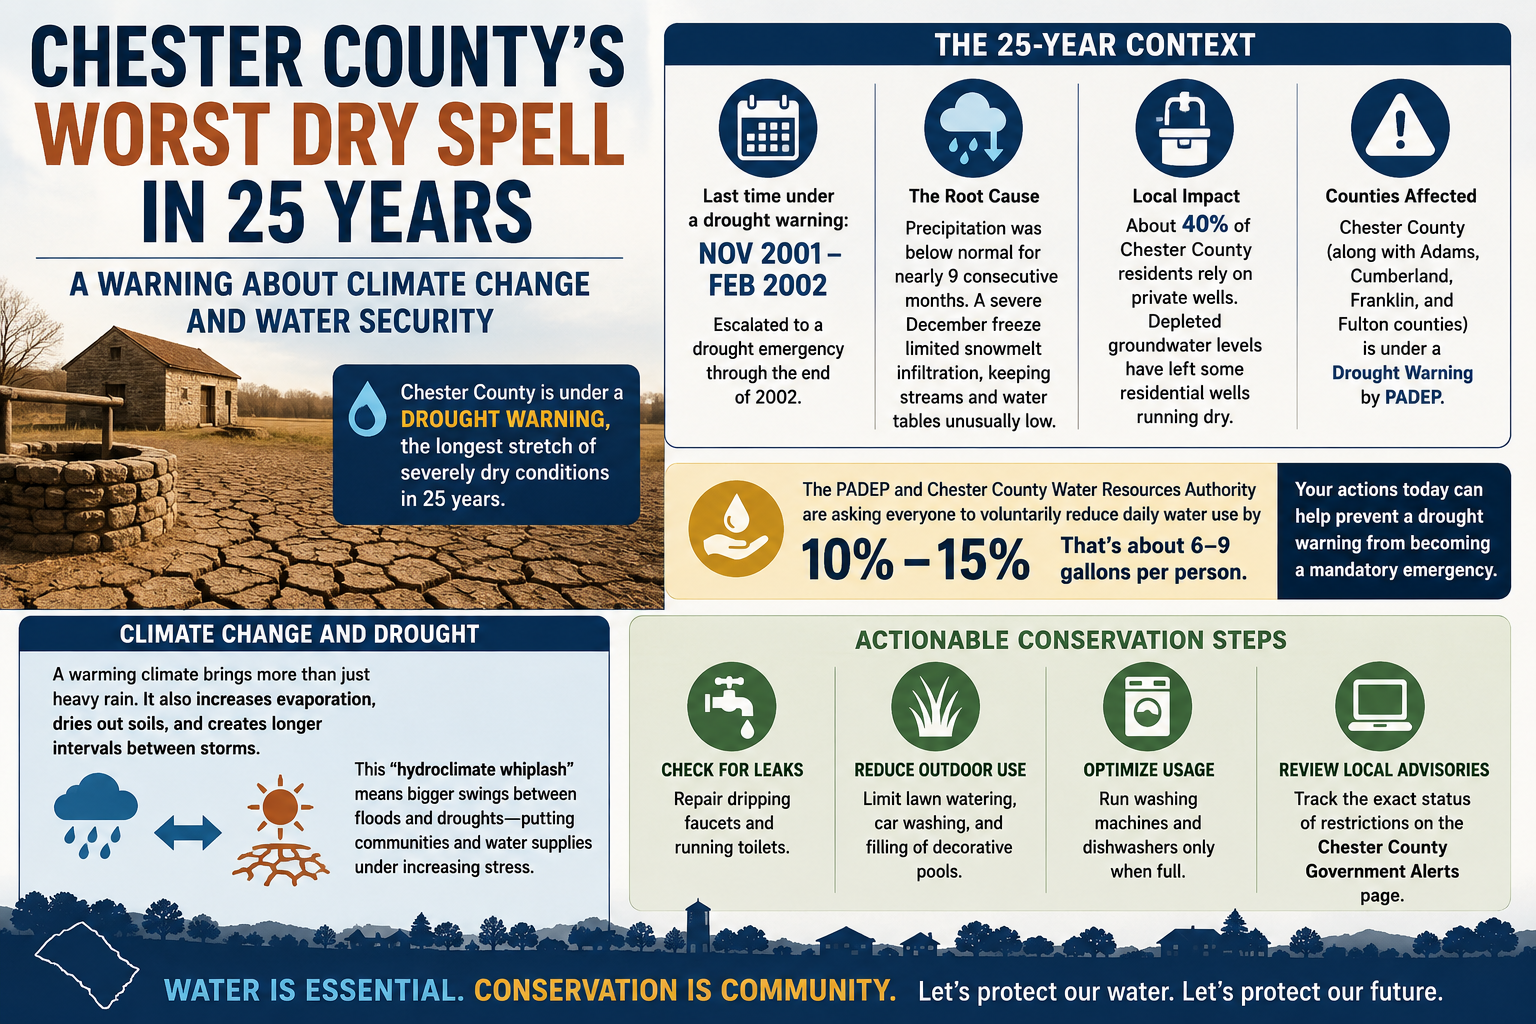
Chester County is currently experiencing its most significant drought conditions in 25 years, prompting the Pennsylvania Department of Environmental Protection (PADEP) to place the county under a Drought Warning. Chester County joins Adams, Cumberland, Franklin, and Fulton counties in the warning designation as groundwater levels, stream flows, and water reserves continue to decline.
The last time Chester County experienced comparable conditions was from November 2001 through February 2002. That drought ultimately intensified into a declared drought emergency that persisted through the end of 2002. Today’s warning serves as a reminder that prolonged water shortages remain a serious threat, even in regions traditionally known for abundant rainfall.
Nine Months of Below-Normal Rainfall
The current drought developed after nearly nine consecutive months of below-average precipitation. Compounding the problem, a severe winter freeze limited snowmelt infiltration into the ground, preventing aquifers from receiving the recharge they normally depend upon during the colder months.
As a result, groundwater levels have steadily declined, stream flows have dropped, and reservoirs have struggled to recover. The impacts are particularly severe for the approximately 40 percent of Chester County residents who rely on private wells for their water supply. Some homeowners have already reported wells running dry as water tables continue to fall.
Climate Change and the Growing Risk of Drought
While droughts are a natural part of Pennsylvania’s climate, climate change is increasing the likelihood of both extreme wet and extreme dry conditions.
A warming atmosphere can hold approximately 7 percent more water vapor for every 1°C increase in temperature. This additional moisture often results in heavier downpours and more intense storms. However, the same warming also increases evaporation from soils, vegetation, streams, and reservoirs. The result is a growing tendency toward what scientists call “hydroclimate whiplash”—rapid swings between flooding and drought.
The Mid-Atlantic region has already experienced a rise in extreme precipitation events, but these periods of intense rainfall are increasingly separated by longer dry intervals. Heavy storms may temporarily replenish rivers and reservoirs, yet much of the water can run off quickly rather than soaking deeply into the ground where it can recharge aquifers.
For groundwater-dependent communities like Chester County, this pattern presents a growing challenge. Even when annual rainfall totals appear near normal, the timing and intensity of precipitation can leave water supplies vulnerable.
Why Groundwater Matters
Groundwater serves as a critical buffer during dry periods. It sustains private wells, supports stream flows, and helps maintain ecosystem health when rainfall is scarce.
When drought persists, groundwater levels decline more slowly than surface water, but they also recover more slowly. This lag effect means that even after rainfall returns, water tables may remain depressed for months or longer.
The current drought demonstrates how vulnerable groundwater systems can become after extended periods of below-normal precipitation.
What Residents Can Do
The PADEP and the Chester County Water Resources Authority are asking residents, businesses, and farmers to voluntarily reduce water consumption by 10 to 15 percent, equivalent to approximately six to nine gallons per person per day.
Simple conservation measures can make a meaningful difference:
Repair dripping faucets and running toilets.
Limit lawn watering and other outdoor irrigation.
Reduce car washing and unnecessary outdoor water use.
Avoid filling decorative pools and water features.
Run dishwashers and washing machines only when fully loaded.
Monitor local drought advisories and conservation recommendations.
These voluntary actions can help prevent conditions from deteriorating into a mandatory drought emergency.
A Glimpse of the Future
The current drought warning is more than a temporary weather event. It offers a glimpse into the challenges communities may increasingly face as climate change alters precipitation patterns and intensifies hydrological extremes.
Chester County’s longest severe dry spell in a quarter century underscores the importance of protecting groundwater resources, improving water conservation, and preparing for a future in which both floods and droughts become more disruptive.
The lesson is clear: climate change is not simply making wet places wetter or dry places drier. It is increasing variability itself, creating larger swings between extremes and placing greater stress on the water systems that communities depend upon every day.
Don’t Be Fooled by Oil Futures: The Hidden Supply Crunch in U.S. Commercial Inventories and the Strategic Petroleum Reserve at Multi-Decade Lows
Introduction: Paper Markets vs. Physical Reality
Oil futures markets are currently sending a deceptively calm signal. Prices appear to reflect a system that is balanced, or at least manageable. But beneath that surface, physical supply conditions tell a very different story.
U.S. strategic and commercial petroleum inventories are being drawn down at a pace that has few modern precedents. These withdrawals are occurring while global supply chains remain under severe stress, driven by geopolitical disruptions and constrained spare capacity.
Reports indicate that disruptions in Middle East production and shipping routes—including instability affecting the Strait of Hormuz—have removed a significant share of global export capacity. Even partial disruptions in this corridor can reverberate through global energy markets because it is one of the world’s most critical chokepoints for crude oil and LNG flows.
In response, the United States has increasingly functioned as a marginal global supplier—exporting crude and refined products while simultaneously drawing down domestic emergency reserves. This dual role is tightening internal buffers even as external risks remain elevated.
The Strategic Petroleum Reserve (SPR): Near Multi-Decade Lows
The U.S. Strategic Petroleum Reserve (U.S. Department of Energy) has declined to levels not seen in roughly four decades.
Current Status
Approximately 357.1 million barrels, according to recent estimates
Down from about 413 million barrels earlier in the year
Approaching levels last seen in the early 1980s
Magnitude of Drawdowns
Recent and cumulative withdrawals have been historically large:
~172 million barrels released under emergency policy actions in the current cycle
~180 million barrels released during the 2022 energy shock associated with the Russia–Ukraine conflict
While each drawdown has been framed as a stabilization tool for global markets, the cumulative effect has been a significant erosion of strategic buffer capacity.
Operational Constraints: The “Minimum Fill” Problem
The SPR is not simply a tank that can be emptied to zero. It is a geologically engineered salt-cavern system that requires a minimum working volume to maintain pressure balance and structural integrity.
Industry analysts, including references from the American Petroleum Institute, have warned that:
The system may require ~20% minimum fill to remain operationally stable
This implies a functional floor on usable inventory somewhere in the 70–150 million barrel range, depending on configuration assumptions
In other words, not all remaining barrels are economically or technically deployable in a crisis.
Commercial Crude Inventories: Tightening Beneath the Surface
While strategic reserves attract attention, commercial inventories often provide a more immediate signal of market stress.
Weekly Inventory Drawdowns
Data from the U.S. Energy Information Administration indicates:
A recent ~8 million barrel weekly drawdown in commercial crude inventories
Total commercial crude stocks near 433.7 million barrels
Approximately 3% below the five-year seasonal average
On the surface, this deviation may appear modest. However, oil markets are highly sensitive to small changes in inventory when spare capacity is limited.
Refined Products: The Hidden Constraint in Gasoline Supply
Crude oil availability is only part of the equation. Refined product inventories—especially gasoline and distillates—are often the true bottleneck for consumer price spikes.
Gasoline inventories have fallen by approximately 38 million barrels
This reduction is large enough to materially erode the typical seasonal buffer heading into peak summer demand
When refined product inventories decline faster than crude stocks, it signals stress not just in production, but in downstream refining capacity and logistics.
Cushing and the “Tank Bottom” Effect
One of the most important physical hubs in the U.S. oil system is Cushing, Oklahoma, the delivery point for West Texas Intermediate (WTI) futures contracts.
At low inventory levels, storage hubs face what industry operators call “tank bottoms”—the minimum operational level required to:
Keep pipeline flows stable
Maintain pump functionality
Avoid contamination and pressure issues
Preserve deliverability for futures contracts
When inventories approach these thresholds:
Market liquidity becomes constrained
Price volatility increases
Futures pricing can diverge sharply from physical spot realities
Even if headline inventories appear adequate, low usable storage capacity can create localized shortages and logistical bottlenecks.
Why Oil Futures May Be Misleading the Market
Oil futures prices are influenced by expectations, financial positioning, and macroeconomic sentiment—not just physical inventory conditions.
This creates a structural risk: Markets can appear balanced while physical systems are tightening.
Key disconnects include:
Futures reflect expected future supply, not immediate deliverable barrels
Financial hedging can suppress or amplify price signals
Strategic releases can temporarily mask underlying shortages
Export flows can tighten domestic availability even when national production is high
As a result, futures markets may understate near-term physical constraints, especially when inventories are simultaneously declining across both strategic and commercial categories.
Outlook: A System Operating with Reduced Buffers
Taken together, three conditions define the current landscape:
Strategic reserves near multi-decade lows
Commercial crude inventories below seasonal norms
Refined product and storage constraints tightening simultaneously
Even if geopolitical disruptions ease, inventory rebuilding takes time. Most supply forecasts suggest that normalization would require sustained production surpluses over multiple quarters—not weeks.
Industry projections increasingly suggest that price instability could persist into 2026–2027, particularly if global chokepoints remain vulnerable or if demand surprises to the upside.
Conclusion
The key risk in today’s oil market is not necessarily immediate scarcity—it is reduced resilience.
When both strategic buffers and commercial inventories are drawn down simultaneously, the system becomes highly sensitive to shocks that would previously have been absorbed without major price disruption.
In this environment, oil futures may not fully reflect the physical tightness of the system, particularly when storage constraints, refinery bottlenecks, and geopolitical risks converge.
The result is a market that appears stable in financial terms, but increasingly fragile in physical terms.
“Climate-driven changes in Earth’s rotation may be contributing to navigational uncertainties that negatively affect battlefield outcomes and increase the risk of civilian casualties in contemporary conflicts.”
by Daniel Brouse and Sidd Mukherjee
Abstract
Climate change is increasingly altering the physical dynamics of Earth itself. Accelerating ice-sheet loss, sea-level rise, and large-scale redistribution of mass are changing the planet’s rotation rate, shifting its axis of rotation, and introducing increasingly nonlinear behavior into Earth system processes. Recent studies indicate that climate-driven ice melt is lengthening Earth’s day by approximately 1.33 milliseconds per century, making climate change a dominant driver of long-term rotational change. Beyond the slowing of rotation, the acceleration and third derivative (“jerk”) of these changes may represent a more significant concern because they reduce predictability within systems that depend on precise measurements of time, position, and motion. The consequences extend beyond geophysics into GPS accuracy, satellite operations, spacecraft navigation, autonomous systems, and potentially military guidance technologies. This paper examines the emerging science of climate-driven rotational change and places it within the broader context of accelerating Earth-system feedback loops and nonlinear climate dynamics.
Introduction
Earth’s rotation has never been perfectly constant. Variations occur naturally through interactions among the atmosphere, oceans, mantle, core, tides, and cryosphere. Historically, these fluctuations have remained within ranges that can be modeled and predicted through established geophysical processes.
Anthropogenic climate change is introducing a new forcing mechanism into this system. Accelerated melting of glaciers and polar ice sheets is redistributing trillions of tons of mass from high latitudes toward the oceans. This redistribution alters Earth’s moment of inertia and changes the speed and orientation of the planet’s rotation.
While changes in rotational velocity have attracted growing scientific attention, the acceleration and higher-order derivatives of those changes may prove even more significant. The third derivative, commonly referred to as “jerk,” measures how rapidly acceleration itself is changing. Increasing jerk-behavior is often a hallmark of nonlinear systems approaching new states of instability or unpredictability.
The significance of these changes extends far beyond the length of the day. Modern civilization depends upon precise timing, positioning, navigation, and reference-frame stability. Small changes in Earth’s rotational behavior can cascade through technologies that form the foundation of the modern world.
Climate Change and Earth’s Rotational Slowdown
In 2024, researchers from ETH Zurich, NASA’s Jet Propulsion Laboratory, and collaborating institutions demonstrated that climate change has become an increasingly dominant influence on Earth’s rotation. Their work showed that melting ice sheets redistribute mass from the poles toward lower latitudes, increasing Earth’s moment of inertia and slowing the planet’s rotation in a manner analogous to a spinning figure skater extending their arms.
A March 2026 analysis published in the Journal of Geophysical Research: Solid Earth quantified the effect, estimating that climate-driven ice melt is lengthening Earth’s day by approximately 1.33 milliseconds per century. While seemingly small, this represents a measurable and accelerating alteration of one of the planet’s most fundamental physical properties.
Researchers further concluded that the climate-driven component of Earth’s rotational slowdown now exceeds many natural long-term influences and may represent the most rapid climate-related rotational change observed in millions of years.
Polar Motion and the Changing Shape of Earth
The effects of ice-sheet loss are not limited to rotational speed.
As glaciers and ice sheets melt, the redistribution of water mass changes Earth’s shape and alters the position of its rotational axis. Research published in Geophysical Research Letters found that global warming has accelerated the movement of Earth’s rotational pole since the 1990s.
Several mechanisms contribute to this phenomenon:
Redistribution of meltwater toward lower latitudes.
Gravitational migration of ocean mass.
Centrifugal redistribution of water toward the equatorial bulge.
Glacial Isostatic Adjustment (GIA), in which land previously compressed by massive ice sheets slowly rebounds upward as ice disappears.
Together, these processes alter both Earth’s moment of inertia and the orientation of its spin axis. The result is a planet whose rotational geometry is changing more rapidly than at any point during the modern observational era.
The Third Derivative: Jerk-Behavior in the Earth System
Velocity measures change.
Acceleration measures changing velocity.
Jerk measures changing acceleration.
In engineering, aerospace systems, and control theory, jerk is often more important than velocity because it determines how predictable a system remains under changing conditions.
Earth’s rotational system now appears to be exhibiting measurable jerk-behavior driven by climate-induced mass redistribution. This means that not only is Earth slowing, but the rate at which it is slowing is itself changing.
Such behavior introduces challenges for predictive models because assumptions based upon previous rates of change become increasingly unreliable. Systems must be updated more frequently, and uncertainty grows as the underlying dynamics become increasingly nonlinear.
The emergence of measurable jerk-behavior may represent one of the clearest physical indicators that climate change is influencing fundamental planetary-scale processes.
Earth Orientation Parameters and Navigation Systems
Modern navigation depends on the precise relationship between celestial and terrestrial coordinate systems.
The International Celestial Reference Frame (ICRF) provides a stable astronomical reference framework based on distant quasars. The International Terrestrial Reference Frame (ITRF) defines geographic coordinates fixed to Earth’s surface.
Earth Orientation Parameters (EOPs) connect these systems.
Organizations such as the International Earth Rotation and Reference Systems Service (IERS) continuously monitor changes in:
Length of day
Polar motion
Axial orientation
Precession
Nutation
As climate-driven changes accelerate, EOP calculations become increasingly important. Even centimeter-scale errors in Earth’s reference frame can propagate into navigation errors measured in hundreds of meters across interplanetary distances.
The growing variability in Earth’s rotation increases the complexity of maintaining accurate coordinate transformations between space-based and Earth-based systems.
GPS, Spacecraft, and Inertial Navigation
Global Positioning System (GPS) satellites rely upon extremely precise timing and rotational models.
Unexpected changes in Earth’s orientation can create discrepancies between modeled and actual positions. These discrepancies must be corrected through continual updates to Earth orientation parameters.
The same challenge affects:
Satellite tracking
Spacecraft navigation
Astronomical observations
Geodesy
Autonomous transportation systems
Long-range communication networks
Inertial Navigation Systems (INS) face an additional challenge because they operate by integrating acceleration and rotational measurements relative to Earth itself.
As Earth’s rotational characteristics evolve, assumptions embedded within inertial guidance algorithms require more frequent recalibration. Small errors can accumulate over long distances and extended operational periods.
Sea-Level Rise Commitments and Long-Term Rotational Change
The rotational changes observed today are unlikely to stabilize quickly.
Research on the Greenland Ice Sheet has demonstrated that substantial future melting is already committed due to past greenhouse gas emissions. A study led by Jason Box and colleagues concluded that even if emissions ceased immediately, Greenland alone is committed to producing at least 27 centimeters of global sea-level rise.
Subsequent analyses suggest that realistic outcomes may substantially exceed this minimum estimate.
This committed melting implies continued redistribution of mass for decades and potentially centuries. As a result, climate-driven changes in Earth’s rotation, polar motion, and reference-frame stability are likely to continue long after greenhouse gas emissions peak.
The rotational consequences therefore represent not merely a current phenomenon but a long-term geophysical response that may unfold over generations.
Climate Feedback Loops and Nonlinear Dynamics
Understanding Earth’s changing rotation requires understanding the broader climate system in which it occurs.
Climate change is not a simple linear process. It is a dynamic system characterized by numerous interacting feedback loops, including:
Each feedback influences the others through interconnected physical, biological, and social systems.
These interactions create nonlinear responses in which relatively small disturbances can trigger disproportionately large outcomes. The accelerating changes observed in Earth’s rotation may therefore be viewed as one manifestation of a broader planetary trend toward increasing systemic instability and complexity.
Defense and Strategic Implications
Modern military and aerospace systems depend heavily on precision navigation.
Long-range missiles, autonomous drones, hypersonic vehicles, spacecraft, and surveillance platforms all rely upon accurate reference frames and rotational models.
As Earth orientation becomes more variable, maintaining precision requires increasingly sophisticated updates and corrections.
Climate-driven changes in Earth’s rotation may be contributing to navigational uncertainties that negatively affect battlefield outcomes and increase the risk of civilian casualties in contemporary conflicts. As rotational variability increases, the growing complexity of Earth orientation modeling presents an emerging strategic challenge for navigation-dependent systems, including long-range guided munitions, autonomous drones, satellite operations, and other precision-targeting technologies.
Further research is needed to quantify these effects under operational conditions.
Conclusion
Climate change is altering not only Earth’s atmosphere, oceans, and ecosystems but also the planet’s physical rotation.
Accelerated melting of glaciers and ice sheets is slowing Earth’s rotation, shifting its axis, changing its shape, and introducing increasing levels of acceleration and jerk-behavior into planetary dynamics.
Recent research suggests that climate-driven rotational changes are now occurring at rates unprecedented in millions of years. These changes are becoming increasingly relevant to GPS systems, spacecraft navigation, Earth orientation modeling, geodesy, and other technologies dependent upon extreme precision.
Viewed within the larger framework of interacting climate feedback loops and nonlinear Earth-system dynamics, the changing rotation of Earth may represent one of the most fundamental indicators that anthropogenic climate change is affecting the physical mechanics of the planet itself.
Box, J. E., Colgan, W., et al. (2022). Greenland Ice Sheet Climate Disequilibrium and Committed Sea-Level Rise. Nature Climate Change.
Dill, R., Soja, B., Chen, J., et al. (2024). The Increasingly Dominant Role of Climate Change on Length of Day. Proceedings of the National Academy of Sciences, 121(28).
ETH Zurich Geodesy and Geodynamics Group. Research on Earth Rotation, Climate Change, and Earth Orientation Parameters.
International Earth Rotation and Reference Systems Service (IERS). Earth Orientation Parameters Technical Bulletins.
NASA Jet Propulsion Laboratory (JPL). Climate-Driven Changes in Earth Rotation and Polar Motion.
Wang, J., et al. (2021). Climate-Driven Polar Motion Since the 1990s. Geophysical Research Letters.
I saw an interesting climate story today about the future of the Jersey Shore and the growing challenges posed by sea-level rise, coastal erosion, and increasingly frequent flooding events.
One of my earliest climate-related case studies dates back to the 1990s and involved the Atlantic City casino industry. At the time, I was examining how major businesses were investing in vulnerable shoreline real estate and whether those investments adequately accounted for long-term climate risks.
Some of the ideas being discussed then were remarkably ambitious. Among them were concepts involving casinos built on stilts or even floating platforms, with visitors ferried back and forth from the mainland. From both a climate science perspective and an economic perspective, I viewed these proposals as problematic. As I was developing one of my first climate-adjusted real estate valuation models, it became increasingly clear that rising seas, stronger coastal storms, and accelerating erosion would create risks that could not be solved simply by elevating structures.
More than three decades later, a recent news story suggests that elements of that future are already emerging.
Elevated Adaptation on a Disappearing Shoreline
The story focuses on Showboat Resort owner Bart Blatstein and his plans to build an elevated beach club on Atlantic City’s historic Garden Pier. The project is intended to provide visitors with a beach experience while avoiding a growing problem that has become increasingly difficult to ignore: the beach itself is disappearing.
The northern section of Atlantic City’s shoreline has experienced severe and persistent erosion. Winter storms, stronger wave action, rising sea levels, and long-term coastal change have repeatedly stripped away sand, leaving sections of the beach narrower and less usable than in previous decades. In some areas, finding enough dry sand to comfortably support traditional beach recreation has become increasingly difficult.
Rather than attempting to restore the traditional beach environment at ground level, the elevated beach club effectively bypasses the problem. Built above the shoreline on the 113-year-old Garden Pier, the facility allows visitors to experience coastal amenities without direct dependence on a stable sand base that is increasingly unreliable.
From a business standpoint, the project represents an adaptive innovation. From a climate perspective, it may also reflect something broader: the early stages of structural redesign in coastal economies that are adjusting to long-term shoreline instability.
Atmospheric Rivers, Storm Surge, and Accelerated Erosion
Coastal adaptation pressures are not occurring in isolation. Extreme precipitation and storm systems are increasingly amplifying shoreline loss.
A documented example from Ocean City, New Jersey, shows how atmospheric rivers combined with storm surge can dramatically accelerate coastal erosion events. When intense moisture-laden systems intersect with high tides and coastal storm conditions, wave energy and flooding impacts compound, leading to rapid beach loss and infrastructure stress.
It is important to note that these impacts vary depending on local geography, land use, and coastal defenses. However, the underlying pattern is consistent: increasing atmospheric moisture and storm intensity are contributing to more extreme coastal erosion episodes.
Nuisance Flooding and Chronic Coastal Inundation
Long-term sea-level rise is also reshaping coastal risk profiles in less dramatic but more persistent ways.
According to NOAA analyses, “nuisance flooding” — defined as minor but disruptive flooding events that overwhelm infrastructure, close roads, and damage property — has increased by approximately 300% to 925% along U.S. coastlines since the 1960s.
As documented in Atlantic City, New Jersey, nuisance flooding has increased dramatically, with a reported 682% surge since the mid-20th century. These events are no longer limited to major storms. Instead, they now occur during high tides and moderate weather conditions due to rising baseline sea levels and reduced natural buffering systems.
As NOAA oceanographer William Sweet has noted, rising sea levels increase the baseline height of tides and storm surge, meaning that flooding now occurs more frequently even in the absence of extreme weather. These incremental events gradually erode infrastructure resilience and accumulate long-term economic costs.
A Shifting Coastal Economy
Taken together, these trends show that the Jersey Shore is transitioning from a stable recreational coastline into a dynamically changing system where erosion, flooding, and storm impacts are increasingly central to economic planning.
Historically, beaches have been among the most valuable economic assets along the Jersey Shore. Hotels, casinos, restaurants, and boardwalk infrastructure all depend on predictable coastal geography. As that stability declines, communities are forced into continuous cycles of adaptation: replenishing sand, elevating structures, redesigning infrastructure, and relocating assets.
Each adaptation reduces vulnerability temporarily but does not address the underlying driver: a changing coastal baseline shaped by rising seas and intensifying storm systems.
Conclusion: Adaptation Under Constraint
The Garden Pier project may ultimately succeed as a tourism and economic attraction. However, it also serves as a visible marker of a broader transition already underway along vulnerable coastlines.
The central lesson is not that adaptation is failing, but that it is becoming increasingly costly and structurally necessary. Coastal economies are being forced to redesign themselves around environmental conditions that are no longer stable.
Moral of the story: adaptation is increasingly becoming a cost of doing business along vulnerable coastlines, but it does not resolve the underlying drivers of change. As climate impacts accelerate, the cost and complexity of adaptation increase. Mitigation remains the only long-term strategy capable of stabilizing the system.
How Fast Is Climate Change Changing?
Evidence for Nonlinear Acceleration Across Multiple Earth System Indicators
Earth Rotation Climate Change Rate Unseen in 3.6 Million Years: GPS Precision at Stake
Melting ice is lengthening days at an unmatched rate in 3.6 million years
By Daniel Brouse and Sidd Mukherjee
June 7, 2026
Abstract
Climate change is increasingly characterized not only by rising mean temperatures and sea levels, but by accelerating rates of change across multiple coupled Earth systems. Within the framework of the Nonlinear Acceleration Hypothesis, observational data suggest that the Earth system is not responding linearly to radiative forcing, but instead exhibiting feedback-amplified dynamics consistent with accelerating response timescales.
Early formulations of this hypothesis in the 1990s estimated acceleration behavior on the order of ~2^1-fold per century doubling dynamics. More recent multi-indicator analyses suggest substantially shorter characteristic timescales, consistent with stronger feedback amplification on the order of ~2^6-fold on decadal scales, corresponding to an approximate ~60× increase in effective growth constant or approaching two orders of magnitude acceleration of the entire system.
This paper synthesizes multiple observational indicators—including sea level rise, cryospheric mass loss, and changes in Earth’s rotational dynamics—to evaluate whether climate change is accelerating in a nonlinear, feedback-driven manner.
1. Introduction: From Linear Change to Nonlinear Acceleration
Traditional climate frameworks often describe change as gradual and proportional to forcing. However, an increasing body of observational evidence suggests that key components of the Earth system exhibit nonlinear behavior, where feedbacks amplify initial warming into cascading system responses.
Under the Nonlinear Acceleration Hypothesis, climate change is not only increasing in magnitude but also in rate of change. This implies that the system’s “speed” is itself evolving, driven by reinforcing feedback loops involving ice loss, ocean heat uptake, sea level rise, and changes in planetary angular momentum distribution.
2. Evolution of Observed Acceleration Rates
When the Nonlinear Acceleration Hypothesis was first developed in the 1990s, observed acceleration behavior across climate indicators was consistent with approximately ~2^1-fold per century doubling-type dynamics.
More recent analyses incorporating multiple independent datasets suggest significantly shorter characteristic timescales, consistent with stronger feedback amplification:
~2^6-fold acceleration on a decadal basis
~60× increase in effective growth constant relative to early estimates
Nearly two orders of magnitude increase in apparent system response speed
These values represent a convergence of multiple accelerating indicators rather than a single linear trend.
3. Sea Level Rise as a Primary Integrated Signal
Sea level rise (SLR) remains one of the most comprehensive integrative indicators of climate system change, reflecting:
Ocean thermal expansion
Ice sheet and glacier mass loss
Gravitational redistribution
Solid Earth deformation and isostatic adjustment
Because SLR integrates multiple processes, it serves as a leading composite metric for evaluating long-term climate acceleration.
4. Cryosphere–Rotation Coupling: Changes in Earth’s Spin
A second independent indicator of large-scale system change is the effect of ice melt on Earth’s rotation.
Recent analyses suggest that melting ice is measurably altering Earth’s angular momentum distribution, producing detectable changes in rotation rate and polar motion. One reported summary states:
“Melting ice is lengthening days at an unmatched rate in 3.6 million years, straining GPS precision.”
Additional geophysical research indicates that:
Ice mass redistribution alters Earth’s moment of inertia
Conservation of angular momentum drives compensatory rotational changes
Glacial isostatic adjustment contributes to long-term deformation of the solid Earth system
A March 2026 study published in the Journal of Geophysical Research: Solid Earth quantifies this effect as:
~1.33 milliseconds per century lengthening of Earth’s day due to climate-driven ice melt
These results are described as unprecedented in the Late Pliocene geological record.
“In our earlier work, we showed that the accelerated melting of polar ice sheets and mountain glaciers in the 21st century is raising sea levels, which slows Earth’s rotation and therefore lengthens the day — similar to a figure skater who spins more slowly once they stretch their arms, and more rapidly once they keep their hands close to their body,” explains Mostafa Kiani Shahvandi of the University of Vienna’s Department of Meteorology and Geophysics. “What remained unclear was whether there were earlier periods when climate increased day length at a similarly rapid pace.”
5. Earth System Geometry and Mass Redistribution
Beyond rotation, climate-driven mass redistribution is altering Earth’s physical structure:
Reduction of polar ice load
Redistribution of mass toward lower latitudes
Ocean basin loading changes due to sea level rise
Solid Earth viscoelastic rebound
These processes are coupled through gravity, rotation, and fluid dynamics, forming an integrated Earth system response rather than isolated regional effects.
6. Synthesis: Evidence for System-Wide Acceleration
Across multiple independent indicators, a consistent pattern emerges:
Sea level rise is accelerating
Ice mass loss is accelerating
Earth rotation changes are accelerating
Geophysical redistribution processes are intensifying
A March 2026 study synthesis of geodetic and geophysical observations further supports the magnitude of these changes and their unprecedented rate in the modern geologic record:
When viewed collectively, these indicators are consistent with a nonlinear Earth system response in which feedbacks amplify baseline warming into broader systemic change.
7. Conclusion
The available evidence suggests that climate change is increasingly characterized by accelerating rates of system response across multiple Earth domains. Within the framework of the Nonlinear Acceleration Hypothesis, these observations are consistent with a coupled system in which feedback loops govern not only the magnitude of change but the speed at which change unfolds.
Sea level rise, ice mass loss, and measurable changes in Earth’s rotational dynamics collectively suggest that the Earth system is entering a regime of enhanced sensitivity, where relatively small additional forcing may produce disproportionately large and rapidly emerging responses.
Understanding the true rate of climate change therefore requires moving beyond static trend analysis and toward a dynamic framework that accounts for feedback amplification, cross-system coupling, and nonlinear acceleration across the entire Earth system.
A recent Reuters report highlighted a familiar concern in Alberta: another wildfire season threatening Canada’s oil sands region. The article focused primarily on risks to energy production, facility shutdowns, and the economic impacts of increasingly severe wildfire activity. Yet an important aspect of these events often goes overlooked. Beyond the immediate threats to infrastructure and public safety lies a much larger atmospheric consequence: ozone formation.
Wildfires and fossil fuel production intersect in ways that can amplify air pollution, damage ecosystems, and accelerate climate change. The resulting ozone feedback may be one of the least recognized but most significant consequences of recurring wildfire seasons in Canada’s oil sands region.
Wildfires Are Also Ozone Events
When boreal forests burn, they release enormous quantities of atmospheric pollutants, including nitrogen oxides (NOₓ), volatile organic compounds (VOCs), carbon monoxide (CO), methane (CH₄), and fine particulate matter.
These emissions are the raw ingredients required for the formation of ground-level, or tropospheric, ozone.
Unlike smoke, ozone is not emitted directly by a fire. Instead, it forms downwind as wildfire emissions react in sunlight. As smoke plumes age and travel, ozone concentrations can continue to increase hundreds or even thousands of miles from the fire itself.
This means that a wildfire burning near Fort McMurray is not merely a local event. It can become an ozone-producing system affecting air quality across much of North America.
The Oil Sands Region as an Ozone Amplifier
The Alberta oil sands region contains a vast network of industrial facilities, including extraction operations, upgraders, power generation facilities, transportation systems, and processing plants.
These activities emit additional nitrogen oxides, volatile organic compounds, and methane.
When wildfire emissions mix with industrial emissions, atmospheric chemistry becomes even more favorable for ozone production. In effect, wildfire smoke and fossil fuel emissions can work together to create enhanced ozone formation.
The result is not simply more smoke, but more ozone—a pollutant that affects human health, agricultural productivity, forest growth, and climate.
Long-Distance Impacts
The greatest ozone impacts may occur far from the fires themselves.
Canadian wildfire smoke routinely travels across the United States, reaching cities such as Chicago, New York, Philadelphia, Washington, and Boston. While residents often notice visible haze, they may be less aware of the invisible ozone that develops as those smoke plumes age.
Recent studies suggest that wildfire-driven ozone is increasingly offsetting decades of progress made through reductions in vehicle and industrial emissions.
In other words, communities may experience worsening ozone pollution despite continued improvements in traditional air-quality controls.
Ozone Damage to Boreal Forests
The Reuters article understandably focused on the threat wildfires pose to oil production. However, the surviving forests face another threat after the flames pass.
Ozone is toxic to vegetation.
When ozone enters leaves through plant stomata, it damages cellular structures involved in photosynthesis. The result is reduced growth, increased stress, greater vulnerability to disease, and diminished carbon uptake.
This self-reinforcing cycle links wildfire activity directly to ecosystem decline and climate acceleration.
Methane and the Global Ozone Pathway
The oil sands region also contributes methane emissions associated with extraction, processing, transportation, and storage.
Methane plays two climate roles.
First, it acts as a powerful greenhouse gas.
Second, methane oxidation contributes to the formation of background tropospheric ozone on a global scale.
Unlike wildfire-generated ozone, which forms over hours or days, methane-driven ozone develops over months and years. The result is a persistent increase in global ozone concentrations that affects ecosystems far from the original emission source.
This means the oil sands region can contribute simultaneously to both short-term wildfire-driven ozone events and long-term methane-driven ozone accumulation.
The Hidden Climate Feedback
Viewed through the lens of atmospheric chemistry, the story of Canada’s oil sands and wildfires extends far beyond threats to energy production.
Three interconnected systems are converging:
Climate change is increasing wildfire frequency and intensity.
Wildfires are releasing massive quantities of ozone precursors.
Oil and gas operations contribute additional precursor emissions and methane.
Together, these processes increase ozone concentrations, damage ecosystems, weaken carbon sinks, and contribute to additional warming.
The result is a powerful climate feedback loop in which wildfires, ozone formation, ecosystem decline, and fossil fuel emissions reinforce one another.
While the flames themselves draw the headlines, the ozone produced in their wake may represent one of the most significant long-term consequences of wildfire activity in the oil sands region. Invisible, widespread, and persistent, ozone serves as a critical link connecting wildfires, fossil fuel development, ecosystem degradation, and climate change.
Global wildfire trends are more complicated than simply counting the number of fires. Scientists are increasingly concerned about the growth of extreme, high-intensity fires, the amount of carbon released, the length of fire seasons, and the expansion of fires into ecosystems that historically burned less frequently.
Did you know that major Canadian wildfires can generate ozone and ozone precursors that are transported into the United States, degrading air quality and affecting public health hundreds or even thousands of miles away? The smoke doesn’t just contain particulate pollution—it also contributes to the formation of ground-level ozone, a pollutant linked to respiratory disease, climate warming, reduced plant productivity, and diminished CO₂ sequestration. Ozone damages vegetation by impairing photosynthesis and weakening plant health, and prolonged exposure can contribute to forest decline and increased tree mortality.
And then there are the so-called “zombie fires” in parts of Canada and Siberia. These fires can smolder underground in carbon-rich peat and permafrost through the winter, re-emerging when temperatures rise. They release carbon that has been locked away for centuries or even millennia, creating an additional climate feedback that many people are unaware of.
A meaningful discussion isn’t about whether someone can find a statistic showing fewer fires in one dataset or region. It’s about understanding what is actually happening in the Earth system: larger extreme fires, longer fire seasons, increased carbon emissions, long-range ozone pollution, and emerging feedbacks from thawing permafrost. Those are the trends scientists are paying attention to.
Tropospheric ozone is one of the most dangerous yet least understood environmental threats facing modern society. Invisible to the eye, it functions simultaneously as an air pollutant, a greenhouse gas, and a climate feedback amplifier. Ozone exposure is associated with millions of illnesses and premature deaths worldwide, while also damaging crops, forests, and other ecosystems that serve as critical carbon sinks. Emerging research suggests that ozone is an important component of several self-reinforcing climate feedback loops involving wildfires, forest decline, methane emissions, permafrost thaw, and so-called “zombie fires” that can smolder underground for months or even years, similar in some respects to the long-burning coal fires of Centralia, Pennsylvania. Because tropospheric ozone is produced through atmospheric reactions involving emissions from fossil fuel combustion, biomass burning, and methane oxidation, it serves as a critical link between atmospheric chemistry, ecosystem health, and climate change. Diesel combustion remains a major contributor to localized ozone formation through its emissions of nitrogen oxides (NOₓ), while natural gas systems, particularly those associated with electric power generation, contribute to a broader global ozone pathway through methane leakage, combustion-related methane slip, and the atmospheric chemical processes that convert methane into tropospheric ozone. Together, these processes position ozone not merely as a consequence of climate change, but as a significant multiplier of its impacts.
Introduction
Discussions about transportation fuels and electricity generation often focus almost exclusively on carbon dioxide (CO₂) emissions. While CO₂ remains the dominant long-lived greenhouse gas produced by human activities, evaluating fuels solely through a carbon dioxide lens overlooks important atmospheric processes that influence climate, air quality, ecosystem health, and public health.
Among these processes, tropospheric ozone (O₃) occupies a unique position. Ozone is both a harmful air pollutant and a significant short-lived climate forcer. It damages crops and forests, impairs human respiratory health, reduces carbon uptake by vegetation, and contributes directly to warming. Because ozone is formed through complex atmospheric chemistry rather than emitted directly, different fuels can produce dramatically different ozone-related impacts even when their carbon dioxide emissions appear similar.
The choice between diesel fuel and natural gas provides a useful example. Diesel and natural gas create distinct atmospheric signatures that influence local air pollution, global atmospheric chemistry, and climate feedbacks through different pathways. Understanding these differences reveals why the true environmental footprint of a fuel extends far beyond the carbon dioxide emitted at the point of combustion.
Ozone: A Secondary Climate Pollutant
Unlike carbon dioxide or methane, ozone is not emitted directly from vehicle tailpipes or power plant stacks. Instead, it is a secondary pollutant formed through photochemical reactions involving two primary ingredients:
Nitrogen Oxides (NOₓ)
Volatile Organic Compounds (VOCs)
When these compounds interact in the presence of sunlight, they produce ground-level ozone. The amount, location, and persistence of ozone formation depend heavily on the chemical composition of the emissions. As a result, fuel choice can significantly influence both local air quality and broader climate impacts.
Diesel: The NOₓ-Dominated Pathway
Diesel engines operate under extremely high pressures and combustion temperatures. These conditions promote the formation of large quantities of nitrogen oxides.
As a result, diesel exhaust typically contains:
High concentrations of NOₓ
Complex aromatic VOCs
Fine particulate matter
Black carbon (soot)
This combination creates highly reactive atmospheric chemistry that efficiently generates local ground-level ozone. In urban and industrial regions, diesel emissions can become a major driver of ozone pollution episodes and smog formation.
The climate impact extends beyond ozone. Diesel engines also emit black carbon, one of the most powerful short-lived climate pollutants. Black carbon absorbs solar radiation directly, warming the atmosphere while accelerating snow and ice melt when deposited on reflective surfaces. Consequently, diesel’s climate footprint includes not only carbon dioxide emissions but also localized ozone production and direct atmospheric heating from soot.
Natural Gas: The Methane Pathway
Natural gas combustion follows a very different atmospheric pathway. In transportation applications, natural gas vehicles generally emit substantially less nitrogen oxide pollution than comparable diesel engines, often reducing NOₓ emissions by 75% to 94%.
This reduction can significantly decrease local ozone formation and improve urban air quality. However, natural gas introduces a different atmospheric challenge.
The primary hydrocarbon associated with natural gas is methane (CH₄). Unlike the highly reactive VOCs commonly associated with diesel exhaust, methane reacts slowly in the atmosphere. Rather than generating immediate local smog, methane can persist for more than a decade, circulating globally before participating in atmospheric reactions that contribute to tropospheric ozone formation.
As a result, natural gas may reduce local ozone pollution while simultaneously contributing to increases in global background ozone concentrations through methane-driven atmospheric chemistry.
Direct Greenhouse Emissions
When only tailpipe or stack emissions are considered, natural gas appears to offer a significant climate advantage.
Diesel is a carbon-dense fuel that produces relatively large quantities of carbon dioxide during combustion. Natural gas, composed primarily of methane, contains a higher hydrogen-to-carbon ratio and therefore releases approximately 20% to 30% less CO₂ per unit of energy produced.
Under a narrow carbon accounting framework, this makes natural gas appear to be the cleaner option.
However, direct combustion emissions represent only part of the overall climate footprint.
The Supply Chain Problem
The greatest climate risk associated with natural gas often occurs before the fuel reaches an engine, turbine, or boiler.
Methane is an extraordinarily potent greenhouse gas, possessing a global warming potential roughly 28 to 36 times greater than carbon dioxide over a 100-year timeframe and substantially higher over shorter periods.
Because natural gas must be extracted, processed, compressed, transported, stored, and distributed through extensive infrastructure networks, leakage can occur at numerous points throughout the supply chain.
Even relatively small leakage rates can have significant climate consequences. Studies have shown that methane losses of only 1% to 2% can substantially reduce—or in some cases eliminate—the greenhouse advantage that natural gas enjoys through lower carbon dioxide emissions.
In effect, a fuel that appears cleaner at the point of combustion may produce a substantially larger overall climate footprint once upstream emissions are included.
The Global Ozone Pathway
An often-overlooked consequence of methane leakage is its contribution to the global background ozone burden.
Methane emissions are not confined to the regions where they are released. Once emitted, methane becomes part of the global atmospheric reservoir and circulates throughout the planet. During its atmospheric lifetime, methane undergoes chemical reactions that contribute to the formation of tropospheric ozone over vast geographic areas.
Unlike nitrogen oxides and highly reactive VOCs, which often generate ozone near their source within hours or days, methane influences atmospheric chemistry over years and across continents. The result is a diffuse but persistent increase in background ozone concentrations throughout much of the world’s atmosphere.
This distinction becomes clear when comparing methane-driven ozone formation with wildfire-related ozone transport. Ozone and ozone precursors generated by major Canadian wildfires can be transported into cities such as Philadelphia, creating measurable air-quality impacts for days or weeks. These events are visible, immediate, and regional.
Methane associated with natural gas used to generate electricity in Philadelphia follows a very different pathway. The methane does not travel directly to the Amazon rainforest as ozone. Instead, it becomes globally mixed in the atmosphere and later participates in chemical reactions that elevate ozone concentrations throughout the troposphere, including over remote ecosystems such as the Amazon Basin.
In this sense, wildfire smoke and methane represent two different forms of atmospheric connectivity. Wildfires transport ozone and ozone precursors directly across regions through smoke plumes and weather systems. Methane transport is slower, less visible, and more diffuse, yet potentially broader in scope. A methane leak in Pennsylvania may eventually contribute, in a small but measurable way, to ozone-related stress on forests in South America, crop productivity in Africa, or ecosystem health in Asia.
The wildfire impact is acute, visible, and episodic. The methane impact is diffuse, persistent, and global.
Ozone and the Climate Multiplier Effect
The distinction between diesel and natural gas is therefore not simply a comparison of carbon dioxide emissions.
Diesel tends to generate:
Higher local ozone concentrations
Greater NOₓ pollution
Significant black carbon emissions
Natural gas tends to generate:
Lower local ozone formation
Reduced NOₓ emissions
Greater dependence on methane management
Increased potential for global background ozone formation through methane oxidation
Both fuels contribute to climate warming, but through different mechanisms.
Diesel’s climate multiplier arises primarily from black carbon emissions and localized ozone production. Natural gas’s climate multiplier emerges through methane leakage, long-range atmospheric transport, and the gradual formation of background tropospheric ozone on a global scale.
Conclusion
The choice between diesel and natural gas is often framed as a simple comparison of carbon dioxide emissions. In reality, the decision involves fundamentally different atmospheric pathways that influence air quality, ecosystem health, and climate feedbacks.
Diesel generates substantial nitrogen oxide pollution, localized ozone formation, and black carbon emissions that contribute directly to warming and regional environmental damage. Natural gas reduces many of these local pollutants, but its dependence on methane creates a different set of risks. Methane leakage not only amplifies greenhouse warming directly but also contributes to a global increase in tropospheric ozone, extending the environmental consequences of natural gas use far beyond the point of combustion.
As climate science increasingly recognizes the importance of atmospheric feedbacks, carbon sink degradation, and short-lived climate pollutants, evaluating fuels solely on carbon dioxide emissions becomes increasingly inadequate. The full climate footprint must include methane leakage, ozone chemistry, black carbon emissions, and the broader atmospheric processes that connect local energy choices to global environmental outcomes. Understanding these interconnected pathways is essential for developing energy policies that address not only carbon emissions but the full spectrum of climate-forcing mechanisms operating throughout the Earth system.
Addendum 1: Methane Slip, Combustion Limits, and the Hidden Ozone Pathway
One of the most frequently overlooked aspects of natural gas combustion is that complete combustion is physically unattainable. While modern power plants are remarkably efficient, engineering and thermodynamic constraints ensure that a small fraction of methane always escapes oxidation and enters the atmosphere. This phenomenon, known as methane slip, creates climate consequences that extend well beyond the direct carbon dioxide emissions typically used to evaluate natural gas.
Why Methane Escapes Combustion
Several physical processes limit combustion efficiency even in the most advanced systems:
Boundary Layer Effects (Flame Quenching)
The interior walls of combustion chambers must be actively cooled to prevent structural damage. As methane-air mixtures approach these cooler surfaces, flame temperatures can fall below the threshold required to sustain combustion. This process, known as flame quenching, creates microscopic regions where methane remains unburned and escapes into the exhaust stream.
Incomplete Turbulent Mixing
Efficient combustion requires methane (CH₄) and oxygen (O₂) molecules to mix at extremely small scales. Although modern burners are designed to maximize turbulence, high-velocity flows inevitably create localized pockets where fuel and oxygen concentrations are uneven. Some methane molecules therefore pass through the combustion zone without fully reacting.
Transient Operating Conditions
Methane slip increases substantially during startup, shutdown, load-following operations, and other transient conditions. As electric grids incorporate greater amounts of variable renewable generation, gas-fired plants are increasingly required to ramp output up and down rapidly. These operating conditions often reduce combustion stability and temporarily increase methane emissions.
How Much Methane Escapes?
Methane slip varies considerably depending on technology and operating conditions.
Modern Combined-Cycle Gas Turbines
Large utility-scale combined-cycle plants can achieve combustion efficiencies approaching 99.98% under steady-state operation. Methane slip is typically around 0.02% of fuel input, although rates may increase during startup and load transitions.
Reciprocating Internal Combustion Engines
Smaller gas-fired engines commonly used in peaker plants, compressor stations, and industrial facilities generally exhibit significantly higher methane slip rates. Emissions often range from 1.5% to 3% of fuel input and can be substantially higher under certain operating conditions.
Upstream Leakage
Combustion-related methane slip represents only part of the problem. Additional methane leakage occurs during extraction, processing, storage, transmission, and distribution. When these losses are included, total methane emissions from natural gas systems can become a significant contributor to climate forcing.
Climate and Ozone Implications
Methane is a highly potent greenhouse gas with a warming effect more than 80 times greater than carbon dioxide over a 20-year time horizon. Because methane exerts much of its influence during the critical decades immediately ahead, even relatively small leakage rates can substantially erode the climate advantages often attributed to natural gas.
However, methane’s climate impact extends beyond its direct greenhouse effect.
Once released into the atmosphere, methane becomes globally distributed and persists for approximately a decade before being oxidized through reactions involving hydroxyl radicals (OH). These reactions produce a chain of atmospheric chemical processes that contribute to the formation of tropospheric ozone (O₃).
Unlike ozone generated directly downwind of urban pollution or wildfire smoke, methane-driven ozone formation occurs on a planetary scale. Methane emissions released in one location can influence background ozone concentrations thousands of miles away. Consequently, methane leakage from a natural gas power plant in Pennsylvania can ultimately contribute to ozone formation over the Amazon rainforest, African tropical forests, agricultural regions, or remote ecosystems far removed from the original source.
This distinction is critical because tropospheric ozone is not merely an air pollutant. It is also a greenhouse gas, a phytotoxin, and an increasingly important driver of ecosystem decline.
As ecosystems lose productivity, their ability to absorb atmospheric carbon dioxide declines. The resulting carbon sink failure allows additional greenhouse gases to accumulate in the atmosphere, amplifying warming and creating a reinforcing feedback loop.
In this way, methane slip represents far more than a simple fuel loss. It functions as a delayed, globally distributed climate multiplier that contributes simultaneously to greenhouse warming, tropospheric ozone formation, ecosystem degradation, and the weakening of natural carbon sinks. These interconnected effects illustrate why evaluating fuels solely on direct carbon dioxide emissions can underestimate their true climate impact.
Addendum 2: Wildfires, Ozone, Carbon Sink Failure, and the Climate Feedback Loop
One of the clearest examples of the Ozone Feedback Theory can be observed in the rapidly intensifying wildfire systems of North America and the Arctic.
Major Canadian wildfires routinely generate enormous quantities of smoke containing nitrogen oxides (NOₓ), volatile organic compounds (VOCs), carbon monoxide (CO), methane, and particulate matter. Under sunlight, these emissions participate in complex atmospheric reactions that produce large quantities of ground-level ozone.
Importantly, the impacts of wildfire smoke extend far beyond the visible plume. Atmospheric transport can carry ozone and ozone precursors hundreds or even thousands of miles from their source. Smoke generated in western Canada has repeatedly degraded air quality across the United States, exposing millions of people to elevated ozone concentrations long after the visible smoke has dispersed.
The consequences extend beyond human health.
Tropospheric ozone damages vegetation by impairing photosynthesis, disrupting stomatal regulation, accelerating oxidative stress, and reducing plant productivity. Forests exposed to elevated ozone often exhibit slower growth, increased susceptibility to drought and disease, and higher mortality rates.
As ozone concentrations rise, forests absorb less carbon dioxide from the atmosphere. This reduction in carbon sequestration weakens one of Earth’s most important natural climate-regulating systems.
The feedback loop then begins to accelerate:
Warming temperatures increase wildfire frequency, duration, and intensity.
Wildfires release carbon dioxide, methane, NOₓ, VOCs, and particulate matter.
These emissions generate additional tropospheric ozone.
Ozone damages forests, crops, and other ecosystems.
Additional warming increases the likelihood of future extreme fires.
The cycle repeats and intensifies.
The Role of Zombie Fires and Permafrost Carbon
An additional and particularly concerning feedback involves so-called “zombie fires” found in portions of Canada, Alaska, and Siberia.
Unlike conventional surface fires, zombie fires can smolder underground within carbon-rich peat soils and thawing permafrost throughout the winter months. Hidden beneath snow cover, these fires may persist for months before re-emerging the following spring.
These systems are especially important because they release carbon that has been stored for centuries, millennia, or even longer.
Permafrost regions contain vast reservoirs of ancient organic carbon accumulated over thousands of years. When thawing and burning occur simultaneously, carbon dioxide and methane that were previously isolated from the atmosphere become available for rapid release.
The resulting emissions contribute to several reinforcing feedbacks:
• Direct greenhouse warming from carbon dioxide and methane. • Additional methane-driven tropospheric ozone formation. • Increased wildfire activity through warmer and drier conditions. • Further ecosystem degradation and carbon sink loss.
A Cascading Climate Multiplier
Viewed collectively, wildfire smoke, ozone formation, forest decline, carbon sink failure, methane emissions, and permafrost degradation are not isolated phenomena. They represent interconnected components of a larger feedback system.
Tropospheric ozone serves as a particularly important coupling mechanism within this system because it links atmospheric chemistry, ecosystem health, carbon cycling, and climate change. By simultaneously acting as a greenhouse gas and a biological stressor, ozone helps transform warming-driven disturbances into broader ecological and climatic consequences.
This cascading interaction illustrates how climate change can become self-reinforcing. The concern is not merely that warming causes more fires. Rather, fires generate atmospheric pollutants and greenhouse gases that weaken natural carbon sinks, accelerate ozone formation, and create conditions that favor even greater warming in the future.
In this framework, wildfire-driven ozone production becomes both a symptom of climate change and a mechanism that contributes to its acceleration.