bookmark_borderAsh Devils and Black Rain: Two Extreme Fire–Carbon Phenomena Emerging From Intensifying Disasters

In early May 2026, two striking and very different atmospheric events emerged from fire- and carbon-intensive systems: ash devils in Southern California wildfires and reports of “black rain” in the Black Sea region following industrial strikes. While geographically and causally distinct, both reflect a broader pattern in which human-driven combustion, infrastructure stress, and atmospheric feedbacks are increasingly interacting in extreme ways.


Ash Devils: Fire-Driven Atmospheric Vortices

During active wildfire operations in Southern California, firefighters observed ash devils near the Trinity Fire in the Phelan area.

These are fire-generated vortices formed when:

  • Extreme wildfire heat rapidly warms surface air
  • Hot air rises and induces localized rotation
  • The vortex lifts ash, embers, and debris into the atmosphere

They are a visible expression of how intense combustion events can reorganize local atmospheric dynamics, spreading particulate matter unpredictably.


Black Rain: Industrial Combustion Meets Weather Systems

At the same time, reports from the Black Sea region described “black rain” following drone strikes on oil infrastructure near Tuapse.

The sequence involved:

  • Explosions and fires at petroleum facilities
  • Large-scale release of soot, hydrocarbons, and aerosols
  • Interaction of these emissions with rainfall systems

The result was precipitation contaminated with dark particulates and oily residues, with reported impacts on coastal ecosystems, wildlife, and human health.


A Shared System: Fire, Carbon, and Feedback Acceleration

Although one event is wildfire-driven and the other conflict-driven industrial combustion, both reflect the same underlying system pressure:

Human exploitation of carbon-based energy systems is increasingly feeding back into the climate and atmospheric system itself.

Key interacting processes include:

  • Combustion emissions (wildfire, fossil fuels, industrial fires)
  • Aerosol loading of the atmosphere (soot, ash, particulate matter)
  • Extreme heat and drying conditions that amplify fire behavior
  • Infrastructure vulnerability under stress and conflict conditions

These processes are not isolated—they reinforce each other through feedback loops:

  • More heat → more fire intensity
  • More fire → more aerosols and radiative effects
  • More aerosols and greenhouse gases → further warming and instability

Broader Implication: A Coupled Human–Climate System

What links these events is not just coincidence, but a growing coupling between human systems and climate systems:

  • Energy extraction and combustion
  • Industrial and military infrastructure damage
  • Land-use stress and wildfire expansion
  • Atmospheric redistribution of pollutants

Together, these contribute to a system in which human activity is no longer external to climate change, but embedded within its accelerating feedback structure.

While individual events are local, the underlying trend is increasingly systemic: amplified extremes emerging from interacting climate, energy, and conflict dynamics.


Conclusion

Ash devils and black rain are different manifestations of the same broader reality:
a world where combustion, resource extraction, and environmental stress are increasingly reinforcing atmospheric instability rather than operating independently of it.

The result is not a single cause-and-effect pathway, but a network of accelerating feedbacks linking human activity and climate behavior.

bookmark_borderThe Accidental Climate Accelerator: How Global Conflict and China’s Solar Surge Are Reshaping Energy Faster Than Policy

The good news is that, regardless of intent or framing, Trump’s recent policy choices have significantly accelerated investment and deployment in green energy—arguably contributing, in an unintended way, to one of the fastest transitions in energy technology in modern history.

Despite the short-term negative impacts of current geopolitical tensions and energy policy disruptions on climate stability and markets, there is also a striking and underappreciated countertrend: the global clean energy transition is accelerating faster than most projections anticipated.

In particular, China’s rapid expansion of renewable energy—especially solar—has become one of the most powerful forces shaping the global climate trajectory in 2024–2026, often outpacing even the most optimistic forecasts.


China’s Solar Expansion: Scaling at Unprecedented Speed

Record-Breaking Exports

In March 2026, China’s solar exports reached a new record of 68 gigawatts (GW) in a single month—more than double the previous month and nearly 50% higher than the prior record set in August 2025.

This reflects not just demand growth, but an industrial system operating at extraordinary scale.


Massive Domestic Installations

China’s internal deployment has been even more dramatic:

  • 256 GW of solar installed in the first half of 2025 alone
  • More than the rest of the world combined during the same period
  • More than double all non-Chinese global installations combined

This level of buildout represents a structural shift in global energy investment.


A 1 Terawatt Milestone

By mid-2025, China became the first country in history to surpass:

  • 1,000 GW (1 terawatt) of installed solar capacity

This marks a scale of deployment previously considered decades away under most global energy scenarios.


Manufacturing Dominance

China now controls:

  • Over 80% of global solar supply chains
  • A dominant share of polysilicon, wafers, cells, and finished panels

This vertical integration allows for rapid scaling and continued cost reductions across the entire sector.


Energy System Transformation: Coal vs. Renewables

One of the most significant developments is not just expansion—but displacement.

In the first half of 2025:

  • Solar and wind growth fully met all new electricity demand
  • Coal use declined by approximately 3.4%
  • Power-sector CO₂ emissions fell by roughly 3%

This is a critical inflection point: renewable growth is no longer merely additive—it is beginning to replace fossil generation in net terms.


Why This Matters Globally

1. Collapsing Solar Costs

Between 2015 and 2024, the cost of solar panels fell by roughly 90%, largely driven by Chinese manufacturing scale and supply chain optimization.

As a result, solar has become the lowest-cost source of new electricity generation worldwide.


2. Cushioning Fossil Fuel Shocks

Rapid renewable expansion in 2025 helped offset disruptions in fossil fuel markets by:

  • Reducing global gas demand growth
  • Stabilizing electricity prices in several regions
  • Limiting the inflationary impact of energy shocks

In effect, renewables are increasingly acting as a shock absorber for global energy volatility.


3. Acceleration in Emerging Markets

Perhaps most consequentially, low-cost Chinese exports of solar technology have enabled developing economies to:

  • Deploy renewable energy faster than historical developed-world timelines
  • Reduce reliance on imported fossil fuels
  • In some cases, bypass traditional centralized fossil infrastructure entirely

This “leapfrogging” effect is reshaping global energy development patterns.


The Fossil Fuel Paradox

Even as renewable capacity expands rapidly, China continues to build new coal generation for grid stability and peak demand support. This reflects a dual-track strategy:

  • Rapid renewable scaling for long-term transition
  • Coal expansion for short-term reliability

At the same time, total investment in clean energy infrastructure in 2025 exceeded $1 trillion globally, underscoring the magnitude of the transition underway.


Geopolitics and the Acceleration Effect

An often-overlooked driver of this transition is geopolitical instability itself.

Current global conflicts and energy market disruptions are unintentionally:

  • Increasing energy security concerns
  • Encouraging diversification away from oil and gas
  • Accelerating investment in domestic renewable capacity

In this sense, fossil fuel volatility is acting as a structural catalyst for electrification and decarbonization.


Final Thought: A Transition Beyond Policy

While policy debates remain highly polarized, the underlying energy transition is increasingly being driven by economics, industrial scale, and supply chain dynamics rather than ideology alone.

China’s solar expansion demonstrates that when manufacturing capacity, cost declines, and deployment speed align, energy systems can transform far faster than traditional models predict.

And paradoxically, even global instability is now contributing to that acceleration.

The result is a world in which the energy transition is no longer primarily planned—it is increasingly emergent, decentralized, and self-reinforcing.

bookmark_borderRecord Exports, Rising Costs: The Hidden Tradeoffs of America’s Oil Boom

The United States reached a record-breaking 12.9 million barrels per day (bpd) in total crude oil and petroleum product exports for the week ending April 17, 2026. On paper, this milestone reinforces the narrative of American “energy dominance.” In practice, it reveals a far more complex—and costly—reality.


The Refinery Mismatch: Why the U.S. Imports Oil While Exporting It

Despite being a net exporter of total petroleum (crude + refined products), the U.S. still imports more crude oil than it exports.

This apparent contradiction is driven by what industry experts call a refinery mismatch:

  • U.S. shale production yields light, sweet crude, which is highly valuable on global markets
  • Many U.S. refineries were built decades ago to process heavier, sour crude
  • As a result, it is often more profitable to export domestic light crude and import cheaper heavy crude for refining

As of early 2026, the primary sources of U.S. crude imports include:

  • Canada (over 60% of imports)
  • Mexico
  • Saudi Arabia
  • Guyana and Colombia

This system maximizes industry profit—but it also ties domestic energy prices more tightly to global markets.


Climate Implications: A High-Emission Backbone

While production and exports surge, the refining process remains one of the most energy-intensive and polluting sectors in the U.S. economy.

Greenhouse Gas Emissions

Refineries are among the largest industrial emitters of carbon dioxide and methane. Globally, they rank as a major contributor to greenhouse gas emissions, reinforcing long-term warming trends.

Decarbonization Challenges

As sectors like electricity generation shift toward cleaner energy, refining is expected to represent a growing share of total emissions unless significant mitigation technologies are deployed.

Energy Intensity

Refining requires extreme heat and pressure, often generated by burning byproducts like refinery fuel gas—creating a self-reinforcing cycle of emissions.

When you account for emissions from both the refining process and the combustion of petroleum products, the United States is the largest contributor to environmental damage and climate change.


Local Pollution and Public Health

The environmental burden is not evenly distributed. Communities located near refineries—often referred to as “fenceline communities”—face elevated health risks.

Toxic Air Pollutants

Refineries emit hazardous chemicals such as:

  • Benzene (a known carcinogen)
  • Toluene
  • Xylene

Recent 2026 data indicates that benzene levels in some Gulf Coast regions remain above recommended safety thresholds.

Respiratory and Cardiovascular Impacts

Emissions of sulfur dioxide and nitrogen oxides contribute to:

  • Smog formation
  • Acid rain
  • Increased rates of asthma, bronchitis, and heart disease

Particulate Matter

Fine particles released during refining can enter the bloodstream, contributing to:

  • Premature mortality
  • Cancer risk
  • Chronic respiratory conditions

The Consumer Impact: Higher Prices at Home

Ironically, record exports can translate into higher costs for U.S. consumers.

Global Price Linkage

By exporting large volumes of oil and refined products, U.S. fuel prices become more tightly linked to volatile global markets, including geopolitical disruptions.

Rising Fuel Costs

In early 2026, American consumers paid an estimated $8.4 billion more for fuel, driven by supply disruptions and strong export demand.

Diesel Squeeze

Global demand for diesel has surged, pushing U.S. retail prices to nearly $5.80 per gallon as of April 2026—adding pressure to transportation, agriculture, and manufacturing costs.


The Bigger Picture: Strength or Exposure?

The U.S. oil boom highlights a fundamental tension:

  • Economic strength: Record exports, global market influence, and strong industry profits
  • Systemic exposure: Higher domestic prices, environmental costs, and dependence on global dynamics

What appears to be energy independence is, in reality, a deeply interconnected system—one where domestic outcomes are increasingly shaped by international forces.

The health impacts from the US production, distribution, and combustion of petroleum products are the most significant anthropogenic contributors to premature mortality and reduced quality of life worldwide.


Final Thought

Record export numbers tell only part of the story. Beneath the surface lies a system defined by structural inefficiencies, environmental tradeoffs, and rising costs for consumers.

In that sense, America’s energy dominance may be less about insulation—and more about integration into a volatile global market.

bookmark_borderHeat Health Risks

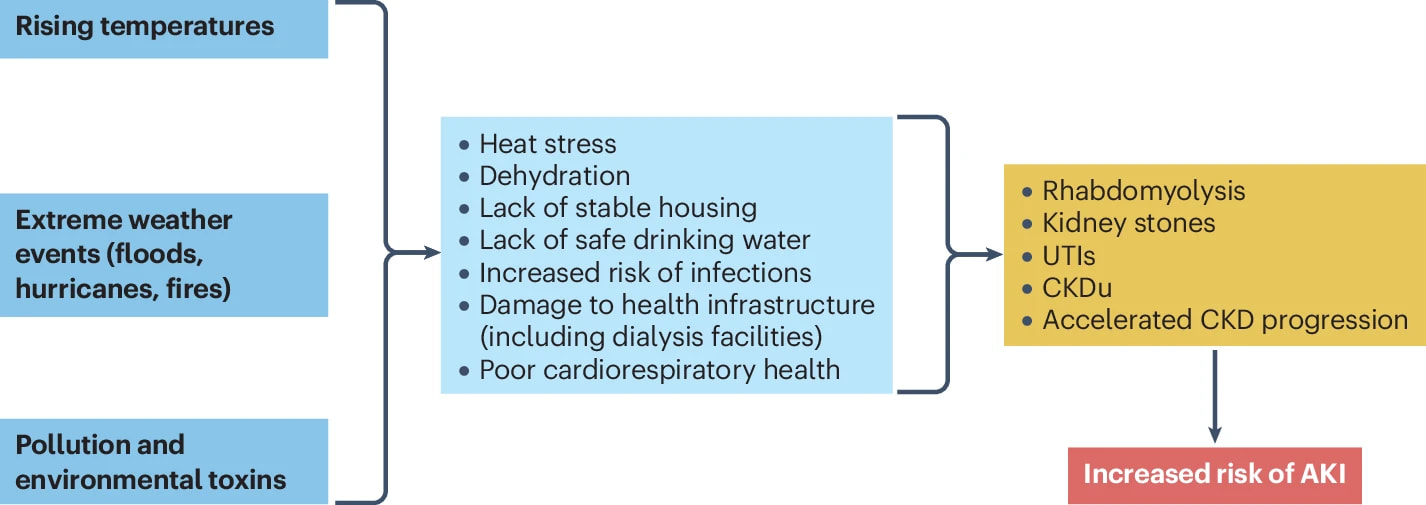
Heat stress is not just uncomfortable—it’s dangerous.

Rising exposure:
Over the past four years, the average person has experienced 19 days per year of life-threatening heat, driven almost entirely by human-caused warming.

Severe health impacts:
Extreme heat can trigger heatstroke, dehydration, and kidney injury, while also worsening existing heart and lung conditions.

Accelerated aging:
Prolonged exposure to extreme heat speeds up biological aging—damaging tissues and shortening telomeres at the cellular level.

Chronic disease risk:
These changes increase the likelihood of diseases such as cancer, dementia, and diabetes—conditions that are further exacerbated by pollution and infection.

Mental health effects:
Heat stress is also linked to higher rates of depression, anxiety, and even suicide.


Epigenetic Changes: The Molecular Convergence of Climate Stressors

A key connection between these risks lies in epigenetic changes—chemical modifications that influence how genes are expressed without altering the DNA itself. Think of them as switches that turn genes on or off.

Extreme heat has been shown to trigger these changes.

  • Heat—especially humid heat—can trigger epigenetic changes that activate high-risk genes linked to cancer, diabetes, cardiovascular disease, and neurological disorders.
  • Each time you are exposed to extreme heat , the effects don’t just add up—they compound, increasing long-term vulnerability across multiple organ systems..

This molecular disruption represents a shared pathway linking climate-related health threats. It amplifies feedback loops that drive chronic illness and premature death, and raises concerns about transgenerational effects, where these changes may increase disease risk in future generations.


A recent study in Nature examines the impact of heat stress on kidney health:
https://www.nature.com/articles/s41581-026-01063-3

bookmark_borderWeakening AMOC

Many of the extreme weather events now being experienced in the U.S. are linked to a weakening AMOC and an increasingly unstable, “wavier” jet stream. Both are driven by shifting temperature, pressure, and moisture gradients, and they are physically connected through shared feedback processes. As these feedbacks interact, they can amplify one another, accelerating the broader system toward destabilization.

A recent study highlights that the rate—and particularly the acceleration—of these changes may have been underestimated.

Led by Dr. Valentin Portmann at the Inria Centre de recherche Bordeaux Sud-Ouest, the research utilized a statistical method called ridge regression to assess climate models against real-world salinity observations in the South Atlantic.

  • Underestimated Decline: The study found that previous “average” climate models likely underestimated how quickly the AMOC is weakening.
  • Realistic Pessimism: Models previously considered “pessimistic” actually align better with observational data, making their severe outcomes more likely to be realistic.
  • Tipping Point Proximity: Experts now suggest there is a greater than 50% chance of an AMOC shutdown tipping point being reached, possibly as early as the middle of this century (circa 2050).

Dr Valentin Portmann, at the Inria Centre de recherche Bordeaux Sud-Ouest in France and who led the new research, said: “We found that the AMOC is going to decline more than expected compared to the average of all climate models. This means we have an AMOC that is closer to a tipping point.”

Prof Stefan Rahmstorf, at the Potsdam Institute for Climate Impact Research in Germany, said: “This is an important and very concerning result. It shows that the ‘pessimistic’ models, which show a strong weakening of the AMOC by 2100, are, unfortunately, the realistic ones, in that they agree better with observational data. I now am increasingly worried that we may well pass that AMOC shutdown tipping point, where it becomes inevitable, in the middle of this century, which is quite close.”

https://www.science.org/doi/10.1126/sciadv.adx4298

bookmark_borderThe Greatest Economic Lies of All Time: War, Tariffs, and the Hidden Tax on Consumers

Perhaps the two greatest economic misconceptions of the 21st century are:

  • Foreign countries pay tariffs
  • The United States does not depend on the Strait of Hormuz

Both claims are not just misleading—they fundamentally distort how the global economy actually functions.


The Tariff Illusion: Who Really Pays?

The tariff argument is the easier of the two to understand.

Tariffs are taxes on imports. In practice, the importer—the domestic company bringing goods into the country—pays the tax. Those costs are then passed on through supply chains to businesses and ultimately to consumers.

This is not theoretical—it has been tested. In court rulings requiring tariff refunds, the recipients were overwhelmingly U.S. companies. Small and mid-sized businesses, which lack the pricing power and flexibility of large corporations, bore a disproportionate share of the burden.

In short, tariffs function as a domestic tax disguised as foreign punishment.


The Strait of Hormuz Myth: Indirect Dependence, Direct Consequences

The second claim—that the U.S. does not rely on the Strait of Hormuz—is more complex, and far more consequential.

It is technically true that the United States imports relatively little crude oil directly from the Persian Gulf compared to past decades. However, this misses the larger reality: oil is priced globally.

When the Strait of Hormuz—through which roughly 20 million barrels per day flow—is disrupted, the impact is immediate and universal. Prices rise not just for crude, but for refined fuels, petrochemicals, and nearly every energy-intensive product.

As a climate scientist, one might view this as an unintended but powerful carbon tax—accelerating the transition away from fossil fuels. As an economist concerned with inequality, poverty, and food security, the implications are deeply troubling.


War and the Permanent Price Shift

Early claims that the Strait would quickly reopen have proven overly optimistic. Even temporary disruptions create long-term structural changes:

  • Increased insurance costs
  • Security-related tolls and delays
  • Rerouting of global shipping lanes
  • Persistent risk premiums embedded in pricing

Even if hostilities decline, the system does not simply revert. Markets price risk forward, not backward.


Fossil Fuels: The Reality of “Energy Dominance”

Despite claims of “energy dominance,” the U.S. remains deeply exposed to global energy shocks.

Recent market behavior underscores this:

  • U.S. West Texas crude trading above Brent signals tightening domestic supply
  • Spot prices running $20–$30 above futures indicate immediate scarcity
  • Physical Brent cargoes reaching record highs reflect extreme demand for near-term delivery

This is classic backwardation—markets signaling shortage, not abundance.

As a result, gasoline prices moving toward $5 per gallon are not speculative—they are consistent with current market structure.


The Great Rerouting: Why U.S. Consumers Pay More

In response to disruptions, global buyers have begun shifting supply chains:

  • Tankers are increasingly sourcing oil from the U.S. Gulf Coast instead of the Middle East
  • American crude is being exported to replace disrupted supply elsewhere
  • Domestic supply tightens as global demand competes for U.S. barrels

Ironically, this means U.S. consumers may pay more than consumers in other regions.

Energy dominance, in this context, becomes exposure rather than insulation.


The Hidden War Tax on Oil

Even in a de-escalation scenario, new cost structures remain:

  • Tolls, insurance, and financing add an estimated $3.50–$5 per barrel to Middle Eastern oil
  • By comparison, shipping from Texas to Europe adds only $1–$3 per barrel

This creates a structural shift in global sourcing—but not necessarily lower prices for U.S. consumers. Instead, it embeds a long-term premium into the system.


Beyond Oil: System-Wide Inflation

The disruption extends far beyond crude oil.

Petrochemicals and Plastics

  • Plastic prices have surged as much as 60% in some markets
  • Plastic feedstock shortages are tightening global resin supply
  • Consumer goods—from packaging to household items—are rising in price. Less obvious are items like clothing, which are heavily dependent on plastics and synthetic fibers, making them particularly sensitive to these cost increases.

Fertilizer and Food Security

  • Roughly half of global fertilizer supply moves through the Strait
  • Disruptions threaten agricultural output worldwide
  • Some estimates suggest food security could collapse from supporting 8 billion people to as few as 2 billion under sustained disruption

This is not just inflation—it is systemic risk.


Metals and Industrial Inputs

Aluminum:

  • Prices at four-year highs
  • Production disruptions in key Gulf facilities
  • Supply chain impacts across automotive, construction, and packaging sectors

Downstream Effects:

  • Higher costs for consumer goods, infrastructure, and manufacturing inputs
  • Increased volatility in global supply chains

Helium: A Critical but Overlooked Shock

Strikes affecting LNG infrastructure in Qatar have disrupted nearly one-third of global helium supply.

Impacts include:

  • Semiconductor manufacturing
  • MRI medical systems
  • Aerospace and defense
  • Industrial applications

Some analysts warn shortages could persist for years due to infrastructure damage and logistical constraints.


Interest Rates: The Amplifier of Economic Pain

Rising interest rates are compounding the effects of war, tariffs, and supply shocks, acting as a powerful amplifier across the entire economy. As central banks attempt to contain inflation, higher rates are tightening financial conditions for households, businesses, and governments alike.

Impact on Consumer Spending

Higher interest rates directly reduce consumer purchasing power:

  • Credit card rates rise, increasing the cost of carrying balances
  • Auto loans become more expensive, suppressing vehicle demand
  • Personal loans and financing costs increase across the board

As debt servicing consumes a larger share of income, discretionary spending declines. This is particularly significant in an economy where consumption drives roughly 70% of GDP. Even modest increases in borrowing costs can lead to outsized reductions in spending, especially among middle- and lower-income households.

There is also a psychological component. Higher rates signal economic tightening, leading consumers to delay major purchases and increase savings as a precaution. This behavioral shift can accelerate economic slowdowns.

Impact on Housing and Real Estate

The real estate market is especially sensitive to interest rates:

  • Mortgage rates have risen sharply, significantly increasing monthly payments
  • Affordability has deteriorated even where home prices have stabilized
  • First-time buyers are increasingly priced out of the market

For example, a one percentage point increase in mortgage rates can raise monthly payments by hundreds of dollars, effectively reducing purchasing power by tens of thousands of dollars.

This has several cascading effects:

  • Home sales slow as buyers step back
  • Construction activity declines, impacting jobs and materials demand
  • Homeowners with low-rate mortgages are reluctant to sell, reducing supply and creating market rigidity

Commercial real estate faces even greater stress. Higher borrowing costs, combined with shifting demand patterns, are placing pressure on property valuations and increasing refinancing risks.

The Feedback Loop

Rising interest rates create a feedback loop within the broader economic environment:

  • Higher rates reduce demand
  • Reduced demand slows economic growth
  • Slower growth increases financial stress
  • Financial stress can further tighten credit conditions

At the same time, elevated rates increase the cost of servicing government debt, adding pressure to already high deficits and limiting fiscal flexibility.

The Combined Effect

When combined with war-driven energy inflation and tariff-induced price increases, higher interest rates leave policymakers with limited options. Attempts to control inflation risk deepening economic slowdown, while efforts to stimulate growth risk reigniting inflation.

The result is a structurally fragile environment in which consumers face higher prices, higher borrowing costs, and fewer opportunities for economic mobility.


Tariffs in a Time of War

Layered on top of these supply shocks are new tariffs:

  • 10% global import surcharge
  • 50% tariffs on key metals
  • Expanded sector-specific tariffs, including pharmaceuticals

These policies amplify inflationary pressure by increasing input costs across industries already strained by supply disruptions.


Conclusion: The Convergence of Two Lies

These two misconceptions—about tariffs and the Strait of Hormuz—converge into a single reality:

  • War acts as a global tax
  • Tariffs act as a domestic tax
  • Consumers ultimately pay both

The result is a compounding inflationary cycle driven not by a single factor, but by the interaction of policy, conflict, and global supply chains.


A Final Paradox

There is one undeniable outcome:

This crisis will likely accelerate the transition away from fossil fuels at a pace that would have been politically impossible under normal conditions.

But that transition is being forced not by planning—but by disruption.

And the cost of that disruption will be borne unevenly, with the greatest burden falling on those least able to afford it.

Iran has indicated that it has lost track of some floating mines in the Strait, underscoring the ongoing danger and uncertainty in the region. With mines already deployed and difficulties in locating and clearing them, reopening the waterway safely is a complex and time-consuming process.

Any assumption that conditions will return to normal in the near term—if ever—appears increasingly unrealistic.

bookmark_borderClimate Change Change

Third Derivatives, Time Compression, and the Collapse of the 30-Year Climate Baseline

by Daniel Brouse and Sidd Mukherjee / April 1, 2026

Abstract

The question is no longer simply how fast the climate is changing. The more important question is: how fast is climate change itself changing?

The acceleration of warming impacts now appears to be increasing at a pace that may approach an effective doubling on the order of every decade across multiple coupled variables, including extreme precipitation, heat, wildfire behavior, atmospheric moisture loading, economic losses, infrastructure failures, and ecosystem disruption. This implies that the climate system is no longer adequately described by first-order change alone, or even by second-order acceleration. Instead, the climate system increasingly appears to be entering a third-derivative regime in which the acceleration itself is accelerating.

This transition has profound implications for forecasting, adaptation, economics, infrastructure, insurance, and the definition of climate itself. Traditionally, climate has been distinguished from weather by the use of 30-year averages. However, when climate states shift substantially within a single decade, a 30-year baseline becomes increasingly incapable of describing the system in real time. By the time a climate normal is established, the underlying climate may already have changed.

This paper argues that the Earth system is now entering a period of climate time compression, in which the historical distinction between weather and climate becomes increasingly blurred. In this regime, traditional linear assumptions fail, nonlinear amplification dominates, and the system begins to exhibit singularity-like behavior characterized by instability, amplification, and declining predictability.


1. Introduction

For most of modern science, climate change was assumed to be gradual. Changes in temperature, precipitation, sea level, and ecosystem structure were expected to occur over centuries, millennia, or longer. Paleoclimate records from events such as the Younger Dryas and Older Dryas suggested that even abrupt climate shifts unfolded over periods that were slow relative to a human lifetime.

That assumption is no longer valid.

Today, warming impacts are intensifying so rapidly that the acceleration itself is becoming measurable. Heat waves are becoming hotter, more frequent, and longer lasting. Rainfall extremes are becoming more intense. Wildfire behavior is becoming more explosive. Drought-to-flood transitions are becoming more abrupt. Economic losses are increasing at rates that exceed both inflation and population growth.

The critical issue is that these changes are no longer merely increasing. They are accelerating. More importantly, the acceleration itself appears to be increasing.

In mathematical terms:

  • First derivative: the rate of change
  • Second derivative: the acceleration of change
  • Third derivative: the acceleration of the acceleration

Historically, climate analysis has focused primarily on first derivatives and, more recently, second derivatives. However, recent evidence suggests that multiple climate variables are now behaving in ways more consistent with third-derivative dynamics.


2. From Linear Change to Third-Derivative Behavior

In a stable system, changes occur gradually enough that historical averages remain useful. This assumption underlies nearly every climate baseline currently in use.

For example:

Climate normals are often based on 30-year averages.

Insurance pricing relies on long-term historical event frequencies.

Infrastructure design assumes that the future will broadly resemble the past.

Agriculture depends on relatively stable planting zones and seasonal cycles.

These assumptions become unreliable when change itself accelerates rapidly.

A useful analogy is compound interest. If a system grows linearly, each year adds roughly the same amount of change. If a system grows exponentially, each year adds more than the year before. However, if the growth rate itself accelerates, the curve steepens even faster.

That is the difference between second-derivative and third-derivative behavior.

A second-derivative system may accelerate steadily.

A third-derivative system accelerates at an increasing rate.

This is the difference between a car gradually speeding up and a car whose acceleration pedal is itself being pressed harder every second.


3. The Failure of the 30-Year Climate Definition

The distinction between weather and climate has traditionally been based on time.

Weather describes short-term atmospheric conditions.

Climate describes long-term averages, typically over 30 years.

This distinction made sense when climate changed slowly.

However, if the climate shifts substantially within a decade, a 30-year average becomes less representative of present conditions. By definition, it becomes a backward-looking metric describing a world that no longer exists.

For example, if rainfall intensity, wildfire risk, heat wave duration, and atmospheric moisture content all change significantly within 10 years, then using a 30-year baseline may smooth away the very acceleration that matters most.

This creates a paradox:

The faster climate changes, the less useful traditional climate definitions become.

In effect, the climate baseline begins to lag behind reality.

The result is a form of observational delay in which institutions, governments, insurers, engineers, and economists continue to plan around conditions that are already obsolete.


4. Time Compression and the Experience of Acceleration

One of the most important consequences of third-derivative behavior is time compression.

As the pace of change accelerates, events that once occurred over centuries may begin occurring within decades, years, or even seasons.

A useful analogy is a vortex.

Imagine floating on a small boat circling near the outer edge of a whirlpool. At first, the movement feels slow and manageable. However, as the boat approaches the center, it begins to move faster and faster.

The closer it gets to the center, the more rapidly its speed increases.

Mathematically:

v ∝ 1/r

Where:

  • v is velocity
  • r is the distance from the center

As r becomes smaller, velocity rises dramatically.

The same effect occurs in a tornado vortex. Winds near the outer edge may be severe but survivable. Near the core, the increase in rotational velocity becomes extreme. At touchdown, the force concentration can become catastrophic.

Climate change now appears to be behaving similarly.

The closer the Earth system moves toward instability thresholds, the faster the impacts appear to unfold.

What once felt distant begins arriving all at once.


5. Why Traditional Forecasting Matters Less

This does not mean that climate models are unimportant.

To the contrary, climate models remain essential for understanding broad trends, emissions scenarios, feedback loops, and risk trajectories.

However, in a rapidly accelerating system, the need for precise long-term forecasting may diminish because the change becomes increasingly observable in real time.

People do not need advanced statistical training to recognize:

  • Record-breaking heat
  • More intense rainfall
  • Larger wildfires
  • Rising insurance costs
  • Crop failures
  • Infrastructure collapse
  • Expanding flood zones
  • Chronic drought

The climate signal is no longer subtle.

It is increasingly visible through everyday experience.

This is one reason the public often perceives climate change more rapidly than institutions are willing to acknowledge it.

People can see the acceleration directly.


6. Implications for Science, Economics, and Policy

If the climate system is indeed entering a third-derivative regime, the implications are profound.

Scientific implications include:

  • Shorter baseline periods for defining climate normals
  • Greater emphasis on nonlinear thresholds and tipping points
  • Increased focus on compound and cascading events
  • Recognition that historical data may underestimate future risk

Economic implications include:

  • Faster increases in insurance losses
  • More rapid devaluation of vulnerable property
  • Larger infrastructure adaptation costs
  • Greater supply-chain instability
  • Rising food and water insecurity

Policy implications include:

  • Faster decarbonization timelines
  • More aggressive adaptation strategies
  • Expanded emergency planning
  • New definitions of risk and resilience

Most importantly, policymakers may need to stop assuming that the future will resemble the past.

The past is no longer a reliable guide when the rate of change itself is changing.


7. Conclusion

Climate change is no longer simply occurring.

Climate change itself is changing.

The system appears to be moving beyond linear warming and even beyond steady acceleration into a regime where the acceleration itself is increasing.

This third-derivative behavior creates time compression, instability, and declining predictability.

It also undermines the usefulness of traditional 30-year climate definitions.

By the time we finish measuring the old climate, the new climate may already be here.

The defining challenge of the coming decades may not simply be adapting to climate change.

It may be adapting to the speed at which climate change itself is accelerating.
bookmark_borderThe Compression of Time: Third Derivatives, Vortex Dynamics, and Wormholes in Climate–Economic Singularity

Daniel Brouse¹ and Sidd Mukherjee²
March 2026

¹Independent Climate Researcher, Economist
²Physicist


Abstract

As the coupled climate–economic system exhibits increasingly nonlinear behavior, traditional interpretations of change based on linear or even second-order dynamics become insufficient. This paper introduces the concept of temporal compression as an emergent property of systems approaching singularity-like regimes. Drawing on analogies from vortex dynamics and relativistic space-time distortion, we demonstrate that third-derivative behavior (d³I/dt³ > 0) produces a measurable contraction in the interval between cause and effect. This results in a perceived acceleration of time, where events unfold faster than adaptive, institutional, or predictive capacities can respond. We argue that this phenomenon represents not a literal alteration of time, but a structural feature of nonlinear systems approaching instability, with significant implications for risk modeling, policy, and system resilience.


1. Introduction: Time as a Function of System Dynamics

Time, in physical systems, is typically treated as a constant parameter. However, in complex systems approaching instability, the perception and functional experience of time can change dramatically. This occurs when the rate of change, the acceleration of change, and the acceleration of acceleration all increase simultaneously.

This paper explores how third-derivative dynamics produce a form of temporal compression, in which the interval between meaningful system changes decreases over time. While time itself does not physically accelerate in the climate–economic system, the density of events per unit time increases, creating conditions that resemble time distortion.


2. Mathematical Framework: Third Derivative and Event Density

We define system impact as a function of time:

I(t)

The derivatives of this function describe system dynamics:

dI/dt > 0     (change is occurring)
d²I/dt² > 0 (change is accelerating)
d³I/dt³ > 0 (acceleration is increasing)

The presence of a positive third derivative implies that:

  • The rate of change is increasing
  • The rate of acceleration is also increasing

This leads to a compression of temporal intervals between events of a given magnitude:

Δt₁ > Δt₂ > Δt₃ ...

Where each successive interval between comparable impacts becomes shorter.


3. Vortex Dynamics: Spatial Compression as Temporal Analogy

A useful physical analogy is found in vortex behavior. In fact, this was one of the earliest analogies we used in the mid-1990s to describe climate-related time compression. Imagine being on a floating object in a flushing toilet: at first, you move slowly around the outer edge, but as you are drawn inward, your motion accelerates rapidly. The closer you get to the center, the faster everything happens. The question becomes: do you recognize that acceleration in time to respond before being flushed down the drain?

These forces are governed by:

v ∝ 1 / r

As radius decreases:

r → 0 ⇒ v → very large

In practical terms:

  • Motion accelerates rapidly toward the center
  • Small spatial changes produce large velocity increases

This creates a spatial compression of dynamics, where the system evolves faster over shorter distances.

Temporal Interpretation

If spatial distance is mapped to time progression, the vortex illustrates:

  • Slow, stable behavior far from the center
  • Rapid, chaotic behavior near the core

This is directly analogous to temporal compression in climate systems, where:

  • Early changes are gradual
  • Later changes occur in rapid succession

In tornado dynamics, this is observed as:

  • Gradual formation
  • Sudden touchdown
  • Rapid, high-intensity impact

4. Relativistic Analogy: Time Distortion in Strong Fields

In general relativity, extreme gravitational fields distort space-time. Near massive objects:

  • Time slows relative to distant observers
  • Physical processes deviate from classical expectations

While the climate–economic system does not alter time physically, it exhibits a structurally similar phenomenon:

  • Model breakdown near critical thresholds
  • Increased sensitivity to initial conditions
  • Nonlinear amplification of small perturbations

Thus, the analogy is not literal but functional: both systems approach a boundary where conventional rules lose predictive power.


5. Wormhole Analogy: Compression of Cause and Effect

A wormhole represents a shortcut through space-time, connecting distant points with minimal separation.

In stable systems:

Cause → Delay → Effect

In nonlinear, coupled systems near instability:

Cause → Immediate, amplified effect

Feedback loops effectively eliminate delay:

  • Climate impacts trigger immediate economic responses
  • Economic stress reduces adaptive capacity
  • Reduced capacity amplifies subsequent impacts

This creates a compression of causal distance, analogous to a wormhole collapsing space-time separation.


6. Climate–Economic Systems: Temporal Compression in Practice

The coupled climate–economic system now exhibits:

  • Increasing frequency of extreme events
  • Reduced recovery time between disruptions
  • Overlapping and compounding crises

This can be expressed as:

Event Frequency ↑  
Recovery Time ↓
Overlap Probability ↑

The result is a system in which:

  • Events cluster in time
  • System memory (recovery capacity) degrades
  • Instability propagates across domains

7. Implications for Predictability and Risk

As temporal compression intensifies:

  • Forecasting horizons shorten
  • Model reliability decreases
  • Tail risks become dominant

Traditional risk models assume:

  • Stationarity
  • Independence of events
  • Linear scaling

These assumptions fail under third-derivative dynamics.

Instead, systems exhibit:

  • Path dependence
  • Feedback dominance
  • Emergent, nonlinear transitions

8. Synthesis: Singularity as Temporal Boundary

Across all analogies—vortex, relativity, and wormholes—a common principle emerges:

Singularity does not imply infinity, but the breakdown of predictability.

In the climate–economic context, singularity represents:

  • A boundary where time intervals between major events collapse
  • A regime where small perturbations trigger large-scale responses
  • A system where adaptation cannot keep pace with change

9. Conclusion

The presence of third-derivative dynamics (d³I/dt³ > 0) in the coupled climate–economic system indicates a transition toward singularity-like behavior characterized by temporal compression. While time itself remains constant, the effective pace of system change accelerates, compressing the interval between cause and consequence.

Analogies from vortex dynamics and relativistic physics provide useful frameworks for understanding this phenomenon. In each case, systems approaching critical thresholds exhibit:

  • Rapid acceleration of dynamics
  • Increased sensitivity to small perturbations
  • Breakdown of conventional predictive models

If current trends persist, the continued compression of time between major events will challenge existing frameworks for adaptation, governance, and risk management. The central implication is clear:

The primary risk is no longer just change—but the accelerating pace at which change unfolds.


References

  • IPCC (2023). Sixth Assessment Report
  • Lenton, T. et al. (2019). Climate tipping points
  • Hansen, J. et al. (2016). Ice melt and sea level rise
  • NOAA National Centers for Environmental Information. Billion-Dollar Disasters Database

bookmark_borderApproaching Singularity: Third Derivatives, Nonlinear Collapse, and Coupled Climate–Economic Instability

Daniel Brouse¹ and Sidd Mukherjee²
March 2026

¹Independent Climate Researcher, Economist
²Physicist


Abstract

A singularity in physics describes a regime in which governing equations break down, often producing non-physical or undefined results such as infinities. While true singularities are rare in real-world systems, many complex systems exhibit singularity-like behavior as they approach critical thresholds characterized by nonlinear amplification, loss of stability, and breakdown of predictability.

This paper develops a unified framework linking physical singularities to real-world system collapse through two analogs: dam failure and vortex dynamics. These systems demonstrate how gradual forcing can produce hidden instability, followed by abrupt, nonlinear transition. We extend this framework to the coupled climate–economic system, presenting evidence that both domains are exhibiting third-derivative behavior (d³I/dt³ > 0), indicating accelerating acceleration. We argue that this dynamic is consistent with systems approaching singularity-like regimes, where small perturbations can trigger large-scale, system-wide responses.


1. Introduction: Singularity as a Boundary of Predictability

In physics, a singularity represents a point at which known laws cease to produce meaningful predictions. Mathematically, this often appears as divergence toward infinity or undefined behavior.

In real-world systems, singularities rarely manifest as literal infinities. Instead, they represent boundaries of model validity, where:

  • linear assumptions fail
  • system sensitivity increases dramatically
  • behavior becomes nonlinear, unstable, and difficult to predict

This paper interprets singularity not as a point, but as a transition regime—a shift from stable, predictable dynamics to chaotic, self-reinforcing behavior.

Singularity marks the boundary of predictability—the edge of what can be reliably observed, modeled, and understood.


2. Dam Collapse: A Physical Analogy of Singularity

2.1 Gradual Forcing and Hidden Instability

A dam subjected to rising water levels exhibits initially stable behavior:

  • water level increases
  • structural stress accumulates
  • micro-fractures develop internally

Despite increasing internal stress, the system appears stable. This reflects latent instability, where damage accumulates without immediate failure.

This process is directly analogous to climate dynamics:

  • rising global temperatures
  • increasing ocean heat content
  • accumulation of greenhouse gases

2.2 Nonlinear Threshold Behavior

Structural stress does not scale linearly with forcing. Instead:

Stress ∝ h
Force ∝ h²

where h is water height.

As a result, small increases in forcing produce disproportionately large increases in stress. Failure risk becomes a nonlinear function of accumulated strain.


2.3 Critical Threshold and Collapse

At a critical point:

  • the dam remains intact
  • but internal stability is effectively exhausted

At this stage:

A small perturbation → catastrophic failure

This transition exhibits singularity-like behavior:

  • system response becomes disproportionate to input
  • predictability collapses
  • linear models fail

2.4 Runaway Dynamics and Feedback

Once failure begins:

  • crack propagation accelerates
  • water flow increases
  • erosion intensifies
  • structural resistance collapses

This creates a positive feedback loop:

More flow → more erosion → larger breach → more flow

Formally:

d²I/dt² > 0
d³I/dt³ > 0


2.5 Functional Singularity

Although no true infinity occurs, the system undergoes a discontinuous transition:

Stable → Unstable → Collapse

This represents a functional singularity—a point where system behavior changes abruptly and irreversibly.


3. Vortex Dynamics: Singular Behavior in Fluid Systems

3.1 Energy Input and Self-Organization

Vortices emerge from energy input into a fluid system:

  • pressure gradients develop
  • rotational motion forms
  • angular momentum is conserved

The system organizes into a coherent structure.


3.2 Nonlinear Acceleration Toward the Core

A defining vortex property is:

v ∝ 1 / r

As radius decreases:

r → 0 ⇒ v → ∞

This represents a mathematical singularity.


3.3 Breakdown of Physical Validity

In reality, infinite velocity does not occur. Instead:

lim (r → 0) v(r) → undefined

This signals:

  • breakdown of governing equations
  • transition beyond laminar flow assumptions

3.4 Transition to Turbulence

As the vortex intensifies:

  • turbulence develops
  • instabilities emerge
  • dissipation increases
  • structure degrades

Thus:

Singularity → Turbulence → Instability


3.5 Feedback Amplification

Vortices are governed by reinforcing dynamics:

Faster rotation → lower pressure → stronger inflow → faster rotation

Which corresponds to:

dv/dt > 0
d²v/dt² > 0
d³v/dt³ > 0


3.6 Singular Behavior Without Infinity

The vortex demonstrates that singularities represent:

  • extreme sensitivity to small changes
  • rapid nonlinear amplification
  • breakdown of predictability

Formally:

|dv/dr| → ∞ as r → 0


4. Climate and Economic Singularity

The climate system and the global economy form a coupled nonlinear system characterized by reinforcing feedback loops. Increasing evidence suggests both systems are exhibiting third-derivative behavior:

dI/dt > 0
d²I/dt² > 0
d³I/dt³ > 0

This indicates:

  • impacts are increasing
  • acceleration is increasing
  • acceleration itself is increasing

4.1 Coupled Feedback Dynamics

The interaction between climate and economic systems can be expressed as:

Increasing climate impacts → rising economic losses → reduced adaptive capacity → increased vulnerability → further impacts

This creates a self-reinforcing feedback loop.


4.2 Mechanisms of Nonlinear Amplification

Climate system drivers include:

  • ice-albedo feedback
  • ocean heat accumulation
  • atmospheric moisture amplification
  • ecosystem degradation

Economic responses include:

  • rising disaster losses
  • infrastructure stress
  • insurance market withdrawal
  • capital mispricing
  • sovereign fiscal pressure

4.3 Singularity-Like Regime

As feedbacks intensify, both systems approach a regime characterized by:

  • extreme sensitivity to small perturbations
  • dominance of feedback loops
  • breakdown of predictive models
  • increasing probability of abrupt transitions

This defines singularity-like behavior.


4.4 Phase Transition Dynamics

Collapse should not be viewed as a single event, but as a phase transition:

Stable → Nonlinear → Chaotic

In this regime:

  • volatility increases
  • system coherence degrades
  • cascading failures become more likely

5. Synthesis: From Physical Systems to Climate Risk

Both dam collapse and vortex dynamics demonstrate a common principle:

Singularity ≠ infinity
Singularity = breakdown of stability and predictability

Across systems:

Physical SystemBehavior Near Singularity
DamStructural collapse
VortexTurbulence
ClimateCascading instability
EconomySystemic financial stress

6. Conclusion

This analysis demonstrates that singularity-like behavior is a defining feature of nonlinear systems approaching instability. Both physical analogs—dam failure and vortex dynamics—illustrate how gradual forcing can lead to abrupt, disproportionate outcomes through feedback amplification.

The coupled climate–economic system now exhibits similar characteristics, including positive third-derivative behavior (d³I/dt³ > 0), indicating accelerating acceleration. This dynamic suggests that the system is entering a regime where:

  • small perturbations can produce large-scale impacts
  • predictability is increasingly limited
  • nonlinear feedbacks dominate system behavior

Importantly, the concept of singularity in this context does not imply infinite outcomes, but rather a transition beyond the limits of conventional modeling and incremental adaptation. If current trends persist, the probability of rapid, system-wide disruption will continue to increase—not as a distant possibility, but as an emergent property of the system itself.

Singularity represents the boundary of understanding. As systems approach and cross this boundary, the risk of cascading failures increases nonlinearly over time, making large-scale disruption increasingly likely even in response to relatively small perturbations.


References

IPCC (2023). Sixth Assessment Report
Lenton, T. et al. (2019). Climate tipping points
Hansen, J. et al. (2016). Ice melt and sea level rise
NOAA National Centers for Environmental Information. Billion-Dollar Weather and Climate Disasters Database

bookmark_borderClimate and Economic Singularity (Very Simple Version)

Daniel Brouse¹ and Sidd Mukherjee²
March 2026


Big Idea

Some systems look stable… until they suddenly aren’t.

In science, a singularity is when our math and predictions stop working well. It might look like things are going to “infinity,” but in real life, that doesn’t actually happen.

Instead, it means:

  • Small changes can cause very big effects
  • Systems can become unstable
  • Things become hard to predict

This paper says that both the climate and the economy are moving toward this kind of point.

Even more important: they are connected.
Each one makes the other worse, creating a loop that keeps speeding things up.

This is like:

  • A dam about to break
  • A tornado touching the ground
  • Water spinning down a drain

They seem fine at first… then suddenly change very fast.


1. What Is a Singularity?

A singularity is not really a single point.

It’s more like a change zone:

  • Stable → Unstable
  • Predictable → Unpredictable
  • Calm → Chaotic

👉 It’s the edge of what we can understand.


2. The Dam Example

Step 1: Looks Safe

  • Water rises slowly
  • Pressure builds
  • Small cracks form

Everything looks okay.


Step 2: Hidden Danger

Pressure grows faster than you expect.

Small increases in water → much bigger stress


Step 3: Breaking Point

At some point:

  • The dam is still standing
  • But it’s already weak

Then:

👉 One small change → total collapse


Step 4: Collapse Speeds Up

Once it starts:

  • More water flows → more damage
  • More damage → even more water

This creates a loop:

👉 More flow → more damage → more flow


Key Idea

A dam doesn’t break slowly.

It goes:

Stable → Unstable → Collapse


3. The Vortex Example (Like Water Down a Drain or a Tornado)

When water spins—or when air spins in a tornado:

  • The closer you get to the center
  • The faster it moves

As you get very close:

  • Speed increases very quickly
  • Everything gets pulled inward

This is similar to a tornado touching down:

  • At first, it forms in the sky
  • Then it reaches the ground
  • Suddenly, the spinning becomes very strong and destructive

In real life:

  • It doesn’t go to infinity
  • It becomes wild, chaotic, and damaging

👉 The system stops behaving in a simple, predictable way.


Key Idea

Near the center:

  • Small changes → big effects
  • Things become hard to predict

4. What This Means for Climate and the Economy

We see the same pattern:

  • Things are getting worse
  • They’re getting worse faster
  • The speeding-up is also increasing

👉 In simple terms:

  • Problems are growing
  • The growth is speeding up
  • And that speed-up is getting stronger

5. The Feedback Loop Problem

Climate and the economy affect each other:

More climate damage
→ more money lost
→ less ability to fix problems
→ more risk
→ even more damage

👉 This is a loop that keeps making things worse.


6. Why This Is Dangerous

As systems get close to this “singularity”:

  • Small events can cause big problems
  • Predictions become less reliable
  • Instability spreads

Examples:

  • Dam → sudden collapse
  • Vortex → chaos
  • Climate → chain reactions
  • Economy → financial stress

7. The Most Important Idea

Singularity does not mean infinity.

It means:

👉 Loss of stability and predictability


8. What Happens Next?

If things keep going this way:

  • Disruptions happen more often
  • Systems become weaker
  • Big failures become more likely

Not from one big event…

👉 But from pressure building over time + feedback loops


Final Thought

Singularity is the edge of understanding.

As we get closer:

  • Small changes matter more
  • Risks grow faster
  • Things get harder to control

👉 The real danger isn’t just change—
it’s how fast the change is speeding up.


References (Simple)

  • IPCC – Climate report
  • Lenton – Tipping points
  • Hansen – Ice melt
  • NOAA – Disaster costs