bookmark_borderOil: A Slippery Slope (Literally and Figuratively)

Oil is one of those subjects that’s surprisingly slippery—both physically and economically. Most people know prices go up and down, but few realize that even storing oil comes with limits.

Take the U.S. Strategic Petroleum Reserve (SPR). It’s often treated like a giant underground gas tank that can be drained and refilled at will. Not quite. The reserve is stored in massive salt caverns, and if inventories fall below roughly 40% of its 714 million-barrel capacity (about 285 million barrels), the Department of Energy limits additional emergency withdrawals. The reason isn’t politics—it’s geology. Keeping enough oil in the caverns helps maintain their long-term operational integrity.

The same basic challenge applies everywhere. Oil storage isn’t as simple as stacking barrels in a warehouse. Tanks, pipelines, and underground caverns all have practical operating limits, and those limits can shape energy policy as much as supply and demand.

Then there’s China.

Despite a conflict that many expected would trigger a buying spree, China has reportedly remained on the sidelines for months rather than aggressively increasing crude purchases. Whether that’s because of existing inventories, weak domestic demand, economic strategy, or expectations of lower future prices is open to debate.

The interesting question isn’t whether China can avoid buying oil today. It’s how long it can continue doing so.

Eventually, inventories run down, demand changes, or market conditions shift. And when one of the world’s largest oil consumers steps back into the market, everyone notices.

Oil has always been a slippery business. Sometimes the biggest mystery isn’t where the oil is—it’s who’s not buying it.

Now for the Math…

If global oil inventories are scraping the bottom of the barrel, and the world’s largest importer suddenly has to start buying again…

…does 1 + 1 = 5?

Not in arithmetic. But in commodity markets, sometimes it feels that way.

When supply is already tight, prices don’t rise in a neat, linear fashion. A relatively small increase in demand can trigger a disproportionately large jump in price as buyers compete for the same limited barrels. Traders see it coming, futures markets react, inventories shrink even faster, and a little bit of demand can snowball into a much bigger price move.

In other words, 1 + 1 doesn’t equal 5 because the math changed—it equals 5 because human behavior did.

Oil markets have always had a nonlinear streak. When inventories are comfortable, an extra million barrels a day barely makes a ripple. But when stocks are running low and spare capacity is scarce, that same million barrels can feel like throwing a match into a room full of gasoline.

That’s why economists watch inventories just as closely as production. Sometimes the most important number isn’t how much oil is being pumped—it’s how much is left in the tank.

bookmark_borderAccounting for Climate Responsibility

by Daniel Brouse

Comparing Two Approaches to Measuring Humanity’s Climate Footprint

Climate responsibility depends on how emissions are assigned. Traditional territorial accounting attributes emissions to the country where they occur, but globalization has made that approach increasingly incomplete. Modern supply chains, international trade, and service-based economies often separate where emissions are produced from who ultimately benefits from them.

To explore this problem from two different perspectives, I developed two complementary accounting frameworks.

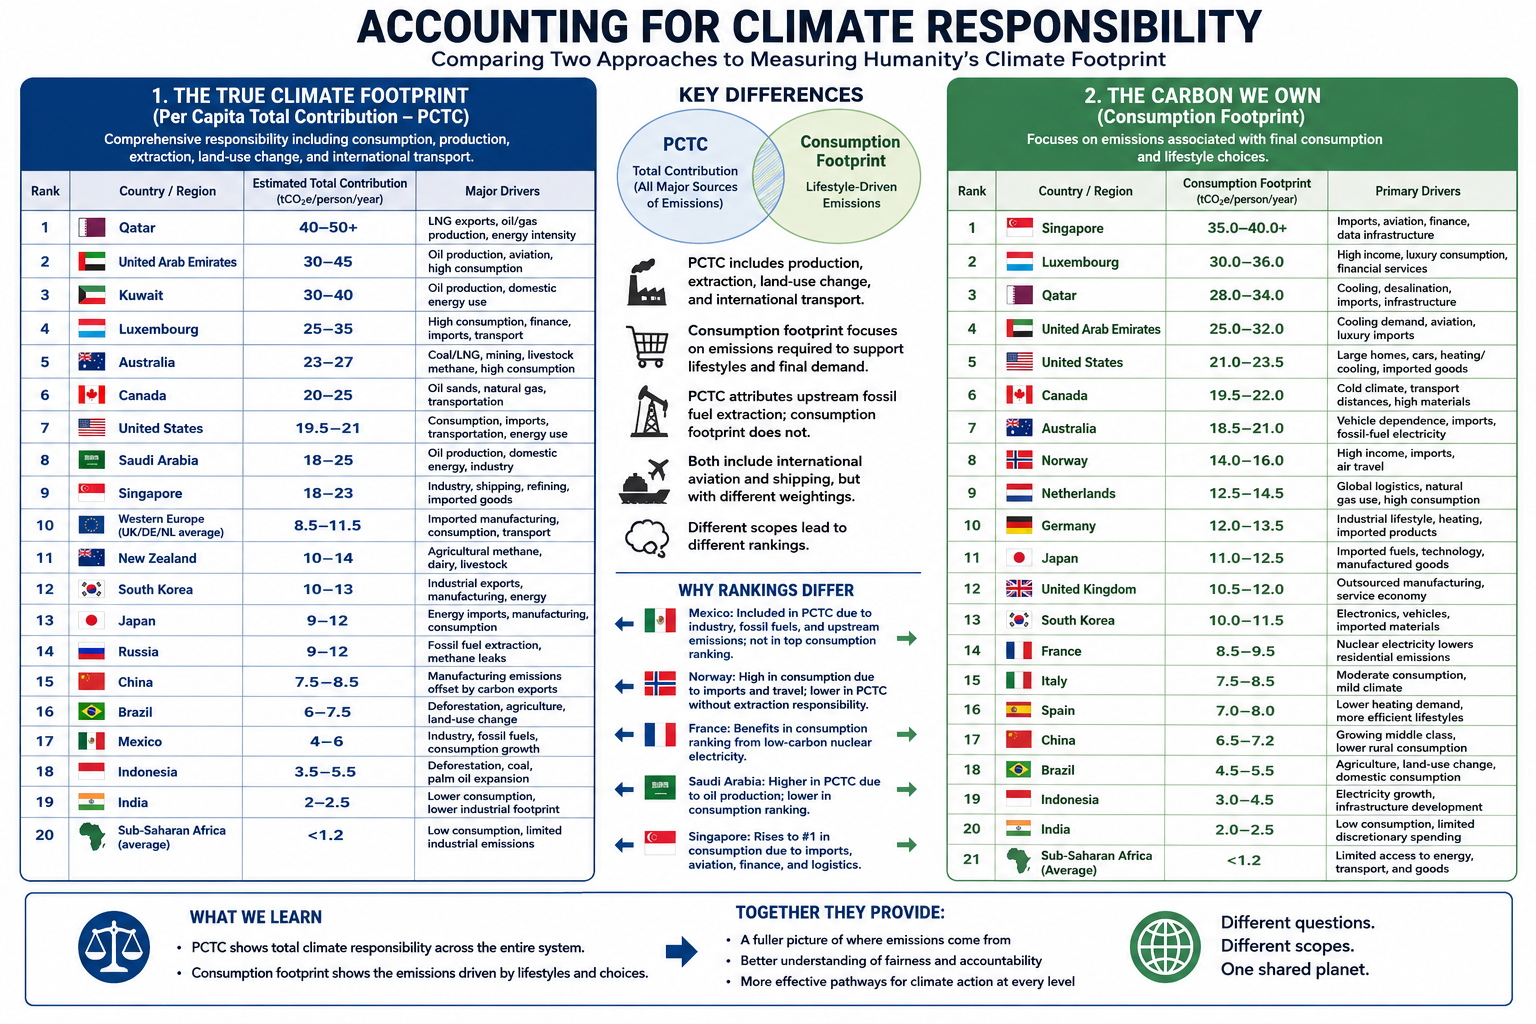
The first paper, The True Climate Footprint: Measuring Per Capita Total Contribution Beyond Territorial Emissions, introduces the Per Capita Total Contribution (PCTC) framework. PCTC seeks to estimate an individual’s or nation’s complete climate responsibility by incorporating not only consumption, but also several major sources of emissions that are frequently omitted from conventional carbon accounting.

The True Climate Footprint: Measuring Per Capita Total Contribution

The PCTC framework includes:

  • Consumption-based emissions
  • Land-use change and deforestation
  • Upstream fossil fuel extraction (methane leakage, flaring, and coal mine emissions)
  • International aviation and maritime shipping
  • All major greenhouse gases (CO₂, CH₄, N₂O, and others expressed as CO₂-equivalent)
  • Responsibility associated with fossil fuel production where appropriate

The second paper, The Carbon We Own: Why Consumption Matters More, examines climate responsibility from a different perspective. Rather than estimating total climate contribution, it focuses specifically on the carbon footprint required to support modern lifestyles using a consumption-based accounting approach.

The Carbon We Own: Why Consumption Matters More

This framework emphasizes:

  • Multi-Regional Input-Output (MRIO) accounting
  • Direct household energy use
  • Embedded emissions in imported goods
  • Public and private services
  • Lifestyle and purchasing choices

Unlike PCTC, this framework intentionally places less emphasis on fossil fuel extraction and producer responsibility in order to better isolate the climate impacts associated with everyday consumption.

After completing the first paper, I wanted to examine the climate footprint from the perspective of the consumer rather than the entire climate system. The PCTC framework provides a comprehensive measure of total responsibility, but it does not distinguish as clearly between emissions driven by individual lifestyle choices and those associated with resource extraction or national production.

A consumption-based framework highlights decisions that individuals and societies can influence more directly. Choices such as lowering a home’s thermostat, improving insulation, selecting public transportation or electric vehicles instead of internal combustion vehicles, reducing air travel, or purchasing fewer carbon-intensive goods become more visible within the accounting. It also better captures the increasingly important role of service-based economies. While services may appear less energy-intensive than manufacturing, sectors such as healthcare, finance, telecommunications, cloud computing, and artificial intelligence rely on extensive digital infrastructure—including energy-hungry data centers—that can be substantially underrepresented in traditional emissions inventories.

Finally, I wanted a more detailed comparison among developed economies, particularly within Europe. Countries such as Norway and France illustrate why accounting methodology matters. Norway has one of the world’s cleanest domestic electricity systems, powered primarily by hydropower, yet it is also a major exporter of oil and natural gas. France, by contrast, derives much of its electricity from nuclear power, resulting in comparatively low-carbon domestic energy while maintaining a high standard of living. Comparing these countries under both frameworks reveals how different accounting methods assign responsibility and helps illustrate the strengths and limitations of each approach.

Taken together, these two papers do not compete—they answer different questions. Per Capita Total Contribution (PCTC) asks, What is humanity’s full climate responsibility? Consumption-based accounting asks, What emissions are required to sustain the lifestyle of the average resident? Used together, they provide a more complete understanding of climate responsibility than either framework alone.

Conclusion

Although The True Climate Footprint and The Carbon We Own both seek to improve upon traditional territorial emissions accounting, they answer different questions because they are built on different accounting frameworks.

The True Climate Footprint uses the Per Capita Total Contribution (PCTC) framework to estimate an individual’s or nation’s complete contribution to climate change. It extends beyond consumption to include land-use change, upstream fossil fuel extraction, international shipping and aviation, and the full spectrum of greenhouse gases. In some cases, it also attributes responsibility associated with fossil-fuel production, providing a broad measure of humanity’s total climate impact.

By contrast, The Carbon We Own focuses specifically on consumption-based climate responsibility. Using Multi-Regional Input-Output (MRIO) accounting, it assigns emissions to the final consumer by emphasizing direct household energy use, embedded emissions in imported goods, services, and lifestyle choices. It intentionally deemphasizes extraction and producer responsibility in order to better represent the carbon footprint required to sustain modern patterns of consumption.

Because these frameworks measure different aspects of climate responsibility, their rankings are not expected to be identical.

Mexico provides a useful illustration. Under the PCTC framework, Mexico’s estimated footprint includes domestic industry, fossil fuel production, growing consumption, and upstream emissions, resulting in an estimated contribution of approximately 4–6 tonnes of CO₂-equivalent per person per year. In the consumption-based analysis, however, Mexico does not appear among the highest-ranking countries because the focus is limited to end-user consumption, and the published rankings emphasize the world’s largest per-capita consumption footprints.

Similar differences appear elsewhere. Norway’s position changes substantially because one framework incorporates the climate responsibility associated with fossil fuel production, while the other emphasizes domestic consumption. France benefits in the consumption-based analysis because its low-carbon nuclear electricity reduces household emissions despite maintaining a high standard of living. Saudi Arabia ranks differently depending on whether responsibility is assigned to oil production or to energy consumption. Singapore rises dramatically under consumption accounting because imported goods, international aviation, finance, logistics, and digital infrastructure contribute heavily to its consumption footprint despite relatively limited domestic manufacturing.

These examples demonstrate that accounting methodology influences how climate responsibility is distributed. Production-based, consumption-based, and total-contribution frameworks each illuminate different dimensions of the global climate system.

Rather than viewing these approaches as competing methodologies, they should be regarded as complementary analytical tools. The Per Capita Total Contribution (PCTC) framework asks, What is a nation’s or individual’s total contribution to climate change? The consumption-based framework asks, What emissions are required to sustain the average resident’s lifestyle? Together, they provide a more complete understanding of climate responsibility than either approach can achieve alone, revealing both the systemic impacts of resource production and the powerful role of consumer demand in shaping the global climate.

bookmark_borderThe Carbon We Own: Why Consumption Matters More

by Daniel Brouse

For decades, climate responsibility has often been measured by where fossil fuels are extracted or where products are manufactured. While useful for tracking national emissions, this production-based approach can misrepresent who ultimately drives demand.

A consumption-based accounting approach shifts the focus to the end user. Instead of assigning emissions to the country where a product is made, it attributes emissions to the people and businesses that ultimately consume the energy, goods, and services.

Under this framework, every kilowatt-hour of electricity, every heating bill, every medical service, and every consumer product is assigned to its final destination.

For example, if a smartphone is manufactured in Asia using electricity generated from coal and then shipped across the Pacific to a consumer in Los Angeles, the emissions associated with mining, manufacturing, transportation, and delivery are attributed to the American consumer—not the manufacturing country.

This approach provides a more accurate picture of the carbon footprint associated with modern lifestyles.


How Consumption-Based Carbon Accounting Works

Most consumption analyses rely on Multi-Regional Input-Output (MRIO) economic models, which trace emissions through global supply chains before assigning them to final consumers.

Individual carbon footprints are generally divided into three major categories:

1. Direct Household Energy

Emissions from energy used directly by households, including:

  • Home heating and cooling
  • Residential electricity
  • Personal vehicle fuel
  • Digital activities such as internet usage and streaming services

2. Embedded Goods

Emissions generated while producing and transporting purchased products, including:

  • Electronics
  • Vehicles
  • Furniture
  • Clothing
  • Building materials
  • Household appliances

These emissions often occur in countries far from the final consumer.

3. Services

Many of the largest emissions in developed economies come not from physical products but from services, including:

  • Healthcare
  • Commercial aviation
  • Banking and finance
  • Cloud computing
  • Water and wastewater treatment
  • Telecommunications

In the United States alone, healthcare contributes roughly 1.6 tonnes of CO₂-equivalent emissions per person each year, illustrating how service-based economies can generate substantial carbon footprints even as heavy industry declines.


Major Findings from Global Consumption Accounting

The Rise of Service Economies

In wealthy economies such as Singapore, Luxembourg, and several Western European countries, manufacturing represents only a small portion of domestic emissions.

Instead, much of their climate impact comes from:

  • Commercial aviation
  • Financial systems
  • Cloud computing
  • Global logistics
  • Luxury consumption
  • High levels of imported goods

As economies become increasingly service-oriented, carbon emissions become embedded in complex international supply chains rather than local smokestacks.


Geography Still Matters

Climate strongly influences direct household energy use.

Countries with long, cold winters or extremely hot summers require substantially more energy for climate control.

For example:

  • Canada and the United States consume large amounts of energy for winter heating and summer air conditioning, particularly because of larger average home sizes.
  • Australia records comparatively higher emissions from agriculture, mining, and infrastructure development than from residential heating.

Local climate remains an important contributor even after imported goods are included.


China’s Manufacturing Versus Consumption

China illustrates one of the largest differences between production-based and consumption-based accounting.

Because China manufactures enormous quantities of products for export, its territorial emissions are among the highest in the world.

However, when emissions are allocated to the people who ultimately purchase those products, China’s domestic per-capita consumption footprint is estimated at roughly 6.8 tonnes of CO₂-equivalent per year.

This highlights the distinction between:

  • Production emissions (where goods are made)
  • Consumption emissions (who ultimately benefits from those goods)

Many products manufactured in China are consumed in North America and Europe, meaning a significant share of manufacturing emissions is driven by foreign demand.


Consumption Footprints Across Europe

Norway: Clean Electricity, High Consumption

Estimated consumption footprint: 14.8 tonnes CO₂e per person

Norway’s electricity is more than 85% hydropower, giving it one of the cleanest electrical grids in the world.

Yet Norwegians have high purchasing power and consume large quantities of imported goods, including:

  • Electric vehicles
  • Consumer electronics
  • Luxury goods
  • Imported foods

Norway also has one of the world’s highest rates of air travel per capita, increasing its service-sector emissions.

The result is a consumption footprint considerably larger than its territorial emissions suggest.


United Kingdom: Outsourcing Manufacturing

Estimated consumption footprint: 11.2 tonnes CO₂e per person

The United Kingdom has significantly reduced domestic production emissions by retiring coal-fired power plants and expanding renewable electricity.

However, much of the country’s manufacturing has shifted overseas.

The UK imports large quantities of:

  • Electronics
  • Machinery
  • Clothing
  • Construction materials

Consequently, much of its carbon footprint exists outside its borders, while domestic emissions increasingly come from finance, digital infrastructure, commercial services, and transportation.


France: The Nuclear Advantage

Estimated consumption footprint: 9.2 tonnes CO₂e per person

France demonstrates how a low-carbon electricity system can substantially reduce consumption emissions.

French households enjoy living standards comparable to neighboring Western European countries, yet much of their residential electricity, rail transportation, and heating is supplied by nuclear energy.

As a result, France’s direct household energy emissions are estimated to be roughly 30% lower than those of many neighboring countries with similar consumption patterns.


China Compared with Western Europe

When emissions are assigned to consumers rather than producers, an average citizen in countries such as Germany or the United Kingdom is responsible for nearly twice the carbon footprint of the average Chinese citizen.

Although China’s middle class continues to grow and domestic consumption is increasing, much of the country’s industrial output still serves international markets.

This comparison illustrates a key insight of consumption-based accounting:

A nation’s production does not necessarily reflect the climate impact of its residents’ lifestyles.


A Different Way to Think About Climate Responsibility

Consumption-based accounting reframes climate responsibility by asking a simple question:

Who ultimately benefits from the energy and resources consumed?

Rather than focusing solely on where emissions occur, this approach follows products and services through global supply chains to their final users.

For affluent economies that import large volumes of manufactured goods while exporting much of their industrial production, consumption-based accounting often reveals substantially higher per-capita climate footprints than traditional territorial inventories.

Viewed through this lens, lifestyle choices, purchasing power, housing, transportation, travel, healthcare, digital services, and overall consumption patterns become the primary drivers of individual climate responsibility.

Ultimately, the atmosphere responds to total emissions, regardless of where they occur. Consumption-based accounting provides a complementary perspective to traditional production-based inventories by connecting those emissions to the people and economies whose demand created them.

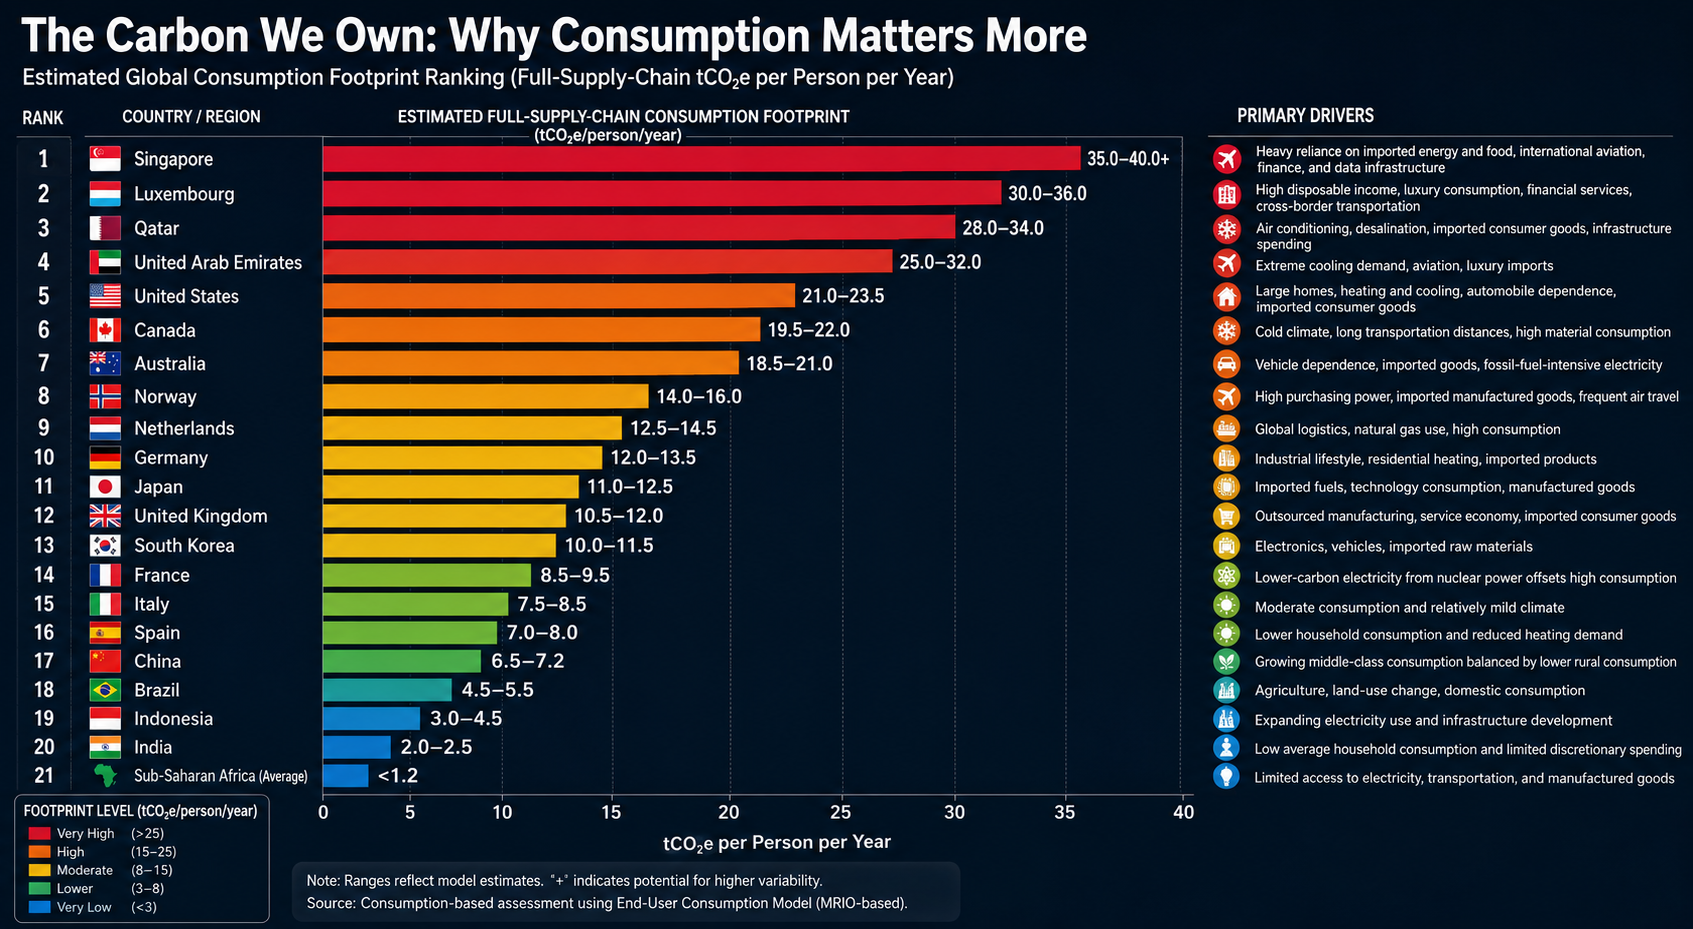
Global Consumption Footprint Rankings

Traditional emissions inventories assign carbon pollution to the country where fossil fuels are extracted or products are manufactured. A consumption-based accounting approach instead assigns those emissions to the people and economies that ultimately consume the goods and services.

The rankings below are based on an End-User Consumption Model, which allocates the full upstream supply-chain emissions—including raw material extraction, manufacturing, international transportation, agricultural land-use change, and other embedded emissions—to the final purchaser.

Rather than measuring where emissions occur, this framework estimates the carbon footprint required to sustain the average lifestyle of a country’s residents. It reflects direct household energy use, consumption of imported goods, transportation, public infrastructure, and carbon-intensive services.

Estimated Global Consumption Footprint Ranking

RankCountry / RegionEstimated Full-Supply-Chain Consumption Footprint (tCO₂e/person/year)Primary Drivers
1🇸🇬 Singapore35.0–40.0+Heavy reliance on imported energy and food, international aviation, finance, and data infrastructure
2🇱🇺 Luxembourg30.0–36.0High disposable income, luxury consumption, financial services, cross-border transportation
3🇶🇦 Qatar28.0–34.0Air conditioning, desalination, imported consumer goods, infrastructure spending
4🇦🇪 United Arab Emirates25.0–32.0Extreme cooling demand, aviation, luxury imports
5🇺🇸 United States21.0–23.5Large homes, heating and cooling, automobile dependence, imported consumer goods
6🇨🇦 Canada19.5–22.0Cold climate, long transportation distances, high material consumption
7🇦🇺 Australia18.5–21.0Vehicle dependence, imported goods, fossil-fuel-intensive electricity
8🇳🇴 Norway14.0–16.0High purchasing power, imported manufactured goods, frequent air travel
9🇳🇱 Netherlands12.5–14.5Global logistics, natural gas use, high consumption
10🇩🇪 Germany12.0–13.5Industrial lifestyle, residential heating, imported products
11🇯🇵 Japan11.0–12.5Imported fuels, technology consumption, manufactured goods
12🇬🇧 United Kingdom10.5–12.0Outsourced manufacturing, service economy, imported consumer goods
13🇰🇷 South Korea10.0–11.5Electronics, vehicles, imported raw materials
14🇫🇷 France8.5–9.5Lower-carbon electricity from nuclear power offsets high consumption
15🇮🇹 Italy7.5–8.5Moderate consumption and relatively mild climate
16🇪🇸 Spain7.0–8.0Lower household consumption and reduced heating demand
17🇨🇳 China6.5–7.2Growing middle-class consumption balanced by lower rural consumption
18🇧🇷 Brazil4.5–5.5Agriculture, land-use change, domestic consumption
19🇮🇩 Indonesia3.0–4.5Expanding electricity use and infrastructure development
20🇮🇳 India2.0–2.5Low average household consumption and limited discretionary spending
21Sub-Saharan Africa (Average)<1.2Limited access to electricity, transportation, and manufactured goods

Key Patterns

Small, Wealthy Nations Have the Largest Per-Capita Footprints

Singapore and Luxembourg rank highest despite having relatively little domestic heavy industry. Their residents consume large quantities of imported goods and services, while extensive international transportation, finance, aviation, and digital infrastructure contribute substantial embedded emissions.

High-Income, Car-Oriented Economies Form the Next Tier

The United States, Canada, and Australia consistently rank among the world’s largest per-capita consumers. Large homes, automobile-dependent communities, extensive heating or cooling needs, and high levels of discretionary consumption combine to produce substantial lifestyle-related emissions.

Low-Carbon Electricity Helps—but Doesn’t Eliminate Consumption Emissions

Countries such as France and Norway demonstrate that cleaner electricity significantly lowers household energy emissions. However, imported goods, international travel, and service-sector activities remain important contributors to their overall consumption footprints.

Manufacturing Countries Are Not Necessarily the Largest Consumers

China’s production-based emissions are among the highest globally because it manufactures goods for international markets. Under a consumption-based framework, however, the average Chinese citizen’s lifestyle footprint remains considerably lower than that of residents in many affluent Western countries.

Consumption Capacity Is the Strongest Predictor

Perhaps the clearest finding is the enormous gap between affluent economies and developing regions. Average per-capita consumption in Sub-Saharan Africa remains a small fraction of that in the world’s wealthiest nations, reflecting differences in income, energy access, transportation, housing, and consumer purchasing power.

This comparison underscores a central conclusion of consumption-based accounting: the carbon footprint of an individual is driven primarily by the scale and complexity of the lifestyle they support, rather than the geographic location where the associated emissions physically occur.

bookmark_borderThe True Climate Footprint: Measuring Per Capita Total Contribution

by Daniel Brouse

Why Traditional Carbon Accounting Underestimates Responsibility

Climate responsibility is often measured using territorial emissions: the greenhouse gases released within a country’s borders. While useful, this approach does not capture the full climate footprint of modern economies because it ignores global supply chains, outsourced manufacturing, land-use change, and upstream fossil fuel emissions.

A more complete measure requires calculating Per Capita Total Contribution—a footprint-based accounting system that assigns responsibility based on the full lifecycle of consumption and environmental impact.

This approach combines:

  • Consumption-based emissions accounting — tracking emissions embedded in imported goods and services.
  • Land Use Change (LUC) — including deforestation, agricultural expansion, and ecosystem conversion.
  • Upstream fossil fuel emissions — including methane leaks, flaring, and coal mine emissions.
  • International transportation — including aviation and shipping.
  • All greenhouse gases — not just carbon dioxide, but methane, nitrous oxide, and other climate pollutants.

Using this broader framework, humanity’s total annual climate footprint rises to approximately 53.5 billion tonnes of CO₂-equivalent (CO₂e), or about 6.6 tonnes of CO₂e per person globally.

However, once these factors are included, the global map of climate responsibility changes dramatically.


1. The Hidden Carbon Footprint of Global Trade

Outsourced Emissions: When Consumption Drives Pollution Elsewhere

Traditional accounting assigns emissions to the country where goods are produced. This creates a major distortion in a globalized economy.

Consumption-based accounting reverses this by:

  • Subtracting emissions from exports.
  • Adding emissions embedded in imports.
  • Assigning responsibility to the final consumer.

This reveals a significant shift:

Western Consumption Footprints Expand

Many wealthy nations have reduced domestic industrial emissions partly by moving manufacturing overseas. Electronics, clothing, machinery, and other consumer products may be manufactured in China or Southeast Asia, but much of the demand originates in North America and Europe.

The emissions occur in the producing country, but the consumption benefit occurs elsewhere.

Carbon Exporters vs. Carbon Importers

Under territorial accounting:

  • Manufacturing nations appear more responsible.
  • Consumer nations appear cleaner.

Under footprint accounting:

  • Major consumer economies become large net importers of carbon emissions.
  • Manufacturing hubs become net exporters of embedded carbon.

2. The Missing Climate Cost of Land Use Change

Deforestation and land conversion contribute roughly 10% of global greenhouse gas emissions.

However, these emissions are rarely assigned to the ultimate consumers driving demand.

A complete accounting system tracks:

  • Beef production linked to Amazon clearing.
  • Soy expansion replacing forests.
  • Palm oil plantations.
  • Timber extraction.
  • Agricultural conversion.

Consumer-Driven Deforestation Footprints

Some nations experience a substantial increase in their climate footprint when imported commodities are included.

Examples:

  • Wealthy food-importing nations may carry a larger footprint because their consumption drives land clearing elsewhere.
  • Countries such as Brazil and Indonesia receive major additions from domestic land-use change before those emissions are redistributed through trade.

3. Fossil Fuel Extraction: Counting the Full Climate Cost

Burning fossil fuels is only part of their climate impact.

A complete footprint must include emissions from extraction:

  • Methane leakage from oil and gas production.
  • Coal mine methane releases.
  • Flaring.
  • Venting during production and transport.

Methane is especially important because it is approximately 30 times more powerful than carbon dioxide over a 100-year period.

Territorial accounting can distort responsibility:

  • Fossil fuel exporters may appear responsible for extraction emissions occurring within their borders.
  • Consumer nations benefit from the energy but avoid the associated extraction footprint.

A true accounting system assigns these emissions across the entire fossil fuel supply chain, including the countries ultimately consuming the energy.


The Recalculated Climate Responsibility Landscape

Country / RegionStandard Territorial CO₂ (Fossil Fuels Only)Estimated Total Contribution (All GHGs + Trade + Land Use + Transport)Primary Driver of Change
United States~14.9 tonnes/person~19.5–21.0 tonnes/personHigh consumption, imported manufacturing, carbon-intensive lifestyles
Western Europe~4.5–7.0 tonnes/person~8.5–11.5 tonnes/personOutsourced manufacturing and imported goods
China~8.0 tonnes/person~7.5–8.5 tonnes/personLarge manufacturing exporter offsets domestic emissions
Brazil~2.3 tonnes/person~6.0–7.5 tonnes/personDeforestation and agricultural land conversion
India~2.0 tonnes/person~2.2 tonnes/personLower consumption footprint
Sub-Saharan Africa<1.0 tonnes/person<1.2 tonnes/personLow consumption and limited industrial emissions

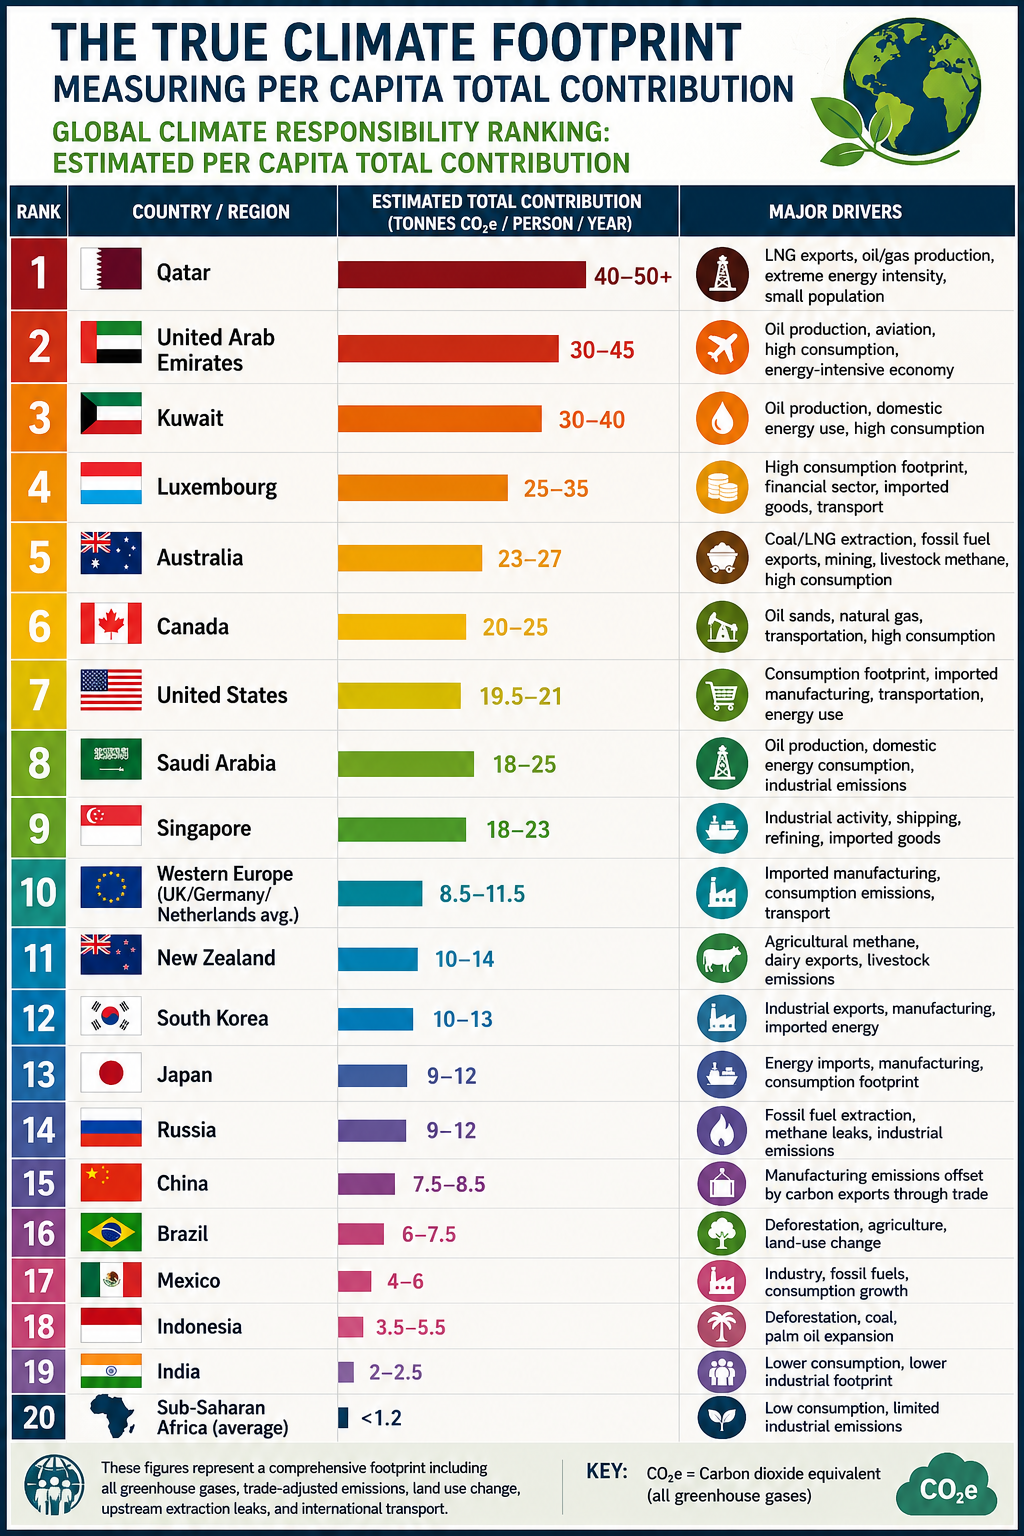
Global Climate Responsibility Ranking: Estimated Per Capita Total Contribution

RankCountry / RegionEstimated Total Contribution (Tonnes CO₂e/person/year)Major Drivers
1Qatar40–50+LNG exports, oil/gas production, extreme energy intensity, small population
2United Arab Emirates30–45Oil production, aviation, high consumption, energy-intensive economy
3Kuwait30–40Oil production, domestic energy use, high consumption
4Luxembourg25–35High consumption footprint, financial sector, imported goods, transport
5Australia23–27Coal/LNG extraction, fossil fuel exports, mining, livestock methane, high consumption
6Canada20–25Oil sands, natural gas, transportation, high consumption
7United States19.5–21Consumption footprint, imported manufacturing, transportation, energy use
8Saudi Arabia18–25Oil production, domestic energy consumption, industrial emissions
9Singapore18–23Industrial activity, shipping, refining, imported goods
10Western Europe (UK/Germany/Netherlands average)8.5–11.5Imported manufacturing, consumption emissions, transport
11New Zealand10–14Agricultural methane, dairy exports, livestock emissions
12South Korea10–13Industrial exports, manufacturing, imported energy
13Japan9–12Energy imports, manufacturing, consumption footprint
14Russia9–12Fossil fuel extraction, methane leaks, industrial emissions
15China7.5–8.5Manufacturing emissions offset by carbon exports through trade
16Brazil6–7.5Deforestation, agriculture, land-use change
17Mexico4–6Industry, fossil fuels, consumption growth
18Indonesia3.5–5.5Deforestation, coal, palm oil expansion
19India2–2.5Lower consumption, lower industrial footprint
20Sub-Saharan Africa (average)<1.2Low consumption, limited industrial emissions

The Real Climate Equation: Consumption × Population × Technology

The climate challenge is often framed as a population problem. However, the dominant driver of emissions is not simply the number of people on Earth—it is the per capita intensity of resource consumption and pollution.

A more accurate equation is:Total Climate Impact=Population×Per Capita Consumption×Carbon Intensity\textbf{Total Climate Impact} = \textbf{Population} \times \textbf{Per Capita Consumption} \times \textbf{Carbon Intensity}Total Climate Impact=Population×Per Capita Consumption×Carbon Intensity

Population matters, but consumption patterns and technology determine the magnitude of environmental impact.

A world with billions more people using efficient, low-carbon systems could have a smaller footprint than a smaller population consuming resources at current high-intensity levels.


Toward a Fairer Climate Accounting System

Territorial emissions remain useful for tracking national inventories, but they do not fully capture responsibility in a globalized economy.

A true Per Capita Total Contribution framework recognizes that climate change is driven by:

  • Who consumes resources.
  • Who benefits from production.
  • Who drives land conversion.
  • Who extracts and burns fossil fuels.
  • Who has the technological and economic capacity to reduce emissions.

The future of climate accountability depends on moving beyond borders and measuring the complete human footprint on Earth.


Conclusion

The climate conversation has focused on the wrong number.

The problem isn’t simply how many people live on Earth.

It’s how each of us lives.

The average person on the planet is responsible for about 6.6 tonnes of CO₂e per year, but the differences between countries are staggering. Some affluent societies generate 20–50+ tonnes per person, while much of the developing world contributes less than 2 tonnes.

That’s why climate responsibility is better measured by per capita total contribution—including consumption, outsourced manufacturing, deforestation, fossil fuel extraction, agriculture, and transportation—not just emissions produced within national borders.

A child born into a high-consumption lifestyle can have a climate footprint many times larger than several people living in low-consumption economies.

The challenge is not humanity itself.

The challenge is how we consume, how we produce, and how much we extract from the planet.

Changing lifestyles, improving efficiency, and transitioning to cleaner energy can reduce our impact without reducing our humanity.

The future depends less on the number of people—and more on the choices each of us makes.


bookmark_border2026 Climate Disasters: A Year of Escalating Heat, Floods, Storms, and Climate Amplification

by Daniel Brouse

A Global Climate System Under Increasing Stress

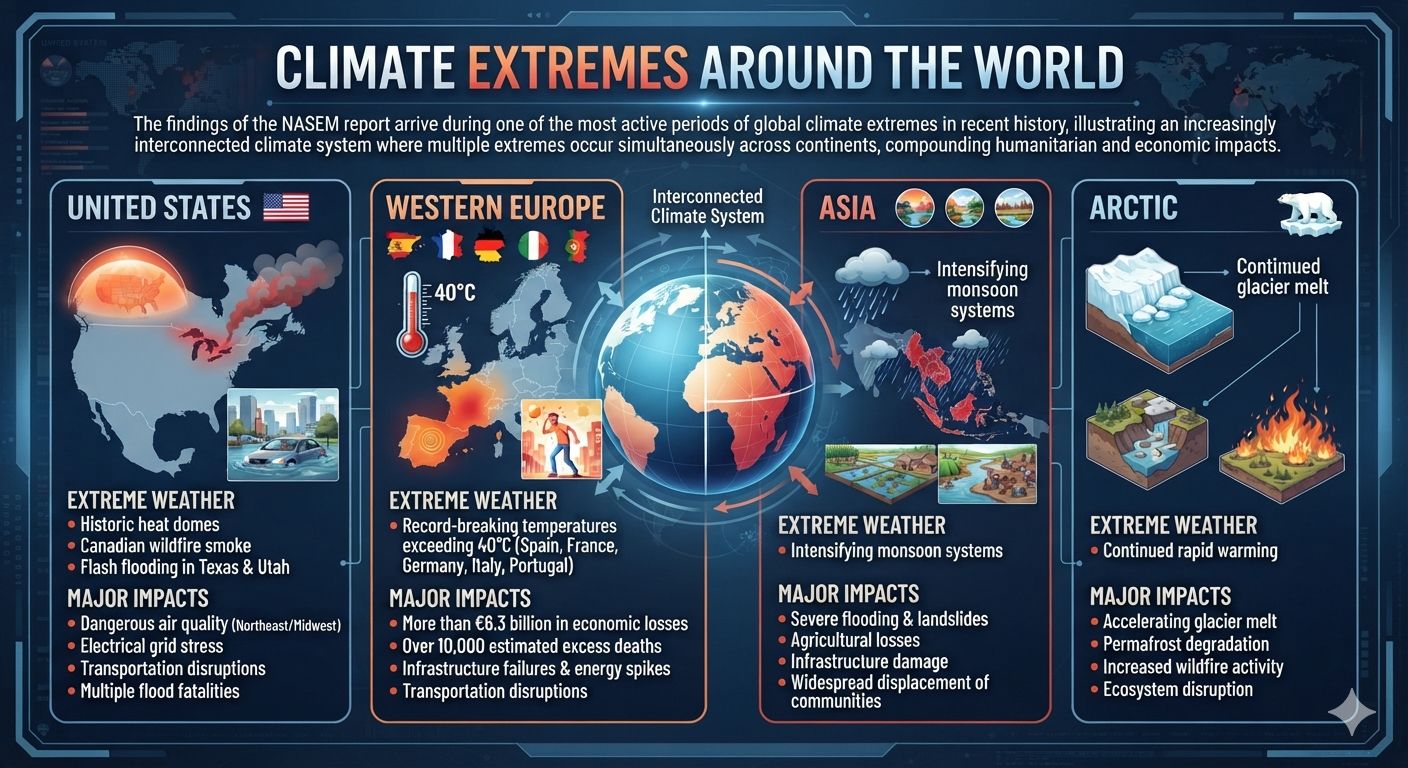
The most destructive climate disasters of 2026 reveal a rapidly changing pattern: extreme events are becoming more intense, more widespread, and increasingly interconnected.

From deadly heatwaves across Europe and South Asia to catastrophic flooding and severe storms across the United States, this year’s disasters demonstrate how human-caused warming is amplifying natural climate variability.

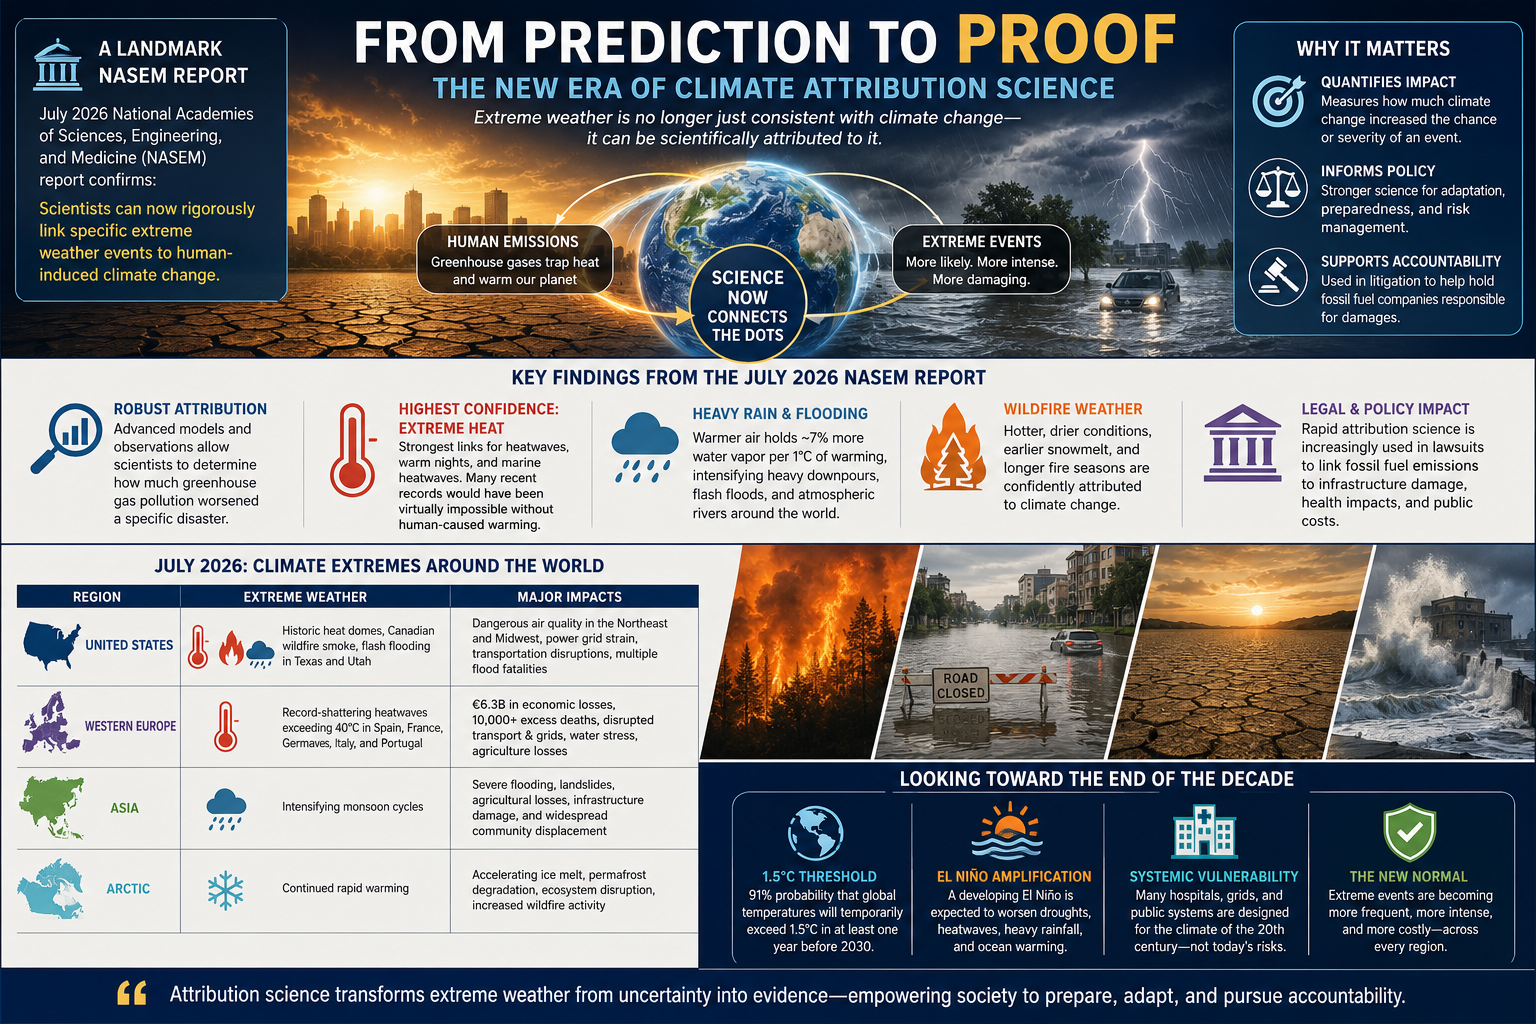
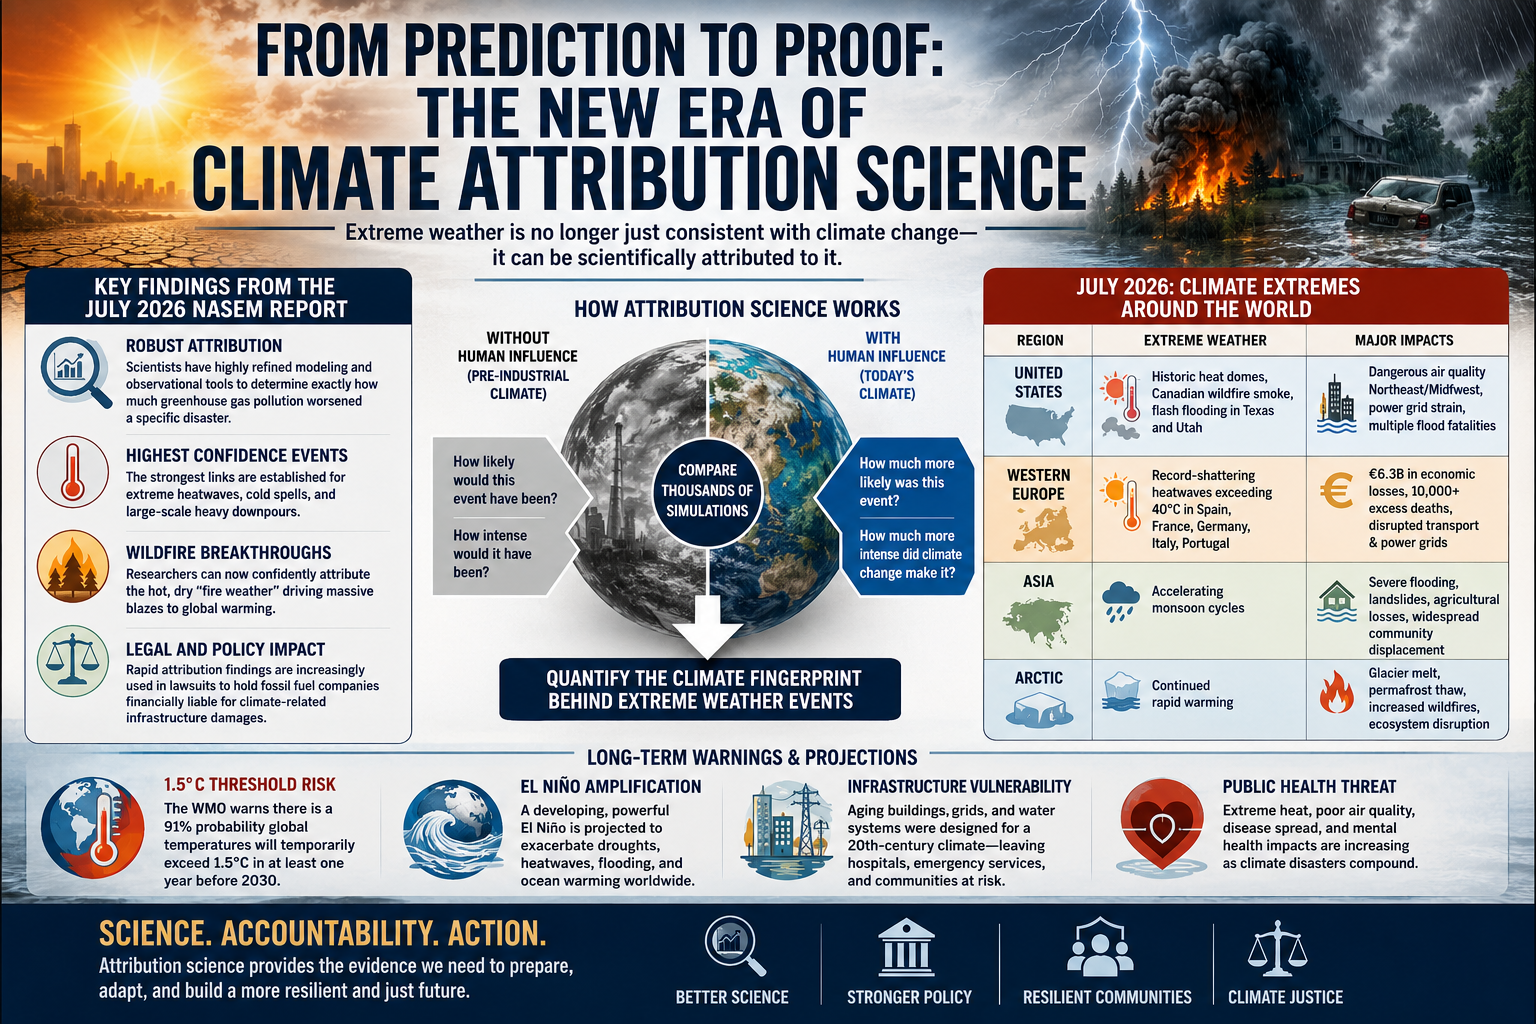
Scientific attribution studies from organizations such as World Weather Attribution (WWA) have repeatedly shown that greenhouse gas emissions are increasing the severity, duration, and likelihood of many modern climate extremes. Climate change is not replacing natural weather patterns—it is shifting the baseline conditions in which those patterns occur, turning historically rare events into recurring hazards.


1. Global Heatwaves and Heat Domes — The Deadliest Climate Hazard of 2026

Extreme heat has emerged as the defining climate disaster of the year, affecting billions of people across South Asia, Europe, the Middle East, and North America.

South Asia: Record-Breaking Pre-Monsoon Heat

India and Pakistan experienced a prolonged pre-monsoon heatwave, with temperatures repeatedly exceeding 46°C (115°F) in multiple cities.

The extreme heat disrupted agriculture, increased energy demand, threatened outdoor workers, and placed millions of vulnerable people at risk.

Climate Connection:
World Weather Attribution researchers concluded that human-caused warming significantly intensified the event, making such prolonged extreme heat far more likely than under historical climate conditions.


Europe: Over 10,000 Excess Deaths from Extreme Heat

Europe experienced one of the most severe heat disasters in modern history as persistent heatwaves pushed temperatures 5–12°C above average in some regions.

France, Spain, the United Kingdom, and other European nations experienced record-breaking temperatures, widespread drought stress, increased wildfire danger, and severe impacts on public health.

The heat contributed to more than 10,000 excess deaths, with older adults and people with underlying health vulnerabilities experiencing the greatest risks.

These deaths highlight the growing recognition that extreme heat is one of the deadliest consequences of climate change, often exceeding the immediate fatalities associated with storms and floods.

Climate Connection:
Attribution studies have concluded that human-caused climate change substantially increased the intensity and probability of these European heat extremes by raising the global temperature baseline.


The Hajj Heat Disaster: Climate Risks in a Warmer World

In Mecca, Saudi Arabia, extreme heat during the Hajj pilgrimage created dangerous conditions for millions of participants.

The combination of intense solar exposure, high humidity, and prolonged outdoor activity pushed temperatures beyond historically safe thresholds, producing hundreds of heat-related illnesses and significant loss of life.

Climate Connection:
Fossil fuel emissions have expanded the duration and severity of dangerous heat conditions in the region, increasing risks for large outdoor gatherings.


2. The Emerging Super El Niño: A Climate Amplifier

The extreme weather of 2026 is occurring alongside a strengthening El Niño event in the tropical Pacific.

El Niño is a natural climate cycle that periodically transfers large amounts of ocean heat into the atmosphere. However, it is now occurring on top of record global ocean temperatures driven by greenhouse gas emissions.

This creates a climate multiplier effect, increasing the likelihood of:

  • Record-breaking temperatures
  • Extreme rainfall events
  • Flash flooding
  • Agricultural disruption
  • Expanding drought conditions

The interaction between natural variability and human-caused warming is producing a more unstable and energetic climate system.


Major U.S. Climate Disasters of 2026

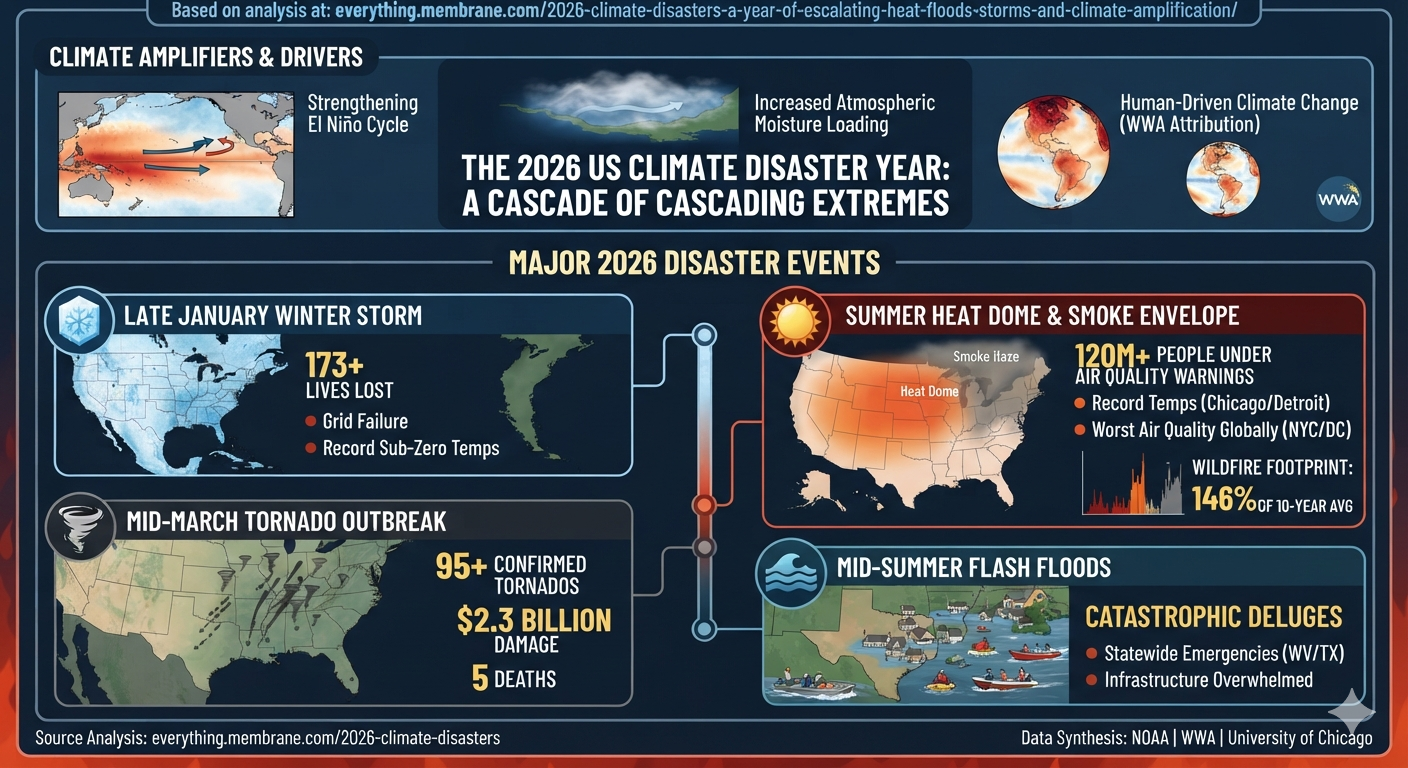
1. Summer Heat Dome and Wildfire Smoke Envelope — Largest Human Exposure

The most widespread U.S. climate disaster of the year was a massive heat dome combined with wildfire smoke spreading across the continent.

More than 120 million Americans from Minnesota to Massachusetts experienced heat alerts and hazardous air quality conditions.

Major metropolitan areas including Chicago, Detroit, New York, and Washington, D.C., experienced some of the worst air quality conditions in the world as smoke from Canadian wildfires moved southward.

Climate Connection:
Hotter and drier conditions have expanded wildfire activity, with North American wildfire acreage reaching approximately 146% of the 10-year average. Climate change is increasing the likelihood of persistent heat domes, drought conditions, and larger wildfire seasons.


2. January North American Winter Storm — Highest Early-Year Death Toll

A massive winter storm swept across the United States and Atlantic Canada, producing extreme cold, freezing temperatures, ice accumulation, and infrastructure failures.

The storm caused more than 173 deaths, making it one of the deadliest weather events of the year.

Climate Connection:
Although winter storms remain natural phenomena, warmer oceans and a warmer atmosphere allow storms to carry more moisture, increasing the potential for heavier precipitation, extreme snowfall, and more damaging freeze events.


3. Central and Southeastern Tornado Outbreak — Largest Severe Storm Damage

A three-day severe weather outbreak in March produced more than 95 confirmed tornadoes, causing approximately $2.3 billion in damage.

The storms moved from Illinois into Mississippi, Alabama, and Georgia, producing destructive tornadoes, damaging winds, and widespread infrastructure impacts.

Climate Connection:
A warmer atmosphere contains more heat and moisture, increasing atmospheric instability and creating conditions favorable for more intense severe thunderstorms.


4. Mid-Summer Flash Flood Disasters — The Fastest Escalating Threat

Extreme rainfall events produced catastrophic flash flooding across parts of Texas Hill Country, West Virginia, and the Ohio Valley.

Communities experienced emergency declarations, water rescues, landslides, infrastructure failures, and overwhelmed emergency systems.

Climate Connection:
Because the atmosphere holds approximately 7% more moisture for every 1°C of warming, climate change is increasing the potential for sudden, extreme rainfall events that overwhelm drainage systems and communities.


2026 Climate Disaster Overview

Disaster CategoryKey 2026 IndicatorMajor Impact Areas
Extreme HeatRecord-breaking heatwaves and >10,000 European excess deathsEurope, South Asia, Middle East, North America
Wildfires146% of 10-year average acreage burnedWestern U.S., Canada, Northeast smoke corridor
Severe Storms$2.3 billion tornado outbreakIllinois, Mississippi, Alabama, Georgia
Flash FloodingMultiple emergency declarationsTexas Hill Country, West Virginia, Ohio Valley
Winter Storms173+ fatalitiesUnited States and Atlantic Canada

A New Era of Compound Climate Disasters

The defining feature of 2026 is not simply that individual disasters are becoming stronger—it is that climate extremes are increasingly interacting.

Heat intensifies drought.
Drought fuels wildfires.
Wildfires spread smoke across continents.
Warmer oceans energize storms.
A warmer atmosphere produces heavier rainfall.

These cascading interactions represent a transition from isolated weather events to a more interconnected climate risk system.

The challenge of the coming decades will not only be adapting to a warmer planet, but managing a climate system where multiple extreme events increasingly occur together, amplify one another, and create cascading impacts across societies and ecosystems.

bookmark_borderFrom Linear Warming to Cascading Climate Dynamics: The Evolution Toward a Nonlinear Earth System Framework

By Daniel Brouse and Sidd Mukherjee

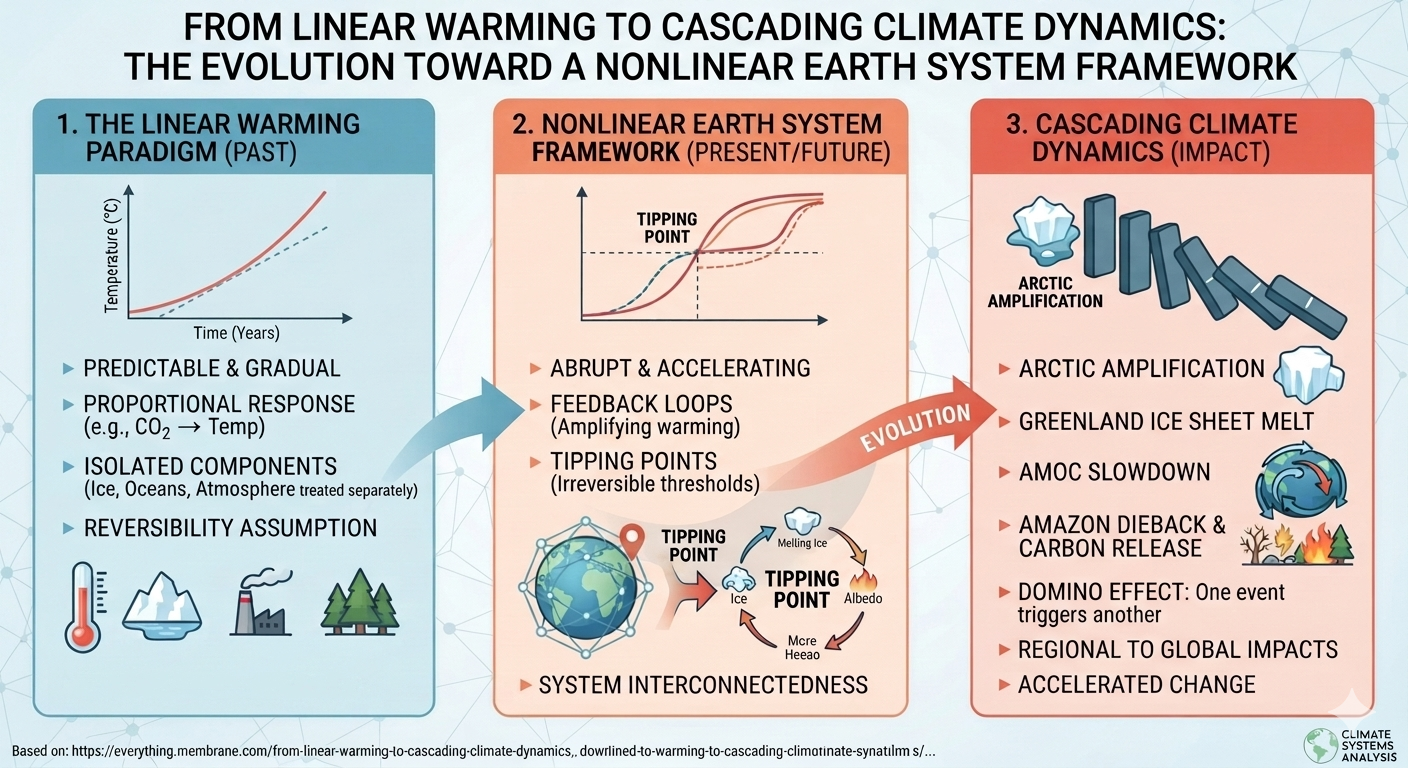
For decades, climate change has been communicated primarily through a relatively simple causal framework: increasing greenhouse gas concentrations drive global warming, which then increases the frequency, intensity, and duration of climate impacts. This linear model has been extraordinarily successful in explaining the fundamental physics of anthropogenic climate change.

However, Earth’s climate system is not a simple linear machine. It is a complex adaptive system composed of interacting components—including the atmosphere, oceans, cryosphere, biosphere, and human systems—that continuously exchange energy, matter, and information. As these interactions strengthen, the climate system can exhibit behaviors that cannot be fully explained by examining individual components in isolation.

In the 1990s, together with laboratory partner Sidd Mukherjee, we began developing the Nonlinear Acceleration Hypothesis (NAH), a framework proposing that climate change evolves through increasingly interconnected feedback networks. The hypothesis suggests that as climate subsystems become more tightly coupled, disturbances can propagate across multiple pathways, accelerating the rate of environmental change and increasing the probability of compound and cascading climate events.

At the center of this framework is the concept of the Domino Effect, or Cascading Climate Dynamics. In this view, climate-driven events are not isolated occurrences but interacting processes in which one disturbance alters the conditions that influence subsequent events.

For example:

Rising temperatures → increased atmospheric moisture → stronger precipitation extremes → flooding → ecosystem disruption → economic impacts → societal stress

Similarly:

Arctic warming → permafrost thaw → greenhouse gas release → additional warming → further ice loss

These cascading interactions create reinforcing feedback loops that can reshape the trajectory of the entire Earth system.

Climate State-Space: Mapping Earth’s Changing Trajectory

The concept of climate state-space modeling provides a mathematical framework for understanding these complex transitions. Rather than describing climate change through a single variable such as global average temperature, state-space analysis represents the Earth system as a multidimensional landscape containing interacting variables such as:

  • Ocean heat content
  • Sea level rise
  • Atmospheric water vapor
  • Marine heatwaves
  • Ice-sheet stability
  • Ecosystem resilience
  • Extreme weather frequency

Each combination of these variables represents a possible climate state. As greenhouse forcing increases and feedback mechanisms intensify, Earth does not simply become warmer—it migrates through climate state-space toward increasingly unfamiliar regions characterized by new combinations of environmental conditions.

This perspective explains why modern climate extremes are increasingly difficult to categorize using historical experience alone. The challenge is not only that individual variables are changing, but that the relationships among variables are also evolving.

Extreme Event Attribution: The Missing Link Supporting a Nonlinear Climate Framework

For many years, climate science was able to establish the broad relationship between rising greenhouse gas concentrations and a warming planet, but scientists faced a significant challenge: determining the extent to which human-caused climate change contributed to specific individual extreme events.

That limitation has now been substantially reduced. Recent advances in extreme event attribution science, including the landmark work summarized by the National Academies of Sciences, Engineering, and Medicine (NASEM), have demonstrated that researchers can rigorously evaluate the human contribution to individual climate extremes, including heatwaves, heavy precipitation events, droughts, and other high-impact phenomena.

This scientific advancement represents more than an improvement in attribution methods—it provides critical observational support for the transition from a linear climate model toward a nonlinear Earth system framework.

The ability to attribute individual events to anthropogenic forcing confirms that climate change is not merely a gradual shift in global averages. Human influence is now detectable within specific components of the climate system and within the extreme events that emerge from their interactions.

This directly aligns with the central premise of the Nonlinear Acceleration Hypothesis (NAH): that climate change increasingly operates through interconnected feedback networks where individual disturbances can amplify, propagate, and interact across multiple Earth system components.

The scientific question is therefore evolving from:

“Is human activity causing climate change and increasing extreme events?”

to:

“How do human-driven changes alter the probability, intensity, timing, and interaction of cascading climate events across the Earth system?”

NASEM’s validation of extreme event attribution establishes an important foundation for this next phase of climate science. If human influence can now be detected within individual extreme events, then the logical next step is understanding how these events connect through feedback loops and contribute to broader system-level transitions.

The emerging scientific picture is of a coupled planetary system in which the atmosphere, oceans, cryosphere, biosphere, and human societies are not independent components but interacting elements of a dynamic network.

The future of climate research must therefore expand beyond measuring warming alone and toward understanding climate system acceleration, state-space migration, and cascading dynamics.

Climate change is not simply a rise in temperature.

It is an accelerating transformation of the Earth system driven by increasingly interconnected feedbacks.

Understanding this transformation requires new mathematical frameworks, new modeling approaches, and a deeper understanding of the nonlinear interactions that determine planetary stability.

bookmark_borderClimate State Space, Nonlinear Acceleration, and Cascading Climate Dynamics

by Daniel Brouse

A State-Space Framework for Understanding Earth’s Emerging Climate Regime

Public Access Edition


Executive Summary

For most of modern climate science, climate change has been described as a relatively linear process:

Increasing greenhouse gases → Rising global temperatures → Increasing climate impacts

This framework has been highly successful in explaining the fundamental direction of human-caused climate change.

However, Earth’s climate system is not a simple linear machine. It is a complex, interconnected system containing feedback loops, thresholds, delays, and interacting subsystems. As warming increases, these connections become increasingly important.

The Climate State-Space Framework and the Nonlinear Acceleration Hypothesis is an emerging climate regime best understood not as a smooth progression along a predictable path, but as a dynamic transition through a changing landscape of interacting climate states.

The central idea is:

Climate change is not only increasing the magnitude of individual impacts; it is altering the structure and behavior of the Earth system itself.

As feedback loops strengthen and become more tightly connected, climate impacts can accelerate, interact, and cascade.


1. From Linear Climate Change to Dynamic Climate Evolution

The traditional climate model can be represented as:

Increasing greenhouse gases → Rising temperature → Increasing impacts

This relationship describes the primary chain of climate forcing:

Carbon dioxide increases
→ Global temperature rises
→ Ice melts
→ Sea levels rise
→ Extreme events intensify

This relationship remains fundamental.

However, Earth’s climate system contains additional processes that modify this pathway:

Melting ice
→ Reduced planetary reflectivity
→ Increased solar absorption
→ Additional warming

Warmer oceans
→ Increased heat storage
→ Changes in circulation patterns

Increasing atmospheric moisture
→ Stronger storms and extreme precipitation

Permafrost thaw
→ Additional greenhouse gas release

Ecosystem stress
→ Reduced carbon absorption capacity

These processes create interconnected feedback networks.

A more complete representation becomes:

Climate forcing → System response → Feedback amplification → Accelerating system response

The difference is fundamental.

The first model describes a response.

The second describes an evolving system.


2. Climate as a State Space

In physics and mathematics, a system’s state space represents all possible conditions that the system can occupy.

A simple example is a ball resting in a landscape:

Stable valley → Energy input → Movement across boundary → New stable valley

Each valley represents a possible stable state.

Once enough energy is added to push the system beyond a threshold, it can transition into a different state.

Earth’s climate behaves in a similar way.

Historically, the climate system has occupied relatively stable states:

Ice age conditions
→ Interglacial conditions
→ Regional climate equilibria

Human activity is now pushing the Earth system through climate state space toward a warmer operating regime.

The critical question is no longer only:

“How much warmer will Earth become?”

The deeper question is:

“What type of climate state is Earth moving into?”


3. The Climate State-Space Migration Concept

The Climate State-Space Framework describes Earth’s movement through three broad stages.


Stage 1: Stable Climate Basin

Characteristics:

  • Strong natural stabilizing feedbacks
  • Predictable seasonal patterns
  • Ecosystems adapted to historical conditions
  • Slow climate variability

The system remains near an equilibrium.

Stable climate state → Small disturbances → Rapid recovery


Stage 2: Transitional Instability Zone

Characteristics:

  • Increasing warming
  • Stronger feedback interactions
  • More frequent extreme events
  • Reduced ecosystem resilience

The climate system begins moving outside its historical operating range.

Examples:

Accelerating ice loss
→ Rising sea levels

Ocean heat accumulation
→ Marine ecosystem stress

Increasing atmospheric moisture
→ More intense storms

Expanding wildfire conditions
→ Ecosystem disruption


Stage 3: Emerging Climate Regime

Characteristics:

  • Multiple feedback loops interact
  • Extreme events compound
  • Regional systems destabilize
  • Tipping cascades become possible

The system is no longer simply changing.

It is reorganizing.


4. The Nonlinear Acceleration Hypothesis

The Nonlinear Acceleration Hypothesis proposes:

The rate of climate impacts can increase as warming strengthens interactions among climate feedback mechanisms.

A linear system behaves as:

Impact = Initial change + Constant rate of change

A nonlinear system behaves as:

Impact = Initial change + Increasing rate of change

The difference is acceleration.

Examples of nonlinear behavior include:


Ice-Albedo Feedback

Ice reflects sunlight.

When ice disappears:

Ice loss
→ Darker surfaces exposed
→ Increased solar absorption
→ Additional warming
→ Further ice loss


Atmospheric Moisture Feedback

A warmer atmosphere can hold more water vapor.

The cycle becomes:

Warming
→ Increased atmospheric moisture
→ Stronger greenhouse effect
→ Additional warming
→ More atmospheric moisture

Because water vapor is itself a greenhouse gas, this creates amplification.


Permafrost Feedback

Frozen soils contain large stores of carbon.

The process becomes:

Permafrost thaw
→ Microbial decomposition
→ Carbon dioxide and methane release
→ Additional warming
→ More permafrost thaw


5. From Individual Feedbacks to Feedback Networks

The major shift in climate understanding comes from recognizing that feedbacks do not operate independently.

They form interconnected networks.

For example:

Warming
→ Ice loss
→ Sea level rise
→ Coastal ecosystem loss
→ Reduced carbon storage
→ Additional atmospheric carbon

At the same time:

Warming
→ Ocean heat increase
→ Marine ecosystem stress
→ Reduced carbon uptake
→ Additional atmospheric carbon

These pathways interact.

The climate system becomes a connected network rather than a collection of isolated problems.


6. Cascading Climate Dynamics

A tipping point does not necessarily represent one sudden catastrophic event.

Instead, tipping behavior can emerge through cascading interactions.


Ice Sheet Cascade

Greenland warming
→ Accelerated melting
→ Sea level rise
→ Ocean circulation changes
→ Regional climate disruption


Ocean Circulation Cascade

Ocean warming
→ Freshwater input from melting ice
→ Circulation disruption
→ Altered heat transport
→ Regional climate shifts


Ecosystem Cascade

Heat stress
→ Vegetation loss
→ Reduced carbon uptake
→ Increased atmospheric carbon
→ Additional warming

The concern is not only individual thresholds.

The concern is interacting thresholds.


7. Measuring Climate State-Space Movement

A state-space framework evaluates multiple climate indicators simultaneously.

Potential state variables include:

  • Ocean Heat Content
  • Sea Level Rise Rate
  • Marine Heatwave Frequency
  • Atmospheric Water Vapor
  • Ice Mass Loss
  • Extreme Precipitation
  • Carbon Sink Strength

Instead of asking:

“Is one climate indicator changing?”

The framework asks:

“Are multiple components of the Earth system moving together toward a new climate regime?”


8. Implications for Climate Risk Assessment

Traditional risk models often assume:

  • Stable relationships
  • Predictable trends
  • Independent hazards

A nonlinear systems approach recognizes:

  • Compounding events
  • Feedback amplification
  • Correlated failures
  • Rapid transitions

This changes climate risk assessment.

A flood, heatwave, wildfire, or drought should not always be evaluated separately.

Future risks may emerge from combinations:

Heat + drought + wildfire
→ Compound ecosystem stress

Storm + sea level rise + infrastructure failure
→ Increased societal disruption

Ocean warming + ecosystem collapse + food disruption
→ Regional instability


9. The Seven-Generation Perspective

The climate challenge is ultimately a long-term systems problem.

The consequences of decisions made today extend beyond one generation.

A seven-generation perspective asks:

“What climate state will our descendants inherit?”

The goal is not only reducing emissions.

It is maintaining a stable and resilient Earth system.

The greatest inheritance is not simply financial wealth.

It is preserving a planet capable of sustaining future generations.


Conclusion

The emerging climate challenge requires a transition in thinking.

Earth is not merely experiencing a gradual warming trend.

It is moving through a complex state-space landscape shaped by:

  • Interacting feedbacks
  • Nonlinear responses
  • Threshold behavior
  • Potential cascading transitions

The Climate State-Space Framework and Nonlinear Acceleration Hypothesis provide a systems perspective:

Climate impacts can accelerate.
Feedbacks can amplify one another.
Thresholds can interact.
The future climate regime depends on the trajectory chosen today.

Understanding climate change as a dynamic system does not eliminate uncertainty.

It reveals where the greatest uncertainties and risks actually exist.

The central question is no longer only:

“How much will Earth warm?”

The deeper question is:

“What climate state are we creating for the generations that follow?”

bookmark_borderClimate State Space, Nonlinear Acceleration, and Cascading Climate Dynamics

by Daniel Brouse

A State-Space Framework for Understanding Earth’s Emerging Climate Regime

Climate State Space → Nonlinear Acceleration Hypothesis → Domino Effect (Cascading Climate Dynamics) → Cascade Attribution → Climate State-Space Migration → Testable Predictions

Abstract

For decades, climate change has often been communicated through a relatively simple causal framework in which increasing greenhouse gas concentrations produce gradual warming that, in turn, increases the frequency and intensity of extreme weather. While this linear perspective accurately describes the primary direction of anthropogenic climate forcing, it does not fully capture the increasingly interconnected behavior now observed throughout the Earth system.

Recent advances in climate attribution science, culminating in the 2026 National Academies of Sciences, Engineering, and Medicine (NASEM) report on extreme event attribution, demonstrate that scientists can now rigorously quantify the influence of human-induced climate change on many individual weather extremes. More importantly, these advances reveal that the atmosphere, oceans, cryosphere, biosphere, and human systems interact through increasingly complex feedback networks rather than functioning as largely independent components.

This paper interprets these developments through the Nonlinear Acceleration Hypothesis (NAH), which proposes that the Earth’s climate is evolving as a complex adaptive system whose components become progressively more coupled over time. As feedback interactions strengthen, disturbances propagate through multiple interconnected pathways, accelerating the overall rate of climate change and increasing the likelihood of compound and cascading climate disasters.

Central to this framework is the concept of the Domino Effect, or Cascading Climate Dynamics, in which one climate-driven event systematically modifies the environmental conditions governing subsequent events. Rather than producing isolated disasters, cascading interactions generate reinforcing sequences of physical, ecological, economic, and societal impacts that collectively reshape the trajectory of the Earth system.

Within this context, climate state-space modeling provides a natural mathematical framework for describing how the climate evolves through a multidimensional landscape of interacting variables. As greenhouse forcing intensifies and feedbacks strengthen, the Earth system migrates into regions of state space characterized by increasingly novel combinations of extremes, making unprecedented compound events progressively more probable.

Together, these concepts extend traditional event attribution toward a systems-level understanding of climate behavior in which nonlinear feedback coupling, cascade attribution, and state-space migration become essential tools for anticipating the accelerating risks associated with anthropogenic climate change.


Introduction

One of the defining scientific challenges of the twenty-first century is no longer determining whether human activities are changing Earth’s climate, but understanding how the climate system itself is evolving in response to increasing anthropogenic forcing.

For much of modern climate science, global warming has been described using a largely linear conceptual model:

Increasing atmospheric greenhouse gases → Rising global temperatures → More frequent and intense extreme weather

This framework successfully captures the first-order relationship between anthropogenic greenhouse gas emissions and long-term warming. It has provided the scientific foundation for decades of climate modeling, impact assessments, and public communication. However, as observational records have expanded and computational methods have advanced, it has become increasingly apparent that this simplified representation understates the complexity of the Earth system.

Earth’s climate is not a collection of independent variables responding individually to external forcing. Instead, it functions as a tightly interconnected network in which the atmosphere, oceans, cryosphere, biosphere, hydrosphere, and human systems continually exchange energy, water, carbon, and momentum. Changes within one subsystem frequently modify the boundary conditions governing others, creating feedback loops that amplify or dampen subsequent responses. These interactions produce behavior characteristic of complex adaptive systems, including nonlinear responses, emergent properties, threshold behavior, and cascading dynamics.

The rapid maturation of extreme event attribution science represents a significant milestone in recognizing this complexity. The 2026 National Academies of Sciences, Engineering, and Medicine (NASEM) concluded that attribution methods have advanced sufficiently to rigorously quantify the influence of anthropogenic climate change on many individual weather extremes. Attribution science has evolved beyond asking whether climate change contributed to a specific event; it increasingly examines how changing background conditions alter the probability, intensity, and characteristics of interacting hazards.

Viewed collectively, these advances provide growing empirical support for the Nonlinear Acceleration Hypothesis (NAH).

The NAH proposes that anthropogenic climate change should not be viewed simply as a steadily increasing external forcing acting upon a passive climate system. Instead, increasing greenhouse gas concentrations progressively strengthen the coupling among Earth’s major subsystems, allowing disturbances to propagate more efficiently through expanding networks of positive feedbacks. The result is not merely larger climate impacts but an acceleration in the rate at which those impacts evolve.

This systems perspective naturally introduces the concept of cascading climate dynamics, referred to throughout this paper as the Domino Effect. Under this framework, climate disasters rarely occur as isolated events. Instead, one disturbance modifies environmental conditions in ways that increase the likelihood, magnitude, or persistence of subsequent disturbances. These cascading interactions generate reinforcing chains of physical, ecological, economic, and societal impacts whose combined effects often exceed the sum of their individual components.

Understanding these evolving relationships requires moving beyond traditional time-series analyses toward mathematical frameworks capable of representing multiple interacting variables simultaneously. Climate state-space modeling offers precisely such an approach by representing the Earth system as a dynamic trajectory through a multidimensional landscape defined by its internal state variables.

This paper argues that combining climate state-space analysis with the Nonlinear Acceleration Hypothesis provides a unified framework for understanding why climate impacts increasingly exhibit accelerating behavior, compound extremes, and cascading feedbacks. Modern attribution science supplies the observational evidence necessary to identify many of these interactions, while nonlinear systems theory provides the conceptual tools required to interpret them within the broader dynamics of Earth’s evolving climate.


Climate State Space

In climate science, climate state space refers to a mathematical framework that represents the Earth’s climate as a continuously evolving multidimensional system. Rather than describing individual climate variables independently, state-space modeling characterizes the climate by its complete internal state at any moment in time. Each dimension of this abstract mathematical space corresponds to a fundamental component of the Earth system, including variables such as global surface temperature, atmospheric greenhouse gas concentrations, ocean heat content, atmospheric water vapor, cryospheric ice volume, terrestrial carbon storage, and large-scale atmospheric circulation.

Instead of asking how one variable changes over time in isolation, state-space modeling asks how the entire climate system evolves through this multidimensional landscape.

This distinction is fundamental.

Traditional statistical analyses often examine individual climate indicators independently—for example, global temperature trends, sea-level rise, or precipitation extremes. Although these approaches remain valuable, they cannot fully represent the increasingly interconnected relationships among Earth’s major subsystems. State-space methods explicitly model these interactions by estimating the hidden internal state from multiple observations while accounting separately for natural climate variability and measurement uncertainty.

This framework bridges the gap between raw observational data and physics-based climate simulations. Rather than predicting isolated variables, state-space models estimate how the underlying climate state transitions through time under the combined influence of physical processes, internal variability, and anthropogenic forcing.

Modern climate science already employs state-space methodologies across numerous applications. Sequential Bayesian techniques, including Kalman filtering and related approaches, continually update estimates of Earth’s internal climate state as new observations become available. Similar frameworks support projections of Arctic sea ice, Greenland Ice Sheet evolution, ocean heat content, atmospheric circulation, and other components of the Earth system.

The significance of state-space modeling extends well beyond improved statistical forecasting.

Within the framework developed in this paper, climate state space provides the mathematical foundation for understanding nonlinear acceleration itself.

As greenhouse forcing increases, Earth’s trajectory through state space does not simply move farther along a linear path. Instead, strengthening feedback interactions continually reshape the geometry of the state space through which the climate evolves. Regions that were once rarely occupied become increasingly common, while previously stable climate regimes lose resilience and become more susceptible to abrupt transitions.

Consequently, the trajectory of the Earth system reflects not only increasing external forcing but also progressively stronger interactions among its internal components. The climate system evolves from behaving as a collection of loosely coupled subsystems toward functioning as an increasingly integrated network of interacting feedbacks.

From this perspective, nonlinear acceleration is not merely an increase in the magnitude of climate change. It represents an evolving transformation in the structure of the Earth system itself.

The following sections build upon this mathematical foundation by introducing the Nonlinear Acceleration Hypothesis, describing the Domino Effect of cascading climate dynamics, and showing how modern attribution science increasingly provides observational evidence for both.

The Nonlinear Acceleration Hypothesis

For much of the twentieth century, climate change was conceptualized as a predominantly linear process. Increasing atmospheric greenhouse gas concentrations were expected to produce proportionally increasing temperatures, which would then increase the frequency and intensity of extreme weather events. This framework successfully described the primary direction of anthropogenic climate forcing and remains fundamentally correct as a first-order approximation.

However, a growing body of observational evidence suggests that this linear perspective is no longer sufficient to explain the behavior of the modern Earth system.

Extreme weather events are becoming more frequent, more intense, and increasingly interconnected. Marine heatwaves influence atmospheric circulation. Ocean warming drives higher atmospheric water vapor concentrations. Persistent blocking patterns amplify heatwaves and droughts, which increase wildfire risk. Wildfires release carbon, alter land surface reflectivity, degrade vegetation, and reduce future carbon uptake. These changes reinforce additional warming, creating new conditions from which subsequent hazards emerge.

Rather than behaving as isolated processes, Earth’s major climate subsystems increasingly interact through expanding networks of positive and negative feedbacks.

The Nonlinear Acceleration Hypothesis (NAH) proposes that these interactions fundamentally alter how climate change evolves over time.

Instead of viewing anthropogenic climate change solely as an external forcing acting upon a passive climate system, the NAH views the Earth as a complex adaptive network whose internal coupling strength increases as warming progresses. Greenhouse gases initiate the disturbance, but the accelerating behavior arises primarily from the growing interactions among atmosphere, oceans, cryosphere, biosphere, hydrosphere, and human systems.

Within this framework, climate change is not simply becoming larger.

It is becoming increasingly interconnected.

From Linear Forcing to Network Dynamics

The traditional conceptual model may be represented as:

Increasing CO₂ → Higher Global Temperature → More Extreme Weather

This sequence accurately describes the overall direction of anthropogenic warming but implies that individual hazards respond largely independently.

The Earth system behaves differently.

Each major subsystem simultaneously exchanges energy, water, carbon, momentum, and biological resources with numerous others. Consequently, a change occurring within one component alters the environmental conditions governing many others.

A more representative systems diagram is:

Increasing CO₂ → Ocean Heat Accumulation → Enhanced Atmospheric Moisture → Altered Atmospheric Circulation → Persistent Blocking Patterns → Extreme Heat & Drought → Wildfire Expansion → Vegetation Loss → Carbon Release → Additional Warming ↺

Unlike the traditional linear model, this network contains multiple reinforcing pathways in which each process influences and amplifies the next. Ocean warming increases evaporation, while additional atmospheric water vapor strengthens the hydrologic cycle and intensifies climate extremes. Heatwaves increase wildfire potential, and wildfires reduce terrestrial carbon storage while releasing additional greenhouse gases, creating further warming. Each process modifies the boundary conditions that govern subsequent processes, causing the climate system to evolve through increasingly interconnected feedbacks. The result is a system whose behavior is shaped not by the independent response of individual variables, but by the dynamic interactions among its components. This transition—from isolated responses to interconnected feedback networks—is the defining characteristic of nonlinear acceleration.

Increasing Feedback Coupling

One of the defining properties of complex systems is that interactions among components become progressively more important than the components themselves.

Early in the industrial era, many climate subsystems could reasonably be analyzed independently. Ocean circulation, atmospheric dynamics, terrestrial ecosystems, glaciers, and the hydrologic cycle were often studied as largely separate domains because their interactions evolved relatively slowly. As anthropogenic warming intensifies, this assumption becomes increasingly inadequate. Higher temperatures strengthen evaporation, altering atmospheric moisture transport. Warmer oceans increase marine heatwave frequency, affecting fisheries, ecosystems, and atmospheric circulation. Melting ice sheets alter freshwater inputs that influence ocean circulation. Wildfires transform ecosystems, reduce carbon sequestration, and inject aerosols into the atmosphere.

Human responses—including land-use change, infrastructure adaptation, migration, and economic disruption—introduce additional feedbacks into the evolving system.

Consequently, the Earth system behaves less like a collection of independent subsystems and more like an integrated adaptive network whose components continuously modify one another.

Within the Nonlinear Acceleration Hypothesis, this increasing interaction is described as feedback coupling.

Feedback coupling refers to the strengthening exchange of energy, matter, and information among Earth’s major subsystems.

As coupling increases, disturbances propagate more rapidly through multiple pathways, producing increasingly complex and often unexpected system responses. The acceleration therefore arises not because greenhouse forcing itself suddenly increases, but because the climate system becomes progressively more efficient at transmitting and amplifying disturbances.

Modern Attribution Science as Supporting Evidence

Recent advances in climate attribution science provide an important observational foundation for the Nonlinear Acceleration Hypothesis. Modern attribution studies no longer examine only whether anthropogenic climate change contributed to individual weather events. Increasingly, they evaluate how climate change modifies the environmental conditions under which those events develop. This represents a significant conceptual shift.

Instead of asking,

“Did climate change contribute to this flood?”

researchers increasingly ask,

“How did anthropogenic warming alter the atmospheric and oceanic conditions that made this flood more likely or more intense?”

Answering this broader question requires integrating observations across multiple Earth-system components simultaneously.

Ocean temperatures, atmospheric water vapor, circulation patterns, soil moisture, vegetation, snow cover, and human land-use practices all become relevant components of a single interacting system.

Viewed collectively, these studies reveal an increasingly coupled Earth system. Individually, each attribution study may identify only one connection. Together, however, they reveal a growing network of interacting feedbacks whose collective behavior is consistent with the predictions of the Nonlinear Acceleration Hypothesis. The significance of the 2026 National Academies report therefore extends beyond validating individual attribution methods. It demonstrates that climate science has developed the observational tools necessary to identify, quantify, and eventually model many of the interconnected pathways through which nonlinear acceleration emerges.

Transition to Cascading Climate Dynamics

Increasing feedback coupling naturally produces another defining characteristic of complex adaptive systems: cascading interactions. As disturbances propagate through expanding networks of interactions, they rarely remain isolated. Instead, each event modifies the environmental conditions from which subsequent events emerge.

For example, a marine heatwave can influence atmospheric circulation patterns, which may contribute to persistent drought conditions. Drought then increases wildfire susceptibility, while wildfires alter ecosystems, carbon cycling, and regional climate feedbacks. When floods occur afterward, they may encounter burned, hydrophobic soils that dramatically increase runoff, erosion, and downstream impacts.

Each disturbance therefore becomes part of a larger, evolving sequence rather than an independent event. Within the Nonlinear Acceleration Hypothesis, this process is described as the Domino Effect, or Cascading Climate Dynamics.

Understanding these cascading interactions represents the next logical evolution of attribution science: moving beyond explaining individual extreme events toward understanding how interacting feedback networks collectively reshape the trajectory of Earth’s climate system.

The Domino Effect: Cascading Climate Dynamics

One of the most important predictions of the Nonlinear Acceleration Hypothesis (NAH) is that climate change increasingly manifests through cascading sequences of interconnected events rather than isolated extremes.

This behavior is described here as the Domino Effect, or Cascading Climate Dynamics.

The analogy is both intuitive and scientifically meaningful. Just as a single falling domino transfers momentum to the next, each climate-driven disturbance alters the environmental conditions under which subsequent disturbances develop. However, unlike a simple row of dominoes, Earth’s climate resembles an interconnected network in which each event can trigger multiple downstream pathways simultaneously. The result is not a single chain of consequences but a branching web of reinforcing interactions whose complexity increases as the Earth system becomes more tightly coupled.

Within the Nonlinear Acceleration Hypothesis, the Domino Effect provides the principal physical mechanism through which nonlinear acceleration emerges. It explains how local disturbances evolve into regional crises, how regional crises interact to produce global consequences, and why climate impacts increasingly exceed expectations derived from linear models.

Rather than viewing climate disasters as isolated events, cascading climate dynamics recognize that today’s disaster frequently becomes tomorrow’s initial condition.


From Feedbacks to Cascades

Climate scientists have long recognized the importance of feedback mechanisms in shaping Earth’s climate system. A feedback occurs when a change within one component of the Earth system influences the magnitude or direction of subsequent changes. Positive feedbacks amplify disturbances, while negative feedbacks act to reduce or counteract them.

The Nonlinear Acceleration Hypothesis extends this concept by emphasizing that individual feedbacks rarely operate in isolation. Instead, multiple feedback mechanisms interact simultaneously across the atmosphere, oceans, cryosphere, biosphere, hydrosphere, and human systems. As these interactions become increasingly coupled, they generate cascades—sequences in which one event systematically alters the probability, intensity, timing, or persistence of subsequent events.

Unlike traditional feedback diagrams that often depict a limited number of interactions before reaching an endpoint, cascading climate dynamics represent an evolving network of interconnected processes that continually reshape the background state of the climate system. Each disturbance modifies the initial conditions from which future disturbances emerge, creating a system in which the trajectory of change is increasingly determined by the interactions among its components rather than by individual variables acting alone.

Consequently, the Earth system exhibits characteristics commonly associated with complex adaptive systems, including:

  • nonlinear amplification,
  • threshold behavior,
  • path dependence,
  • emergent behavior,
  • cascading instability,
  • self-reinforcing network dynamics.

The cumulative effect is that climate impacts grow faster than would be expected from greenhouse forcing alone because each disturbance increasingly amplifies the conditions favorable for additional disturbances.


Cascading Dynamics Across the Earth System

The Domino Effect can be illustrated through numerous interacting pathways already documented within the Earth system.

One representative cascade begins with the oceans.

Increasing Greenhouse Gases → Ocean Heat Content → Higher Evaporation → Atmospheric Water Vapor → Extreme Rainfall → Flooding → Soil Saturation → Landslides → Vegetation Loss → Reduced Carbon Uptake → Additional Atmospheric CO₂ → Further Ocean Warming

No individual step within this sequence is novel. Each has been independently observed and extensively studied. The significance lies in their interaction.

Rather than operating independently, these processes collectively form a reinforcing network in which each stage modifies the likelihood of the next. The climate system therefore becomes progressively more efficient at transmitting disturbances through multiple interconnected pathways.

A second cascade illustrates interactions involving heat, drought, and wildfire.

Marine Heatwave → Persistent High Pressure → Extreme Heat → Drought Intensification → Forest Drying → Wildfire Expansion → Smoke Aerosols → Vegetation Loss → Carbon Release → Additional Warming ↺

Again, every stage alters the environmental conditions governing subsequent events. The wildfire is not the endpoint. It changes soil chemistry, hydrology, vegetation, atmospheric composition, and carbon cycling, creating new conditions from which future floods, droughts, ecosystem shifts, and climate extremes develop.

This continual restructuring of environmental conditions is the defining characteristic of cascading climate dynamics.


Cascades Extend Beyond the Physical Climate

Perhaps the most important implication of the Domino Effect is that cascading dynamics do not end with physical hazards.

Instead, they propagate through ecological, economic, and societal systems.

For example:

Extreme Rainfall → Infrastructure Failure → Transportation Disruption → Supply Chain Breakdown → Food Price Inflation → Economic Instability → Climate-Driven Migration → Political Tension → Reduced Adaptive Capacity → Increased Vulnerability → Greater Future Climate Losses ↺

The final outcome feeds directly back into the climate system itself.

Communities experiencing repeated disasters often possess fewer financial resources to rebuild resilient infrastructure, protect ecosystems, or invest in long-term adaptation measures. As resources are depleted by successive climate impacts, the ability of societies to prepare for future events declines. Reduced adaptive capacity therefore increases vulnerability to future climate extremes, creating another reinforcing feedback loop.

Within the Nonlinear Acceleration Hypothesis, human systems are not external forces acting upon the climate system; they are integral components of the evolving climate state space. Economic decisions influence land use, while land use changes influence carbon cycling and ecosystem stability. Political decisions shape emissions trajectories, and migration patterns alter regional resource demands, infrastructure pressures, and social resilience.

As climate impacts intensify and human responses become increasingly interconnected with environmental processes, the boundaries between ecological and societal systems become progressively difficult to distinguish. The climate system is not simply a physical process—it is a coupled human-environment system whose future trajectory emerges from the interactions among atmospheric, ecological, economic, and social dynamics.


Increasing Network Connectivity

One of the defining predictions of the Nonlinear Acceleration Hypothesis is that the Earth system should exhibit increasing network connectivity over time. As the number and strength of interactions among climate, ecological, and human systems grow, disturbances become increasingly capable of propagating across multiple domains and geographic regions.

Early in the industrial era, many climate-related disturbances remained relatively localized, with limited pathways for broader impacts. Today, global transportation networks, interconnected economies, highly coupled ecosystems, and increasingly synchronized atmospheric and oceanic processes allow disturbances to travel much farther and influence a wider range of systems.

For example, heatwaves can reduce agricultural production, agricultural losses can influence global commodity markets, and commodity disruptions can contribute to political instability. Political instability can then affect migration patterns, land management decisions, and future emissions trajectories. Each interaction creates additional pathways through which disturbances can propagate and amplify.

From a network perspective, every additional connection increases the number of possible cascading sequences within the system. As connectivity expands, the probability of compound events increases—even when the initial disturbance is relatively modest—because the system contains more pathways through which impacts can spread and interact.

Climate risk therefore grows nonlinearly because the number of potential interactions expands far more rapidly than the number of initiating events. This transition—from isolated hazards toward highly interconnected cascading networks—represents one of the central predictions of the Nonlinear Acceleration Hypothesis and reflects a fundamental shift in how climate dynamics must be understood.

Toward Cascade Attribution

Modern event attribution science has demonstrated remarkable success in determining how anthropogenic climate change influences the probability and intensity of individual weather extremes. The logical next step is to extend attribution beyond isolated events and toward cascading sequences of interacting hazards.

Traditional attribution asks:

“Did anthropogenic climate change contribute to this heatwave?”

Cascade attribution asks a broader systems question:

“What sequence of climate-driven processes created the environmental conditions that made this event possible?”

This shift represents more than a methodological refinement. It represents a conceptual evolution from analyzing isolated hazards to understanding the dynamics of an increasingly interconnected Earth system. Viewed through the lens of the Nonlinear Acceleration Hypothesis, attribution science becomes a tool not only for explaining past events but also for mapping the evolving network of feedbacks that governs the future trajectory of Earth’s climate.

The Domino Effect therefore serves as the bridge between nonlinear feedback coupling and climate state-space evolution. Individual feedbacks generate cascading dynamics; cascading dynamics reshape the climate state space; and state-space migration increases the likelihood of still more compound and interconnected extremes.

This progression transforms climate change from a collection of independent hazards into the behavior of a single, evolving, complex adaptive system whose accelerating dynamics increasingly define the environmental, economic, and societal risks of the twenty-first century.

From Event Attribution to Cascade Attribution

The emergence of modern extreme event attribution science represents one of the most significant advances in climate research during the past two decades. Once considered an emerging statistical discipline, attribution science has matured into a rigorous methodology capable of quantifying the influence of anthropogenic climate change on many classes of extreme weather events. Heatwaves, extreme precipitation, droughts, marine heatwaves, and some tropical cyclone characteristics can now be evaluated with increasing confidence using observational records, climate models, and probabilistic analyses.

The 2026 National Academies of Sciences, Engineering, and Medicine (NASEM) report recognizes this transformation as a major scientific milestone. Attribution has evolved beyond asking whether climate change influenced individual events; it increasingly evaluates how anthropogenic warming alters the environmental conditions under which those events develop. This broader perspective acknowledges that many climate disasters arise not from a single meteorological phenomenon but from the interaction of multiple Earth-system processes operating across different spatial and temporal scales.

Viewed through the lens of the Nonlinear Acceleration Hypothesis (NAH), this evolution represents more than a refinement of statistical methodology. It provides the observational foundation for understanding climate as an increasingly interconnected network of cascading processes.


The Evolution of Attribution Science

Historically, attribution studies focused on a single question:

Did anthropogenic climate change increase the probability or intensity of this event?

Researchers compared climate simulations representing the present climate with simulations representing a hypothetical climate absent significant human greenhouse gas emissions. Differences between these two scenarios allowed scientists to estimate how human activities altered the likelihood of a particular heatwave, flood, drought, or storm.

This approach fundamentally changed climate science by transforming attribution from qualitative judgment into quantitative probability. Yet it also carried an implicit assumption: that individual events could be analyzed largely in isolation. That assumption becomes increasingly difficult to maintain as the Earth system grows more interconnected.

Many disasters now emerge from interacting sequences of atmospheric, oceanic, ecological, hydrological, and societal processes that evolve over weeks, months, or even years before the final event occurs.

The question therefore changes. Instead of asking only,

Did climate change influence this flood?

climate science increasingly asks,

What evolving sequence of climate-driven processes created the conditions that made this flood possible?

This transition marks the beginning of Cascade Attribution.


Event Attribution Versus Cascade Attribution

Traditional event attribution evaluates individual hazards, while cascade attribution evaluates the interacting systems and processes that combine to produce complex outcomes. The distinction is subtle but profound.

Event attribution primarily focuses on the final observable event—the heatwave, flood, wildfire, or storm—and determines how human-caused climate change altered its likelihood, intensity, or characteristics. Cascade attribution expands this analysis by investigating the full sequence of interacting processes that contributed to the event, including the feedbacks and system responses that shaped its development.

For example, consider a catastrophic flood. Traditional attribution may determine that anthropogenic warming increased atmospheric moisture, making the extreme rainfall event substantially more likely and potentially more intense. Cascade attribution, however, examines the broader chain of interactions: ocean warming that increased evaporation, atmospheric conditions that concentrated rainfall, land-surface changes that altered runoff, ecosystem degradation that reduced resilience, and infrastructure vulnerabilities that amplified societal impacts.

The focus shifts from identifying a single climate signal behind an extreme event to understanding how multiple interacting processes combine to create cascading consequences across the Earth system and human systems.

Cascade attribution extends the analysis backward through time.

Ocean Heat Accumulation → Increased Evaporation → Enhanced Atmospheric Moisture → Persistent Atmospheric River Formation → Extreme Precipitation → Flooding

This sequence, however, still represents only part of the evolving cascade.

The flood itself initiates additional interactions.

Flooding → Infrastructure Failure → Economic Disruption → Population Displacement → Reduced Adaptive Capacity → Increased Future Climate Vulnerability ↺

The initiating event therefore becomes the starting condition for subsequent environmental and societal processes. Cascade attribution attempts to understand this entire evolving network rather than isolating one component. Within the Nonlinear Acceleration Hypothesis, these interacting pathways collectively represent the physical expression of increasing feedback coupling.


Cascades Reveal Hidden System Structure

One of the greatest strengths of attribution science is its ability to reveal causal relationships that would otherwise remain hidden within the complexity of the Earth system.

Viewed individually, attribution studies may appear to address unrelated questions:

  • How much more likely was a marine heatwave?
  • How did climate change influence wildfire behavior?
  • What role did warming play in an extreme rainfall event?

Collectively, however, these studies reveal something much larger. They identify connections. Marine heatwaves influence atmospheric circulation. Atmospheric circulation influences blocking patterns. Blocking patterns influence drought. Drought influences wildfire. Wildfire alters vegetation, hydrology, carbon cycling, and atmospheric composition.

Each attribution study illuminates one segment of a much larger interaction network. As the number of attribution studies grows, scientists progressively map the architecture of Earth’s evolving climate system. This network perspective aligns directly with the Nonlinear Acceleration Hypothesis.

Acceleration does not arise because any single process becomes dramatically stronger. It arises because the number and strength of interactions among processes continually increase.


Quantifying Cascading Dynamics

One of the major scientific opportunities emerging from attribution science is the possibility of quantifying cascading climate dynamics directly.

Rather than treating each attribution study independently, researchers can evaluate how disturbances propagate through multiple Earth-system components.

Future attribution analyses may estimate:

  • how strongly one hazard increases the probability of another,
  • how rapidly disturbances propagate between subsystems,
  • which feedback loops produce the greatest amplification,
  • where thresholds or tipping behavior emerge,
  • how network connectivity evolves through time.

These measurements would allow scientists to move beyond describing individual disasters toward characterizing the evolving behavior of the climate system itself.

Within the Nonlinear Acceleration Hypothesis, these observations become measurable indicators of increasing feedback coupling.


Cascade Attribution and Climate State Space

Cascade attribution also provides a natural bridge to climate state-space analysis by recognizing that every observed cascade alters the internal state of the Earth system. Rather than viewing extreme events as isolated occurrences, this framework examines how each disturbance modifies the conditions that shape future system behavior.

A wildfire, for example, alters vegetation structure and ecosystem function. Changes in vegetation influence carbon exchange between the biosphere and atmosphere, which affects atmospheric composition and radiative forcing. Changes in radiative forcing alter ocean heat content, and changes in ocean heat content influence atmospheric circulation patterns. Each interaction shifts the position of the Earth system within its multidimensional state space.

Under this framework, attribution no longer focuses solely on explaining individual weather events. Instead, it documents the trajectory of an evolving complex adaptive system whose future behavior emerges from the interactions among multiple coupled components.

As cascading interactions accumulate, the Earth system gradually migrates toward regions of state space characterized by stronger feedbacks, greater instability, and increasingly novel combinations of environmental conditions. Understanding these state-space transitions represents the next frontier of climate science—moving from attribution of individual events toward analysis of how the entire climate system evolves over time.

A New Scientific Paradigm

Cascade attribution provides a natural bridge to climate state-space analysis by recognizing that every observed cascade alters the internal state of the Earth system. Rather than treating extreme events as isolated occurrences, this framework examines how each disturbance modifies the underlying conditions that influence future system behavior.

A wildfire, for example, does not simply represent a discrete event. It alters vegetation structure, ecosystem function, and regional carbon dynamics. Changes in vegetation modify carbon exchange between the biosphere and atmosphere, influencing atmospheric composition and radiative forcing. Changes in radiative forcing affect ocean heat content, while variations in ocean heat content influence atmospheric circulation patterns. Each interaction shifts the position of the Earth system within its multidimensional state space.

Within this framework, attribution science extends beyond explaining individual weather events. It becomes an analysis of the trajectory of an evolving complex adaptive system, where future behavior emerges from the interactions among multiple coupled components across the climate system.

As cascading interactions accumulate, the Earth system progressively migrates toward new regions of state space characterized by stronger feedback coupling, greater instability, and increasingly novel combinations of environmental conditions. Understanding these state-space transitions represents the next frontier of climate science: moving beyond attribution of individual extremes toward understanding the evolving trajectory of the entire Earth system.

Climate State-Space Migration

The concepts developed throughout this paper converge on a single unifying principle: the Earth’s climate is continuously migrating through an evolving multidimensional state space whose structure is itself changing over time.

This perspective extends traditional climate science beyond describing trends in individual variables toward understanding how the entire Earth system evolves as an interconnected dynamical network.

Within the framework of the Nonlinear Acceleration Hypothesis (NAH), climate state-space migration is the mathematical expression of increasing feedback coupling and cascading climate dynamics. Every interaction among the atmosphere, oceans, cryosphere, biosphere, hydrosphere, and human systems alters the position of the Earth system within state space. As these interactions strengthen, the climate follows increasingly nonlinear trajectories into regions characterized by greater instability, stronger feedbacks, and previously unprecedented combinations of environmental conditions.


From Climate Trends to Climate Trajectories

Traditional climate analyses often describe how individual variables change over time.

For example:

  • Global average temperature rises.
  • Sea level rises.
  • Atmospheric water vapor increases.
  • Ocean heat content increases.
  • Marine heatwaves become more frequent.

Each of these observations is important. However, none fully describes the behavior of the Earth system.

State-space analysis instead asks a broader question:

Where is the climate system moving?

Rather than examining individual variables independently, climate state space treats each observation as one coordinate within a multidimensional system.

The climate at any moment can therefore be represented as a single point whose coordinates include quantities such as:

  • Atmospheric greenhouse gas concentrations
  • Ocean heat content
  • Atmospheric water vapor
  • Global mean temperature
  • Ice-sheet mass
  • Sea level
  • Soil moisture
  • Carbon storage
  • Ocean circulation
  • Atmospheric circulation
  • Ecosystem productivity

As each variable changes, the Earth system traces a trajectory through this multidimensional landscape.

The trajectory—not any individual variable—becomes the fundamental object of study.


A Dynamic State Space

Classical state-space models often assume that the underlying geometry of the state space remains relatively stable, with the system evolving through a fixed landscape of possible states. The Nonlinear Acceleration Hypothesis proposes a more profound possibility: that the geometry of the state space itself evolves over time.

As greenhouse forcing increases, interactions among Earth’s major subsystems become progressively stronger. Feedback coupling reshapes the stability landscape by altering the relationships among atmospheric, oceanic, cryospheric, biospheric, and human systems. Regions that once represented relatively stable climatic conditions can become increasingly unstable, while new regions emerge in which compound extremes and cascading interactions become more probable.

Under this framework, the Earth system is not simply moving through a pre-existing state space. Instead, it is evolving through a state space whose structure, boundaries, and stability characteristics are continually changing as interactions intensify.

This distinction is fundamental. The challenge is no longer only predicting where the climate system will move within a fixed landscape of possible states. It is understanding how the landscape itself is being transformed—and how those transformations influence the future trajectory of the Earth system.

Emergence of New Climate Regimes

One consequence of state-space migration is the increasing appearance of climatic conditions that have little historical precedent.

Modern observations increasingly document combinations of extremes that were once considered statistically improbable.

Examples include:

  • simultaneous marine heatwaves across multiple ocean basins,
  • persistent atmospheric blocking patterns,
  • widespread wildfire smoke interacting with heatwaves,
  • concurrent drought and extreme precipitation in neighboring regions,
  • compound coastal flooding from sea-level rise and extreme rainfall,
  • repeated record-breaking temperatures occurring in successive years.

Individually, none of these phenomena necessarily represents a new physical process. Collectively, however, they indicate that the Earth system increasingly occupies regions of state space characterized by combinations of conditions that were previously rare or effectively absent. The emergence of these compound extremes is therefore not merely evidence of stronger climate forcing. It is evidence that the underlying probability landscape governing Earth’s climate has changed.


Cascading Dynamics Drive State-Space Migration

The Domino Effect described in the previous section provides the mechanism responsible for this migration.

Every cascade modifies the internal state of the Earth system.

For example,

Ocean Heat Accumulation → Enhanced Evaporation → Increased Atmospheric Moisture → Extreme Precipitation → Flooding → Ecosystem Damage → Reduced Terrestrial Carbon Storage → Additional Atmospheric CO₂ → Further Ocean Warming ↺

Each stage changes one or more coordinates within climate state space. Because thousands of such cascades occur simultaneously across the globe, the trajectory of the Earth system becomes increasingly complex. The climate therefore evolves through the combined influence of countless interacting pathways rather than any single forcing mechanism. State-space migration is the cumulative result of these interacting cascades.


Feedback Coupling and Tipping Behavior

Complex adaptive systems frequently exhibit threshold behavior. As interactions among components strengthen, the system may reach points at which relatively small perturbations produce disproportionately large responses.

Within climate science, these thresholds are commonly described as tipping points.

Examples include major changes in:

  • ice-sheet stability,
  • ocean circulation,
  • permafrost carbon release,
  • forest ecosystem resilience,
  • coral reef survival,
  • large-scale atmospheric circulation.

While each tipping element has often been studied independently, the Nonlinear Acceleration Hypothesis emphasizes that tipping processes themselves increasingly interact. One tipping process modifies the environmental conditions governing others. Consequently, the likelihood of cascading transitions grows as the Earth system migrates deeper into strongly coupled regions of state space. The concern is therefore not merely the crossing of individual tipping points. It is the emergence of tipping cascades in which multiple thresholds interact through reinforcing feedback networks.


Measuring Climate State-Space Migration

One of the greatest scientific opportunities emerging from modern attribution science is the possibility of measuring state-space migration directly.

Future research may quantify changes in:

  • feedback coupling strength,
  • cascade frequency,
  • network connectivity,
  • propagation speed of disturbances,
  • resilience of major Earth-system components,
  • rates of transition between climate regimes.

These metrics would complement traditional indicators such as temperature and sea-level rise by directly characterizing the evolving dynamics of the Earth system.

Instead of asking only,

“How warm is the planet?”

future climate science may increasingly ask,

“How rapidly is the Earth system reorganizing?”

This shift mirrors similar transitions that have occurred in ecology, neuroscience, economics, and network science, where understanding system interactions has become as important as measuring the individual components.


Implications for Climate Prediction

Climate prediction has traditionally focused on forecasting individual variables such as temperature, precipitation, or sea level.

The Nonlinear Acceleration Hypothesis suggests that forecasting should increasingly emphasize system behavior.

Future predictive frameworks may estimate:

  • where cascading sequences are most likely to emerge,
  • which feedback loops are becoming dominant,
  • how rapidly coupling strength is increasing,
  • where compound extremes are likely to occur,
  • when resilience may be approaching critical thresholds.

Such forecasts would move beyond predicting isolated hazards toward anticipating the evolution of the Earth system itself.

Rather than treating floods, droughts, wildfires, heatwaves, and ecosystem collapse as independent phenomena, they would be understood as interconnected manifestations of a single evolving climate trajectory.


Toward a Unified Framework

The concepts developed throughout this paper naturally integrate into a unified systems framework for understanding Earth’s evolving climate dynamics.

Climate state space provides the mathematical representation of Earth’s changing internal condition, describing how the combined state of atmospheric, oceanic, cryospheric, biospheric, and human systems evolves over time. The Nonlinear Acceleration Hypothesis explains why interactions among these subsystems can become progressively stronger as feedback coupling increases.

The Domino Effect describes how these strengthened interactions propagate through cascading sequences across environmental, ecological, economic, and societal domains. Cascade Attribution provides the observational methodology for identifying, tracing, and quantifying these interconnected processes, moving beyond individual event analysis toward the examination of linked system responses. Climate State-Space Migration describes the cumulative consequence of these processes acting together, as the Earth system moves through an evolving landscape of changing stability and feedback relationships.

Together, these concepts suggest that climate science is entering a new phase. Rather than viewing climate change as a collection of increasingly severe but largely independent hazards, emerging evidence supports understanding the Earth as a complex adaptive system undergoing progressive reorganization.

The defining challenge for climate science in the coming decades will therefore extend beyond measuring continued warming. It will require understanding how accelerating interactions among Earth’s major subsystems reshape the trajectory of the entire planetary system.

This systems perspective represents the central implication of the Nonlinear Acceleration Hypothesis: climate change is not simply increasing in magnitude—it is evolving in complexity, connectivity, and rate of change as the Earth system migrates into a fundamentally new dynamic regime.

Discussion and Conclusions

The scientific understanding of anthropogenic climate change has undergone a profound evolution over the past half century. Early research established that increasing atmospheric greenhouse gas concentrations warm the planet by altering Earth’s radiative balance. Subsequent work demonstrated that warming influences the frequency and intensity of many classes of extreme weather. More recently, advances in attribution science have enabled researchers to rigorously quantify the contribution of anthropogenic climate change to individual extreme events.

This progression represents far more than an accumulation of observational evidence. It reflects a fundamental shift in how scientists conceptualize the Earth system itself.

The central argument developed throughout this paper is that climate change should no longer be viewed solely as a linear response to increasing greenhouse gas forcing. Instead, the available evidence increasingly supports viewing the Earth as a complex adaptive system whose components become progressively more interconnected through expanding networks of feedbacks.

Within this framework, the Nonlinear Acceleration Hypothesis (NAH) provides a unifying systems perspective that integrates climate physics, Earth-system science, attribution science, network theory, and nonlinear dynamics into a single conceptual framework.

Rather than interpreting climate change as a gradual accumulation of independent environmental impacts, the NAH proposes that the interactions among those impacts increasingly become the dominant drivers of future climate behavior.


A New Systems Perspective

Five complementary concepts form the foundation of this framework.

Climate State Space provides the mathematical representation of Earth’s evolving internal condition.

The Nonlinear Acceleration Hypothesis proposes that increasing greenhouse forcing strengthens the coupling among Earth’s major subsystems, allowing disturbances to propagate more efficiently through expanding feedback networks.

The Domino Effect, or Cascading Climate Dynamics, describes the physical mechanism through which one disturbance systematically alters the environmental conditions governing subsequent disturbances.

Cascade Attribution extends modern event attribution by examining entire sequences of interacting hazards rather than isolated weather events.

Finally, Climate State-Space Migration describes the cumulative consequence of these interacting processes as the Earth system moves toward increasingly novel climatic regimes.

Together these concepts describe climate change not as a collection of isolated environmental problems, but as the evolving behavior of a single interconnected Earth system.


Testable Predictions of the Nonlinear Acceleration Hypothesis

Like any scientific hypothesis, the Nonlinear Acceleration Hypothesis should be evaluated through observations that are capable of supporting or falsifying its predictions.

The hypothesis makes several testable predictions.

Prediction 1: Increasing Feedback Coupling

Interactions among the atmosphere, oceans, cryosphere, biosphere, hydrosphere, and human systems should become progressively stronger over time.

Future observational analyses should detect increasing statistical dependence among major Earth-system variables.


Prediction 2: More Frequent Cascading Events

Compound disasters involving multiple interacting hazards should become increasingly common.

Rather than isolated floods, droughts, or heatwaves, future climate impacts should increasingly involve evolving sequences of interconnected events.


Prediction 3: Expanding Network Connectivity

Climate attribution studies should identify an increasing number of measurable interactions linking previously independent Earth-system processes.

The architecture of Earth’s climate network should become progressively more interconnected.


Prediction 4: Increasing State-Space Migration

The trajectory of the Earth system should increasingly occupy regions characterized by combinations of climate variables that have little historical precedent.

Compound extremes should become progressively more probable.


Prediction 5: Emergent System Behavior

Climate impacts should increasingly display characteristics associated with complex adaptive systems, including nonlinear amplification, threshold behavior, cascading instability, hysteresis, and emergent organization.

Collectively, these predictions provide multiple opportunities for future observational testing.

The strength of the hypothesis ultimately depends on whether these predicted system behaviors continue to emerge across independent datasets.


Research Priorities

The framework presented here also suggests several important directions for future climate research.

First, climate science should increasingly emphasize network analysis alongside traditional statistical methods. Quantifying interactions among Earth-system components may prove as important as measuring changes in the individual components themselves.

Second, attribution science should continue expanding from isolated event attribution toward cascade attribution, enabling researchers to understand how disturbances propagate through interconnected environmental and societal systems.

Third, state-space methodologies should incorporate evolving feedback coupling and network connectivity as dynamic variables rather than treating them as fixed characteristics of the climate system.

Fourth, observational programs should develop new indicators capable of monitoring changes in Earth-system resilience, interaction strength, and rates of state-space migration.

Finally, integrating climate science with complexity science, nonlinear dynamics, systems engineering, ecology, economics, and network theory may provide a more comprehensive understanding of accelerating climate risks than any discipline can achieve independently.


Broader Implications

The implications of this framework extend beyond academic climate science.

If the Earth system is becoming progressively more interconnected, then adaptation strategies must likewise become more integrated.

Managing floods independently of drought, or wildfire independently of ecosystem health, may underestimate the interactions that increasingly govern climate risk.

Infrastructure planning, agriculture, water management, biodiversity conservation, public health, energy systems, insurance, financial markets, and national security all become components of a larger adaptive network.

Improving resilience therefore requires strengthening the resilience of the entire system rather than optimizing individual sectors in isolation.

The systems perspective presented here reinforces an important lesson common to many complex adaptive systems:

The greatest risks often emerge not from individual failures, but from interactions among multiple failures occurring simultaneously.


The Emerging Scientific Frontier

The history of climate science has largely progressed through three major phases.

The first phase established the physical foundation of anthropogenic global warming by demonstrating the relationship between greenhouse gas emissions, radiative forcing, and changes in Earth’s climate system. The second phase focused on quantifying the consequences of warming, including impacts on weather extremes, ecosystems, and human societies. The third phase—now emerging—centers increasingly on understanding the interactions that connect these impacts across the Earth system.

This transition reflects broader developments occurring across many scientific disciplines. Ecology has moved beyond studying individual species toward understanding interconnected ecosystems and the networks that govern their behavior. Neuroscience has increasingly shifted from examining isolated neurons toward analyzing complex neural networks. Economics has expanded from studying individual markets toward understanding interconnected financial systems and global economic dynamics.

In the same way, climate science is evolving from describing changes in individual variables toward understanding the behavior of an increasingly interconnected planetary system. The central question is no longer only how much a single component is changing, but how interactions among multiple components influence the trajectory of the entire Earth system.

Viewed from this perspective, modern attribution science represents more than an improvement in statistical methodology. It provides the observational foundation for mapping the evolving architecture of Earth’s climate network—revealing not only the causes of individual events, but also the increasingly complex pathways through which climate change propagates across the planet.

Conclusion

The Earth’s climate is not merely warming.

It is reorganizing.

As greenhouse gas concentrations continue to rise, interactions among the atmosphere, oceans, cryosphere, biosphere, hydrosphere, and human systems become progressively more coupled. These interactions generate reinforcing feedbacks that propagate through cascading sequences of environmental, ecological, economic, and societal processes, fundamentally altering the trajectory of the Earth system.

The Nonlinear Acceleration Hypothesis offers a unified framework for understanding this transition.

By integrating Climate State Space, feedback coupling, the Domino Effect (Cascading Climate Dynamics), Cascade Attribution, and Climate State-Space Migration, the hypothesis provides a coherent explanation for why climate risks increasingly appear to evolve faster than expected under traditional linear assumptions.

Importantly, this framework is not presented as a replacement for established climate science but as a systems-level extension of it. The rapid maturation of attribution science demonstrates that researchers can now identify and quantify many of the interactions connecting Earth’s major subsystems. As these observations accumulate, they provide an unprecedented opportunity to evaluate whether the climate system is exhibiting the increasing feedback coupling, cascading dynamics, and state-space migration predicted by the Nonlinear Acceleration Hypothesis.

If these predictions continue to be supported by independent observations, climate science may be entering a new era—one in which the central challenge is no longer simply measuring the rate of global warming, but understanding how an increasingly interconnected Earth system reorganizes itself under sustained anthropogenic forcing.

The defining scientific question of the coming decades may therefore become not whether climate change is accelerating, but how the dynamics of an evolving planetary network govern the speed, structure, and consequences of that acceleration.
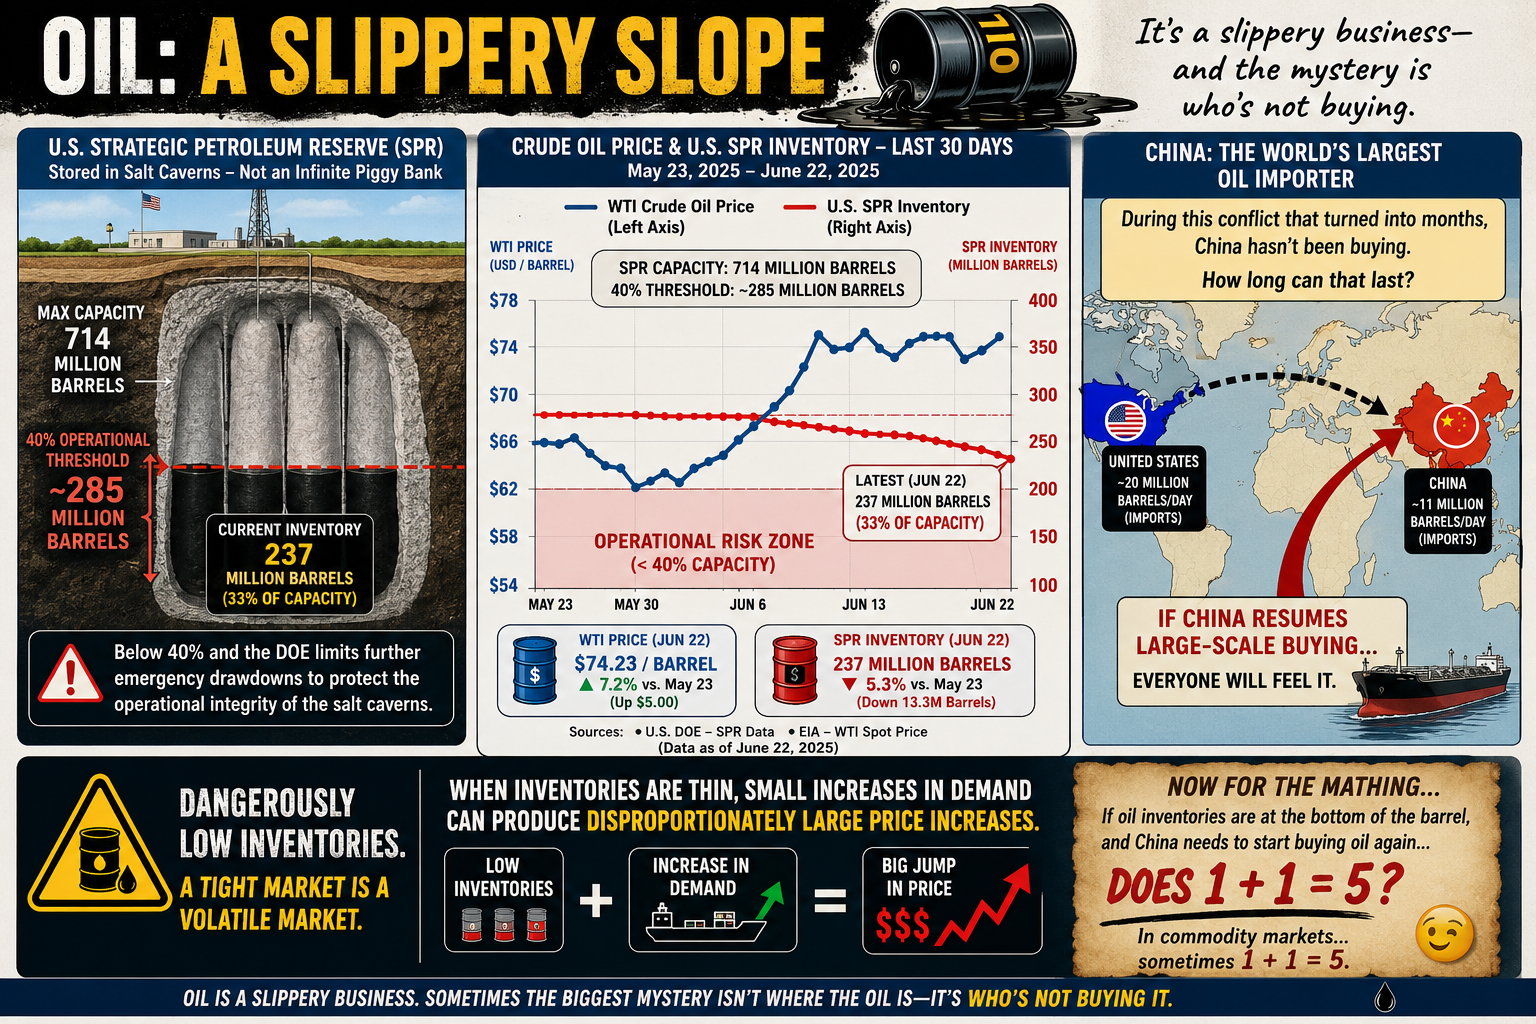
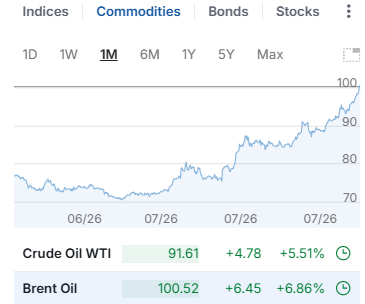
bookmark_borderFrom Event Attribution to Cascade Attribution: Nonlinear Climate Dynamics and Feedback Coupling

by Daniel Brouse

Abstract

The 2026 National Academies of Sciences, Engineering, and Medicine (NASEM) report on extreme event attribution marks a significant milestone in climate science. It demonstrates that researchers can now rigorously quantify how human-induced climate change has altered the probability and intensity of many individual extreme weather events. While the report focuses on attribution of discrete events, its findings also suggest broader implications for understanding the climate system as a complex, interconnected network. This paper examines those implications through the lens of a nonlinear systems framework, arguing that attribution science is evolving from identifying isolated events toward understanding cascading feedbacks, increasing Earth-system coupling, and migration of the climate system into new dynamic states.


From Linear Forcing to Nonlinear Response

For decades, climate change was often communicated through a relatively simple causal chain:

More atmospheric CO₂ → Higher global temperatures → More frequent extreme weather

Although this framework captures the primary direction of anthropogenic warming, it understates the complexity of the Earth’s climate system.

The NASEM report emphasizes that anthropogenic climate change modifies the environmental conditions under which extreme weather develops, changing both the probability and intensity of many hazardous events. This represents an important conceptual shift. Climate change is no longer viewed merely as adding energy to the atmosphere; it is increasingly recognized as altering the conditions that govern how multiple Earth-system processes interact.

From the perspective of nonlinear climate dynamics, warming changes not only the magnitude of individual hazards but also the state space through which the climate system evolves.

Rather than a simple progression,

CO₂
 ↓
Temperature
 ↓
Extreme Events

the emerging network of interactions more closely resembles:

CO₂
 ↓
Ocean Heat
 ↓
Atmospheric Water Vapor
 ↓
Jet Stream Changes
 ↓
Blocking Patterns
 ↓
Marine Heatwaves
 ↓
Wildfires
 ↓
Smoke Aerosols
 ↓
Vegetation Loss
 ↓
Carbon Release
 ↓
Additional Warming

Each component influences multiple others, producing nonlinear responses that amplify or dampen subsequent changes. Importantly, many of these individual pathways can now be independently observed and quantified. Attribution science has matured sufficiently to isolate numerous links within these interconnected chains, providing an empirical foundation for broader systems-level analyses.


Increasing Feedback Coupling Across the Earth System

One of the defining characteristics of complex systems is that interactions between components become increasingly important as the system evolves.

Historically, climate variables such as the atmosphere, oceans, cryosphere, biosphere, and hydrological cycle were often studied as largely independent subsystems. Contemporary climate science increasingly recognizes that these components respond simultaneously and influence one another through multiple feedback mechanisms.

The NASEM report reflects this evolution by emphasizing that attribution frequently requires integrating observations from multiple Earth-system components rather than examining individual hazards in isolation. This growing recognition of interconnected processes aligns closely with the concept of feedback coupling.

A representative sequence illustrates this interaction:

Warmer Oceans
        ↓
Greater Evaporation
        ↓
Higher Atmospheric Water Vapor
        ↓
More Intense Rainfall
        ↓
Soil Saturation
        ↓
Landslides
        ↓
Vegetation Loss
        ↓
Reduced Carbon Uptake
        ↓
Additional Warming

Each stage strengthens the environmental conditions that enable subsequent stages.

In systems terminology, the effective coupling among climate subsystems increases over time. Rather than operating as loosely connected components, the Earth system increasingly behaves as an integrated network in which disturbances propagate through multiple interacting pathways.

Quantifying these evolving coupling relationships represents an important direction for future climate research.


From Event Attribution to Cascade Attribution

Perhaps the most significant implication of modern attribution science is that it enables researchers to move beyond isolated events toward understanding cascading climate impacts.

Traditional attribution studies ask questions such as:

“Did anthropogenic climate change increase the probability or intensity of this flood?”

A systems-based framework asks a broader question:

“What sequence of prior climate-driven events created the conditions that made this flood possible?”

These questions address different levels of system behavior.

The NASEM report increasingly recognizes compound and cascading events, noting that many impacts arise from interacting hazards rather than isolated extremes.

A typical cascade may unfold as:

Heat Wave
      ↓
Forest Drying
      ↓
Wildfire
      ↓
Hydrophobic Soils
      ↓
Flash Flooding
      ↓
Infrastructure Failure
      ↓
Economic Disruption
      ↓
Migration
      ↓
Political Instability

Each event modifies the initial conditions under which subsequent events occur.

This perspective suggests a natural evolution of attribution science—from Event Attribution, which evaluates individual hazards, toward Cascade Attribution, which seeks to understand how multiple climate-driven events interact across environmental, economic, and social systems.

Rather than viewing disasters as isolated phenomena, cascade attribution recognizes that many impacts emerge from sequential interactions among interconnected feedback processes.


Climate State Space Migration

Another implication of recent attribution science is that extreme events can no longer be viewed solely as statistical outliers within a stationary climate.

Instead, the baseline climate itself is changing.

Within a nonlinear systems framework, this change can be interpreted as migration through climate state space. As greenhouse forcing increases and Earth-system feedbacks intensify, the climate system occupies regions characterized by combinations of conditions that were previously rare or effectively absent.

Consequently, compound events become increasingly probable, including simultaneous occurrences such as:

  • Marine heatwaves
  • Atmospheric rivers
  • Persistent blocking highs
  • Extensive wildfire smoke
  • Accelerated glacier loss
  • Compound coastal and inland flooding

These combinations arise because the underlying probability landscape governing climate behavior is evolving.

While the NASEM report does not explicitly frame these changes in terms of state-space dynamics, its conclusions are consistent with the observation that anthropogenic climate change alters the likelihood, intensity, and characteristics of extreme events. A nonlinear interpretation extends this concept by suggesting that the climate system is transitioning into new dynamic regimes in which unprecedented combinations of hazards become increasingly likely.


Conclusion

The National Academies report represents a major scientific milestone by demonstrating that extreme event attribution has matured into a rigorous and quantitative discipline capable of identifying the influence of human-induced climate change on many individual weather extremes.

Viewed through the lens of nonlinear systems theory, however, the report also points toward a broader scientific frontier. The evidence increasingly supports viewing Earth’s climate as a dynamically coupled network in which interactions among the atmosphere, oceans, cryosphere, biosphere, and human systems become progressively more interconnected.

This perspective suggests several natural extensions of attribution science. First, researchers can expand from attributing isolated events to analyzing cascading sequences of interacting hazards. Second, increasing feedback coupling among Earth-system components may provide measurable indicators of emerging nonlinear behavior. Finally, the migration of the climate system through state space offers a conceptual framework for understanding why compound extremes are becoming more common and why previously unprecedented combinations of events are now emerging.

Together, these ideas outline a research agenda that extends beyond traditional event attribution toward a more comprehensive understanding of climate as a complex adaptive system. As attribution science continues to mature, integrating nonlinear dynamics, feedback coupling, and cascade analysis may become essential for anticipating the evolving risks associated with anthropogenic climate change.

bookmark_borderFrom Prediction to Proof: The New Era of Climate Attribution Science

by Daniel Brouse

Extreme Weather Is No Longer Just Consistent with Climate Change—It Can Be Scientifically Attributed to It

A landmark 2026 report from the U.S. National Academies of Sciences, Engineering, and Medicine (NASEM) marks a major milestone in climate science. For decades, scientists could say that climate change made extreme weather more likely. Today, the evidence has become substantially stronger: modern attribution science can now determine, with high confidence, how much human-caused climate change increased the probability or severity of many individual extreme weather events.

This represents a profound shift in both science and public policy. Extreme weather is no longer viewed simply as a consequence of natural variability occurring alongside a warming climate. For many classes of events—including record-breaking heatwaves and extreme precipitation—scientists can now quantify the role that greenhouse gas emissions played in producing the disaster.

As climate disasters accelerate across the globe, attribution science is transforming what was once considered “unusual weather” into measurable evidence of a rapidly changing climate system.


A New Scientific Milestone

The July 2026 NASEM report concludes that advances in climate models, observational datasets, satellite measurements, and statistical methods have made attribution science sufficiently mature to evaluate many individual weather disasters with remarkable precision.

Rather than asking whether climate change “caused” a storm, researchers now ask more scientifically meaningful questions:

  • How much more likely was this event because of global warming?
  • How much more intense did climate change make the event?
  • What fraction of the resulting damages can reasonably be attributed to human-caused greenhouse gas emissions?

These questions can now be answered with increasing confidence.


Major Findings of the NASEM Report

Robust Event Attribution

Scientists now possess sophisticated observational records and climate simulations capable of comparing today’s atmosphere with a hypothetical pre-industrial climate.

By running thousands of simulations under both conditions, researchers can estimate how human emissions altered the probability and intensity of an event.

This allows attribution studies to quantify the “climate fingerprint” behind individual disasters.


Highest Confidence: Extreme Heat

The strongest scientific confidence exists for:

  • prolonged heatwaves
  • record high temperatures
  • warm nighttime temperatures
  • marine heatwaves

Heat events are among the easiest climate signals to detect because rising greenhouse gases directly increase global temperatures.

Many recent record heatwaves would have been virtually impossible without human-caused warming.


Heavy Rainfall and Flooding

Warmer air holds approximately 7% more water vapor for every 1°C of warming, following the Clausius-Clapeyron relationship.

This additional atmospheric moisture increases the likelihood of:

  • intense rainfall
  • flash flooding
  • atmospheric river events
  • tropical cyclone rainfall

The report concludes that heavy precipitation events now have strong attribution confidence across much of the world.


Wildfire Weather

Although individual wildfires depend upon ignition sources, vegetation, and local weather, researchers can now confidently attribute the hot, dry conditions that create extreme fire weather to climate change.

These include:

  • prolonged drought
  • record temperatures
  • low humidity
  • earlier snowmelt
  • longer fire seasons

Climate change may not ignite every fire, but it increasingly creates the environmental conditions that allow fires to spread rapidly and become catastrophic.


Growing Legal Significance

One of the most important implications of attribution science extends beyond meteorology.

Rapid attribution studies are increasingly being introduced into court proceedings involving:

  • infrastructure damage
  • insurance losses
  • municipal adaptation costs
  • public health impacts
  • fossil fuel liability

As attribution methods become more rigorous, courts may increasingly rely upon quantitative estimates linking greenhouse gas emissions to specific economic damages.

This development could significantly reshape climate litigation over the coming decades.


July 2026: Climate Extremes Around the World

The findings of the NASEM report arrive during one of the most active periods of global climate extremes in recent history.

RegionExtreme WeatherMajor Impacts
United StatesHistoric heat domes, Canadian wildfire smoke, flash flooding in Texas and UtahDangerous air quality across the Northeast and Midwest, electrical grid stress, transportation disruptions, multiple flood fatalities
Western EuropeRecord-breaking temperatures exceeding 40°C across Spain, France, Germany, Italy, and PortugalMore than €6.3 billion in economic losses, over 10,000 estimated excess deaths, infrastructure failures, transportation disruptions, and energy demand spikes
AsiaIntensifying monsoon systemsSevere flooding, landslides, agricultural losses, infrastructure damage, and widespread displacement of communities
ArcticContinued rapid warmingAccelerating glacier melt, permafrost degradation, increased wildfire activity, and ecosystem disruption

These events illustrate an increasingly interconnected climate system in which multiple extremes occur simultaneously across continents, compounding humanitarian and economic impacts.


Looking Toward the End of the Decade

Several independent climate assessments indicate that the world is approaching critical thresholds.

Temporary Exceedance of 1.5°C

The World Meteorological Organization estimates there is approximately a 91% probability that at least one year before 2030 will temporarily exceed 1.5°C above pre-industrial temperatures.

While a single year above 1.5°C does not constitute failure of the Paris Agreement, it demonstrates how rapidly the climate system is approaching thresholds originally expected later in the century.


Developing El Niño

Climate forecasters expect a strengthening El Niño to amplify many existing climate risks, including:

  • more intense global heat
  • severe drought in some regions
  • stronger rainfall elsewhere
  • increased marine heatwaves
  • coral bleaching
  • agricultural disruption

Natural climate variability is increasingly occurring on top of a warmer baseline climate, producing more severe impacts than similar events decades ago.


Infrastructure Built for Yesterday’s Climate

Many public health experts warn that modern infrastructure remains designed around the climate of the twentieth century rather than the rapidly changing conditions of the twenty-first.

Areas of growing concern include:

  • aging electrical grids
  • transportation infrastructure
  • hospitals and emergency care systems
  • water management systems
  • cooling capacity in residential buildings
  • urban heat island effects

As extreme events become more frequent and compound one another, these systems face increasing risks of cascading failures.


The Emerging “New Normal”

The significance of the 2026 NASEM report extends far beyond advances in climate modeling. It reflects a fundamental evolution in how society understands weather disasters.

Scientists are no longer limited to saying that climate change may have influenced an event. Increasingly, they can quantify the extent to which greenhouse gas emissions altered the probability, intensity, and resulting impacts of specific disasters.

This capability strengthens scientific understanding, informs emergency planning, improves risk assessment, supports more resilient infrastructure design, and provides a stronger evidentiary foundation for public policy and legal accountability.

The growing field of event attribution represents a turning point in climate science. As observational records expand and modeling techniques continue to improve, attribution studies will become an increasingly important tool for understanding not only whether climate change is influencing extreme weather, but how much it is contributing to the escalating risks facing societies around the world.

In an era of accelerating climate change, the question is no longer whether human activity is affecting the weather. Increasingly, the scientific challenge is measuring—with ever greater precision—the extent of that influence and using that knowledge to better prepare for the future.