bookmark_borderThe Costs of Solar Energy

A lot of the environmental costs of solar depend on how the panels and batteries are produced, transported and disposed of… and most importantly how the energy is stored. As renewable energy grows, storage will become a greater problem. In general, we would be better off producing energy like the sun (fusion) than trying to capture the sun’s energy. http://news.stanford.edu/…/store-electric-grid-030513.html

The fossil fuel required to build grid-scale batteries…
  • Fusion does not produce any toxic waste, either — http://news.yahoo.com/solar-industry-grapples-hazardous…

    SAN FRANCISCO (AP) — Homeowners on the hunt…
    news.yahoo.com|By JASON DEAREN
  • One of my main concerns with solar is the cost to the environment if they are not put on already existing impervious surfaces. Solar panel farms have many negative impacts on plants and wildlife, not to mention, robbing the Earth’s surface of the energy being harvested by the panels.

Other than fusion, the only other method to create clean energy has to do with solar and turning water into electricity — The Economics of Turning Water into Electricity.

bookmark_borderHeading Toward Hottest Year On Record

The The National Oceanic and Atmospheric Administration (NOAA) released a report showing “Global temperature reaches record high in September”.

Global Highlights

  • The combined average temperature over global land and ocean surfaces for September 2014 was the highest on record for September, at 0.72°C (1.30°F) above the 20th century average of 15.0°C (59.0°F).
  • The global land surface temperature was 0.89°C (1.60°F) above the 20th century average of 12.0°C (53.6°F), the sixth highest for September on record. For the ocean, the September global sea surface temperature was 0.66°C (1.19°F) above the 20th century average of 16.2°C (61.1°F), the highest on record for September and also the highest on record for any month.
  • The combined global land and ocean average surface temperature for the January–September period (year-to-date) was 0.68°C (1.22°F) above the 20th century average of 14.1°C (57.5°F), tying with 1998 as the warmest such period on record.

bookmark_borderNuclear Fusion

Nuclear fusion offers the most hope at rectifying human induced climate change. Nuclear fusion is how the sun works.

In a press release, Lockheed Martin states a breakthrough:

The Lockheed Martin [NYSE: LMT] Skunk Works® team is working on a new compact fusion reactor (CFR) that can be developed and deployed in as little as ten years. Currently, there are several patents pending that cover their approach.

While fusion itself is not new, the Skunk Works has built on more than 60 years of fusion research and investment to develop an approach that offers a significant reduction in size compared to mainstream efforts.

“Our compact fusion concept combines several alternative magnetic confinement approaches, taking the best parts of each, and offers a 90 percent size reduction over previous concepts,” said Tom McGuire, compact fusion lead for the Skunk Works’ Revolutionary Technology Programs. “The smaller size will allow us to design, build and test the CFR in less than a year.”

After completing several of these design-build-test cycles, the team anticipates being able to produce a prototype in five years. As they gain confidence and progress technically with each experiment, they will also be searching for partners to help further the technology.

Headquartered in Bethesda, Maryland, Lockheed Martin is a global security and aerospace company that employs approximately 113,000 people worldwide and is principally engaged in the research, design, development, manufacture, integration and sustainment of advanced technology systems, products and services. The Corporation’s net sales for 2013 were $45.4 billion.

“We can make a big difference on the energy front,” lead researcher McGuire said, noting Lockheed’s 60 years of research on nuclear fusion as a potential energy source that is safer and more efficient than current reactors based on nuclear fission.

Nuclear Fusion
Nuclear Fusion

bookmark_borderColorado River Running Dry

NASA reports:

A new study by scientists from NASA and the University of California, Irvine, has found that over 75 percent of the water loss in the drought-stricken Colorado River Basin since late 2004 came from underground resources. The extent of groundwater loss may pose a greater threat to the water supply of the western United States than previously thought.

This study is the first to quantify the amount that groundwater contributes to the water needs of western states. According to the U.S. Bureau of Reclamation, the federal water management agency, the basin has been suffering from prolonged, severe drought since 2000 and has experienced the driest 14-year period in the last hundred years.

The research team used data from NASA’s Gravity Recovery and Climate Experiment (GRACE) satellite mission to track changes in the mass of the Colorado River Basin, which are related to changes in water amount on and below the surface. Monthly measurements in the change in water mass from December 2004 to November 2013 revealed the basin lost nearly 53 million acre feet (65 cubic kilometers) of freshwater. That’s almost double the volume of the nation’s largest reservoir, Nevada’s Lake Mead. More than three-quarters of the total — about 41 million acre feet (50 cubic kilometers) — was from groundwater.

“We don’t know exactly how much groundwater we have left, so we don’t know when we’re going to run out,” said Stephanie Castle, a water resources specialist at the University of California, Irvine, and the study’s lead author. “This is a lot of water to lose. We thought that the picture could be pretty bad, but this was shocking.”

Scale in the sky
Water above ground in the basin’s rivers and lakes is managed by the U.S. Bureau of Reclamation, and its losses are documented. Pumping from underground aquifers is regulated by individual states and is often not well documented.

“There’s only one way to put together a very large-area study like this, and that is with satellites,” said senior author Jay Famiglietti, senior water cycle scientist at JPL on leave from the University of California, Irvine, where he is an Earth-system science professor. “There’s just not enough information available from well data to put together a consistent, basin-wide picture.”

Famiglietti said GRACE is like having a giant scale in the sky. Within a given region, the change in mass due to rising or falling water reserves influences the strength of the local gravitational attraction. By periodically measuring gravity regionally, GRACE reveals how much a region’s water storage changes over time.

The Colorado River is the only major river in the southwest part of the United States. Its basin supplies water to about 40 million people in seven states, and irrigates roughly four million acres of farmland.

Water lifeline
“The Colorado River Basin is the water lifeline of the western United States,” said Famiglietti. “With Lake Mead at its lowest level ever, we wanted to explore whether the basin, like most other regions around the world, was relying on groundwater to make up for the limited surface-water supply. We found a surprisingly high and long-term reliance on groundwater to bridge the gap between supply and demand.”

Famiglietti noted that the rapid depletion rate will compound the problem of short supply by leading to further declines in streamflow in the Colorado River.

“Combined with declining snowpack and population growth, this will likely threaten the long-term ability of the basin to meet its water allocation commitments to the seven basin states and to Mexico,” Famiglietti said.

The study has been accepted for publication in the journal Geophysical Research Letters, which posted the manuscript online July 24. Coauthors included other scientists from NASA’s Goddard Space Flight Center, Greenbelt, Maryland, and the National Center for Atmospheric Research, Boulder, Colorado. The research was funded by NASA and the University of California.

bookmark_borderStrange July Weather

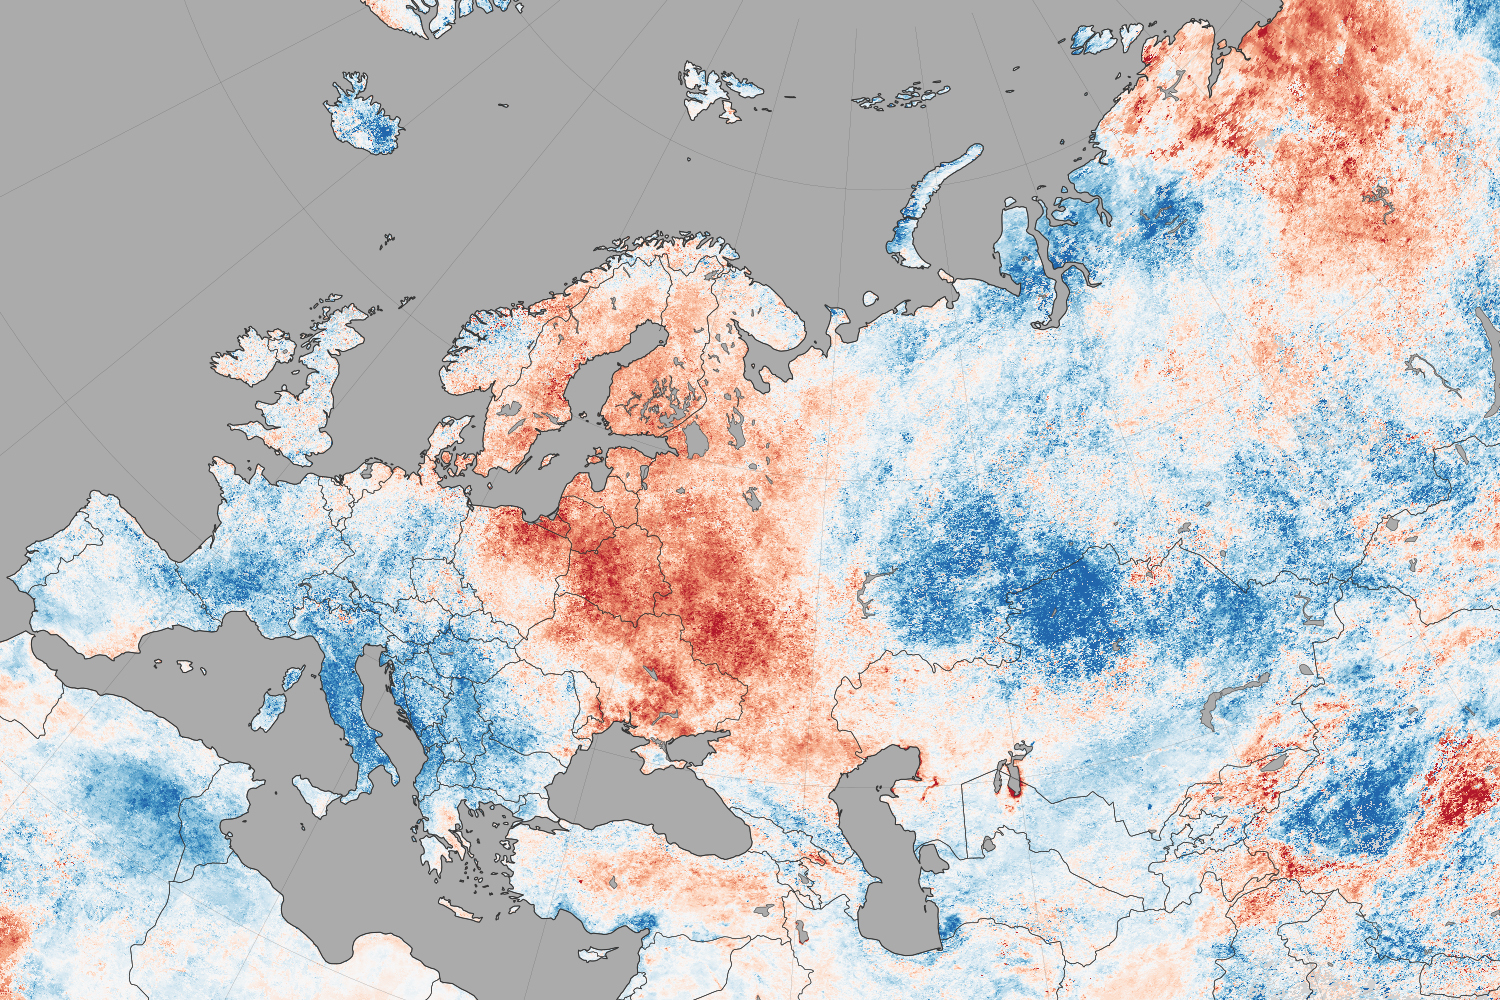
NASA reports that North America weather patterns for July 2014 were upside down:

If you live in the northern hemisphere, the past few weeks have been strange. In places where it should be seasonably hot—the eastern and southern United States and western Europe—it’s just been warm. In places where weather is usually mild in the summer—northern Europe, the Pacific coast of North America—it has been ridiculously hot.

Records for high temperatures (mid-30s°C, mid-90s°F) were approached or broken in Latvia, Poland, Belarus, Estonia, Lithuania, and Sweden in late July and early August. Searing temperatures also dried out forests and fueled wildfires in Siberia; in the U.S. states of Oregon, Washington, and California; in the Canadian provinces of British Columbia, Alberta, and Northwest Territories; and even in Sweden. At the same time, cool air moved from high northern latitudes into much of the U.S., setting record-low daytime and nighttime temperatures as far south as Florida and Georgia. Temperatures dropped to the winter-like levels in the mountains of Tennessee.

The maps on this page shows land surface temperature (LST) anomalies for July 27–August 3, 2014. They were built from data collected by the Moderate Resolution Imaging Spectroradiometer (MODIS) on NASA’s Aqua satellite, and the 2014 data is compared to the average for the same week as observed from 2005–2013. You can visit NASA Earth Observations for a view of temperature anomalies for the entire month of July.

Unusual July Temperatures

Color bar for Unusual July Temperatures

Observed by satellites uniformly across the entire globe, land surface temperatures are a measure of the amount of infrared energy (thermal radiance) emitted by Earth’s surface as it is heated by daylight and cooled in the dark of night. LSTs are sometimes referred to as land “skin” temperatures, and indeed they are a reflection of how hot a surface would feel to the touch. LST anomalies, as shown on this page, are not absolute temperatures; instead, they show how much temperatures were above or below the average. The darkest reds show areas that were as much as 10°C (20°F) above the norm; blues show areas that were below normal; light gray depicts areas with incomplete data (often due to cloud cover, such as in the area of the Indian monsoon); dark gray is ocean.

Meteorologists saw several possible and related causes for the heat waves and cooling patterns. High pressure systems over Scandinavia and northern Russia, as well as over the Pacific Northwest of North America, allowed stable air masses to build up heat domes and “block” incoming fronts that could bring changes in winds, precipitation, and temperatures. These blocking patterns worked together with unusual bends and meanders in the jet stream, which took on a see-sawing north-south pattern over the northern hemisphere. The jet moved air northward over the Pacific Ocean and warmed northwest Canada and the west coast of the U.S.; it dove south from cooler areas of Canada into the central and eastern U.S.; and it drove warm Atlantic air north into northern Europe. The jet took a similar north-south zig-zag in western and eastern Siberia. This pattern is more common in winter than in summer.

bookmark_borderConsequences Of Climate Change

NASA scientists warn:

Global climate change has already had observable effects on the environment. Glaciers have shrunk, ice on rivers and lakes is breaking up earlier, plant and animal ranges have shifted and trees are flowering sooner.

Effects that scientists had predicted in the past would result from global climate change are now occurring: loss of sea ice, accelerated sea level rise and longer, more intense heat waves.

Scientists have high confidence that global temperatures will continue to rise for decades to come, largely due to greenhouse gasses produced by human activities. The Intergovernmental Panel on Climate Change (IPCC), which includes more than 1,300 scientists from the United States and other countries, forecasts a temperature rise of 2.5 to 10 degrees Fahrenheit over the next century.

According to the IPCC, the extent of climate change effects on individual regions will vary over time and with the ability of different societal and environmental systems to mitigate or adapt to change.

The IPCC predicts that increases in global mean temperature of less than 1.8 to 5.4 degrees Fahrenheit (1 to 3 degrees Celsius) above 1990 levels will produce beneficial impacts in some regions and harmful ones in others. Net annual costs will increase over time as global temperatures increase.

“Taken as a whole,” the IPCC states, “the range of published evidence indicates that the net damage costs of climate change are likely to be significant and to increase over time.” 1

Below are some of the regional impacts of global change forecast by the IPCC:

  • North America: Decreasing snowpack in the western mountains; 5-20 percent increase in yields of rain-fed agriculture in some regions; increased frequency, intensity and duration of heat waves in cities that currently experience them.2
  • Latin America: Gradual replacement of tropical forest by savannah in eastern Amazonia; risk of significant biodiversity loss through species extinction in many tropical areas; significant changes in water availability for human consumption, agriculture and energy generation.3
  • Europe: Increased risk of inland flash floods; more frequent coastal flooding and increased erosion from storms and sea level rise; glacial retreat in mountainous areas; reduced snow cover and winter tourism; extensive species losses; reductions of crop productivity in southern Europe.4
  • Africa: By 2020, between 75 and 250 million people are projected to be exposed to increased water stress; yields from rain-fed agriculture could be reduced by up to 50 percent in some regions by 2020; agricultural production, including access to food, may be severely compromised.5
  • Asia: Freshwater availability projected to decrease in Central, South, East and Southeast Asia by the 2050s; coastal areas will be at risk due to increased flooding; death rate from disease associated with floods and droughts expected to rise in some regions.6

Global Climate Change: Recent Impacts7

Phenomena Likelihood that trend occurred in late 20th century
Cold days, cold nights and frost less frequent over land areas Very likely
More frequent hot days and nights Very likely
Heat waves more frequent over most land areas Likely
Increased incidence of extreme high sea level * Likely
Global area affected by drought has increased (since 1970s) Likely in some regions
Increase in intense tropical cyclone activity in North Atlantic (since 1970) Likely in some regions

* Excluding tsunamis, which are not due to climate change.

Global Climate Change: Future Trends8

Phenomena Likelihood of trend
Contraction of snow cover areas, increased thaw in permafrost regions, decrease in sea ice extent Virtually certain
Increased frequency of hot extremes, heat waves and heavy precipitation Very likely to occur
Increase in tropical cyclone intensity Likely to occur
Precipitation increases in high latitudes Very likely to occur
Precipitation decreases in subtropical land regions Very likely to occur
Decreased water resources in many semi-arid areas, including western U.S. and Mediterranean basin High confidence

bookmark_borderColorado Water Rights

Colorado is one of the states with the most restrictive water rights. Similar to how mineral rights can be sold separately then the other property rights, water rights in Colorado are often owned by someone other than the property owner. This means it is illegal to even capture rain water. Colorado has it’s own government department devoted to water rights.

The Colorado Division of Water Resources strives to be a leader in the water community of Colorado and the western United States. This is accomplished by focusing on the following areas: people, water and stewardship. People, because we recognize that the business of water involves our employees and the public. Water, because the administration, safety and use of the State of Colorado’s water resources is something we are committed to and care deeply about. Stewardship, because we understand and accept our obligation to the taxpayers and ourselves, in using and protecting the resources in the most effective manner possible.

Our Mission is:

  • To provide competent and dependable distribution of water in accordance with statutes, decrees and interstate compacts.
  • To ensure public safety through safe dams and properly permitted and constructed water wells.
  • To maintain and provide accurate and timely information concerning water.
  • To promote stewardship of all human, fiscal and natural resources.
  • To serve the public through the generation of creative solutions to problems.
  • To help the public understand complex water issues.
  • To promote stability in the use of the state’s limited water resources.
  • To apply modern technology to its greatest advantage.

These Principle statements will guide our actions:

  • Treating each other and the public with dignity, respect, honesty and fairness.
  • Assuming personal responsibility for individual and organizational actions.
  • Fostering continuous improvement, innovative thought, learning and shared leadership.
  • Promoting an open and honest communication environment that builds trust, respect and loyalty among ourselves and the diverse community in which we live and work.
  • Recognizing our employees and the water community for the professional, competent services they provide.

bookmark_borderSwimming In Ice Cubes

Air temperatures in the states and provinces around the Great Lakes suggest that meteorological summer has arrived. But the icy grip of winter is lingering in cool water temperatures and drifting chunks of ice. For nearly seven months, ice has been afloat somewhere on the Great Lakes, an ice season longer than anything in the satellite records and in anyone’s memory. In an average year, the lakes are ice free by late April or early May.

As recently as May 20, 2014, Lake Superior was still nearly 7 percent ice covered; on June 3, it was 1.3 percent. The ice was concentrated mostly in the far western and southern parts of the lake—even as air temperatures onshore approached 80 degrees Fahrenheit (27 degrees Celsius) on some days. In the second week of June, boaters, fishermen, and scientists were still capturing photos of ice chunks in the water, though the Great Lakes Environmental Research Laboratory officially declared the region to be effectively ice free for the sake of shipping interests.

The Operational Land Imager (OLI) on the Landsat 8 satellite captured the top image on May 23, 2014, the start of Memorial Day weekend (and unofficial start of summer in the United States). The second image was acquired on June 8, 2014. Both show Lake Superior near Chequamegon Bay, Wisconsin, about 60 miles east of Duluth, Minnesota. The bay lies near the western end of Lake Superior, which is bounded by the American states of Wisconsin, Michigan, and Minnesota and by Canada’s Ontario Province. Turn on the image comparison tool to see the changes in ice cover and river sediment outflow over two weeks.

The residual ice in June is not necessarily a surprise given the record-setting cold weather and extensive ice cover this winter. The Weather Channel reported that temperatures in nearby Marquette, Wisconsin, stayed below freezing for a record 75 days in the midst of winter. Lake Superior was still 64 percent ice-covered in mid-April 2014. And water temperatures in Lake Superior were still in the 30s (0 to 5 Celsius) as of June 10, 2014.

Nonetheless, the icy waters made for some interesting summer fishing and sunbathing scenes.

Lake Superior Summer Iice

bookmark_borderClimate Change and the Presidental Action Plan

The President’s Plan to Cut Carbon Pollution in America

Reducing Carbon Pollution from Power Plants

Power plants are the largest major source of emissions in the U.S., together accounting for roughly one-third of all domestic greenhouse gas pollution.

PROGRESS:

In September 2013, the Environmental Protection Agency (EPA) announced proposed carbon pollution standards for new power plants.

PROGRESS:

The EPA has met with more than 300 stakeholder groups from across the country to gather information on standards for existing power plants. In June 2014, the EPA issued proposed carbon pollution standards for existing power plants.


Continuing the momentum for the future:


Accelerating Clean Energy Leadership

During the President’s first term, the United States more than doubled generation of electricity from wind and solar energy.


PROGRESS:

Since President Obama took office, the U.S. increased solar generation by more than ten-fold and tripled electricity production from wind power.

PROGRESS:

The Department of the Interior (DOI) announced permitting the 50th utility-scale renewable energy project on public lands. The projects could support more than 20,000 jobs and generate enough electricity to power 4.8 million homes.

PROGRESS:

In May 2014, the DOE’s Solar Instructor Training Network announced it will support training programs at community colleges across the country that will assist 50,000 workers to enter the solar industry by 2020.

PROGRESS:

In May 2014, President Obama announced more than 300 commitments private and public sector commitments to create jobs and cut carbon pollution by advancing solar deployment and energy efficiency — representing enough energy to power nearly 130,000 homes.


Continuing the momentum for the future:

Building a 21st Century Clean Energy Infrastructure

Heavy-duty vehicles (commercial trucks, vans, and buses) are currently the second largest source of greenhouse gas pollution within the transportation sector.


PROGRESS:

In January 2014, President Obama signed a Presidential Memorandum establishing the federal government’s first Quadrennial Energy Review (QER) process, with an initial focus on our nation’s energy infrastructure.

PROGRESS:

In February 2014, President Obama directed EPA and DOT to develop and issue the next phase of heavy-duty vehicle fuel efficiency and greenhouse gas standards by March 2016.

PROGRESS:

In 2011, the Administration finalized fuel economy standards for Model Year 2014-2018 for heavy-duty trucks, buses, and vans. This will reduce greenhouse gas emissions by about 270 million metric tons and save 530 million barrels of oil.

PROGRESS:

The Administration has already established the toughest fuel economy standards for passenger vehicles in U.S. history. These standards require an average performance equivalent of 54.5 miles per gallon by 2025.


Continuing the momentum for the future:

Cutting energy waste in homes, businesses, and factories

Energy efficiency is one of the clearest and most cost-effective opportunities to save families money, make our businesses more competitive, and reduce greenhouse gas pollution.


PROGRESS:

Since June, 75 new partners have joined the President’s Better Buildings Challenge. More than 190 organizations, together representing over 3 billion square feet of building space, have now committed to energy savings.

PROGRESS:

In President Obama’s first term, DOE and HUD completed efficiency upgrades in nearly two million homes, saving many families more than $400 on their heating and cooling bills in the first year alone.

PROGRESS:

In December 2013, the Department of Agriculture announced it will provide up to $250 million to help businesses and residential customers in rural areas cut their energy bills through energy efficiency and renewable energy use.

PROGRESS:

Since June, DOE has issued nine proposed and seven final energy conservation standards for appliances and equipment. If finalized and combined with rules already issued, the energy savings will help cut consumers’ electricity bills by hundreds of billions of dollars.


Continuing the momentum for the future:

Reducing other greenhouse gas emissions

Emissions of hydrofluorocarbons (HFCs) — which are potent greehouse gases — are expected to double by 2020 and nearly triple by 2030 in the U.S.

PROGRESS:

Since 1990, methane emissions have decreased by 11% in part through partnerships with industry.

PROGRESS:

In March 2014, the Administration released a Strategy to Reduce Methane Emissions from landfills, coal mining, agriculture, and oil and gas systems through voluntary actions and common-sense standards.


Continuing the momentum for the future:

Federal leadership

Since 2008, federal agencies have reduced greenhouse gas pollution by more than 17 percent — the equivalent of permanently taking 1.8 million cars off the road.

PROGRESS:

Expanded energy performance contracts from $2 billion to $4 billion to provide energy efficiency upgrades for Federal buildings, at no net cost to the taxpayer.

PROGRESS:

On December 5, President Obama signed a Presidential Memorandum directing the federal government to buy at least 20% of its electricity from renewable sources by 2020.

bookmark_borderClimate Disruption

The United States of America released a report on global warming and has named the problem climate disruption.


The report +confirms that climate change is not a distant threat — it’s affecting us now.” Climate disruption is “expected to become increasingly disruptive across the nation throughout this century and beyond,” the National Climate Assessment concluded.

“President Obama has announced a series of executive actions to reduce carbon pollution, prepare the U.S. for the impacts of climate change, and lead international efforts to address global climate change.”

Due to climate change, the weather is getting more extreme Temperatures are rising across the U.S. Temperatures from 2001 to 2012 were warmer than any previous decade in every region of the United States. Explore this interactive map from the National Climate Assessment to learn more.

EXTREME WEATHER EVENTS
Droughts, Wildfires, and Floods are all more frequent and intense. Precipitation was 2.57 inches below the 20th Century Average. Wildfires burned more than 9.3 million U.S. acres.

Extreme weather comes at a cost

Climate and weather disasters in 2012 alone cost the American economy more than $100 billion

$30 Billion U.S. drought/heatwave

$65 Billion Superstorm Sandy

$11.1 Billion Combined severe weather

$1 Billion Western wildfires

$2.3 Billion Hurricane Isaac

There are also public health threats associated with extreme weather

Children, the elderly, and the poor are most vulnerable to a range of climate-related health effects, including those related to heat stress, air pollution, extreme weather events, and diseases carried by food, water, and insects.


We can choose to believe that Superstorm Sandy, and the most severe drought in decades, and the worst wildfires some states have ever seen were all just a freak coincidence. Or we can choose to believe in the overwhelming judgement of science — and act before it’s too late.
– President Obama