bookmark_borderThe Future of Energy Is Not Static

By Daniel Brouse
Economist & Climatologist
Membrane Domain USA
August 10, 2026

I’m not certain what the future holds. I don’t think anyone can be.

But I’m also not convinced that the future of fossil fuels can be projected simply by looking at today’s production levels and assuming they will continue indefinitely.

There is a very real possibility that economics, energy security, technological substitution, and even economic disruption could phase out fossil fuels much faster than most people expect.

In fact, some of the data already point in that direction.

The Energy Transition Is Already Moving

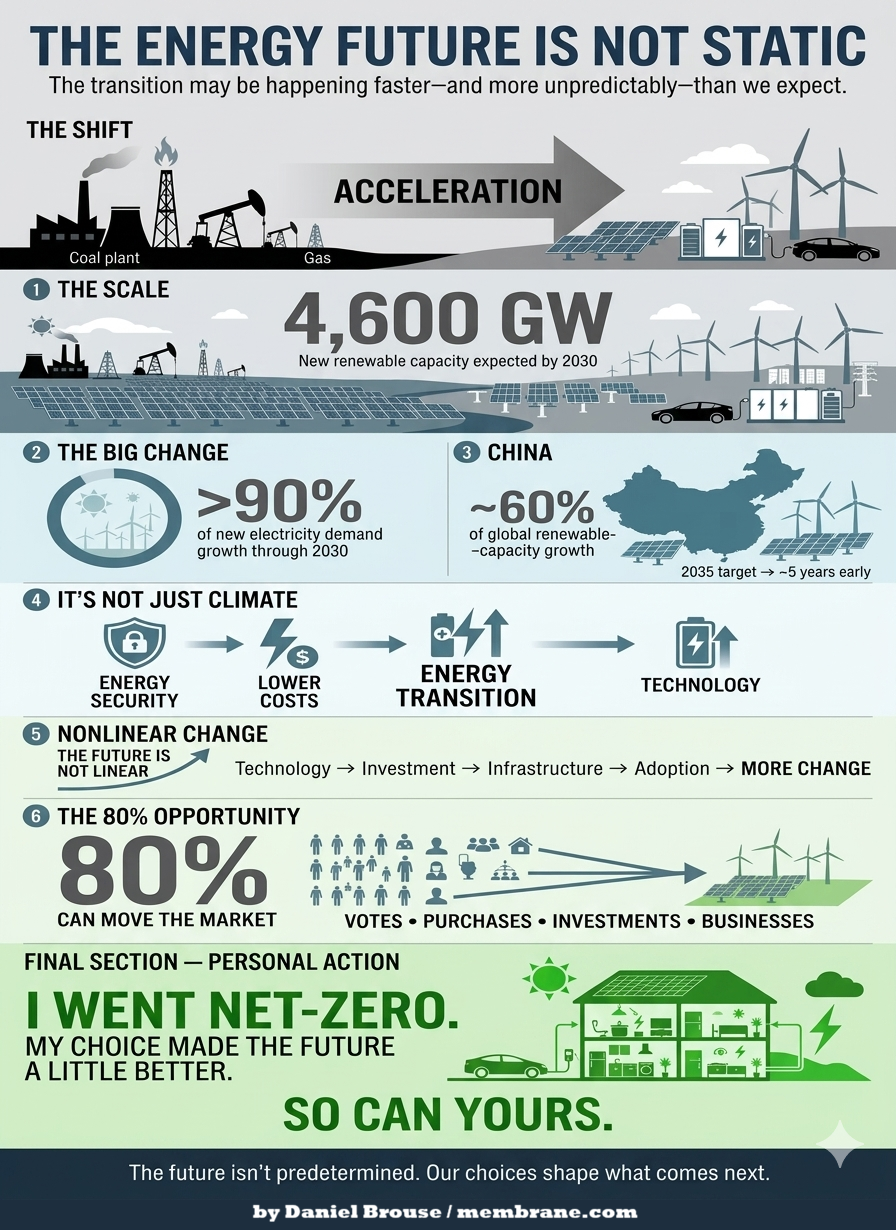
The International Energy Agency estimates that global renewable capacity will increase by roughly 4,600 GW between 2025 and 2030—an extraordinary expansion roughly equivalent to the combined current power capacity of China, the European Union, and Japan.

Solar PV is expected to account for almost 80% of that expansion.

Even more significant is what this means for the growth of electricity demand. Renewables are expected to provide more than 90% of the increase in global electricity generation through 2030.

This is not simply a distant prediction about some hypothetical future energy system. It represents an enormous investment already underway.

And the transition is happening particularly rapidly in China.

China is now responsible for nearly 60% of global renewable-capacity growth. In 2025 alone, it added roughly 314 GW of solar capacity and is on track to reach its 2035 wind-and-solar target approximately five years early.

Whatever one’s views on climate policy, these numbers are difficult to dismiss.

The global energy system is changing.

And it is changing rapidly.

This Isn’t Just About Climate Policy

There is another factor that deserves considerably more attention: energy security.

The transition away from fossil fuels is not being driven exclusively by environmental concerns. Increasingly, it is also becoming an economic and strategic imperative.

The disruption of oil and gas flows through critical transportation routes such as the Strait of Hormuz demonstrates the vulnerability inherent in an energy system dependent upon globally traded fossil fuels.

For Europe and Asia in particular, domestic renewable generation, energy storage, electrification, and efficiency increasingly represent something more than climate policy.

They are energy-security assets.

A solar panel or wind turbine doesn’t need to be transported through a geopolitical chokepoint every time it generates electricity. Once installed, domestic renewable resources can reduce exposure to international fuel-price shocks, supply disruptions, and geopolitical conflicts.

That changes the economic calculation.

And it is one reason I believe the energy transition may prove considerably more nonlinear than many conventional forecasts assume.

The Future May Be Nonlinear

I agree that we shouldn’t pretend we know exactly what the future holds.

My point is almost the opposite.

The future may be much more nonlinear than either of us can confidently predict.

Technologies don’t necessarily replace one another gradually. Once a technology becomes sufficiently cheap, reliable, scalable, and convenient, adoption can accelerate rapidly.

The same thing can happen with infrastructure.

Battery storage becomes cheaper. Electric vehicles become more capable. Solar becomes less expensive. Transmission improves. Heat pumps become more efficient. Businesses discover that electrification can reduce operating costs. Consumers begin choosing technologies that save them money.

Each development can reinforce the others.

And once enough pieces of the system change, the economics of the entire energy system can change with them.

This is why simply extrapolating today’s fossil-fuel production into the future can be misleading.

Could “Drill, Baby, Drill” Backfire?

There is an irony here.

Policies intended to expand U.S. fossil-fuel production could potentially accelerate the transition they are intended to slow if they contribute to greater volatility, geopolitical exposure, or investment in alternatives.

Consider what could happen during a serious economic downturn.

A major recession could cause substantial demand destruction. Businesses would consume less energy. Consumers would drive less and purchase fewer goods. Industrial production would decline.

Fossil-fuel consumption could fall sharply.

That would potentially undermine the very industry that policies designed around expanding fossil-fuel production are intended to strengthen.

There is no guarantee this will happen. But that’s precisely the point.

The future contains feedback loops.

Economic conditions affect energy demand. Energy prices affect technology adoption. Technology affects investment. Investment affects infrastructure. Infrastructure affects energy prices and security. Geopolitical events affect all of them.

The result is a system capable of changing much faster than a simple linear projection would suggest.

This Isn’t an All-or-Nothing Choice

I’m not trying to create another online debate.

I’m simply pointing out that the data show a transition already underway—and its speed is anything but static.

And perhaps the most important point is that this isn’t an all-or-nothing proposition.

Every increment of transition matters.

Every electric vehicle displaces some gasoline consumption. Every solar panel replaces some electricity that otherwise might have come from fossil fuels. Every efficiency improvement reduces energy demand. Every battery installation makes intermittent renewable energy more useful. Every business that electrifies reduces some exposure to fossil-fuel prices.

The more we transition, the more reasonable—and manageable—the future becomes.

We don’t need to transform the entire energy system overnight.

We need to keep moving.

Technology Is Changing More Than Energy

There is another reason I remain optimistic.

Ironically, AI and rapidly advancing technology are accelerating climate science at a pace that may eventually rival the acceleration of climate change itself.

Research that once took years can increasingly be explored in hours.

Large datasets can be analyzed in ways that weren’t previously practical. Relationships between variables can be identified more quickly. Models can be tested, refined, and compared at extraordinary speed.

I’ve been able to identify hundreds of interacting feedbacks and relationships that weren’t even being seriously considered just a few years ago.

That doesn’t mean every hypothesis will be correct.

It means our ability to investigate complex systems is expanding extraordinarily quickly.

And that gives me reason for optimism.

Humans have an extraordinary capacity to adapt, innovate, and solve difficult problems—especially when we are sufficiently motivated to do so.

The future is not predetermined.

What we do now can still make an enormous difference in what comes next.

The 80% Question

A final thought concerns something that initially struck me as particularly concerning.

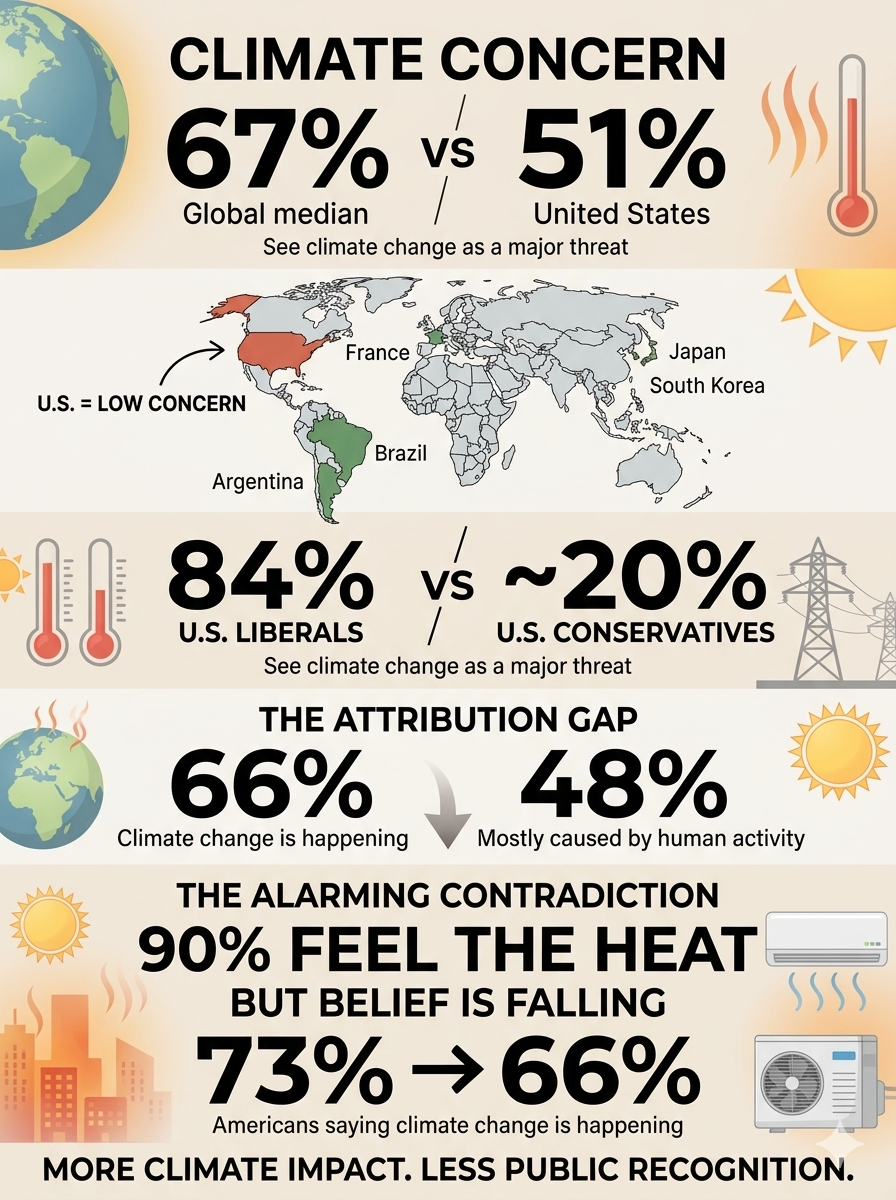
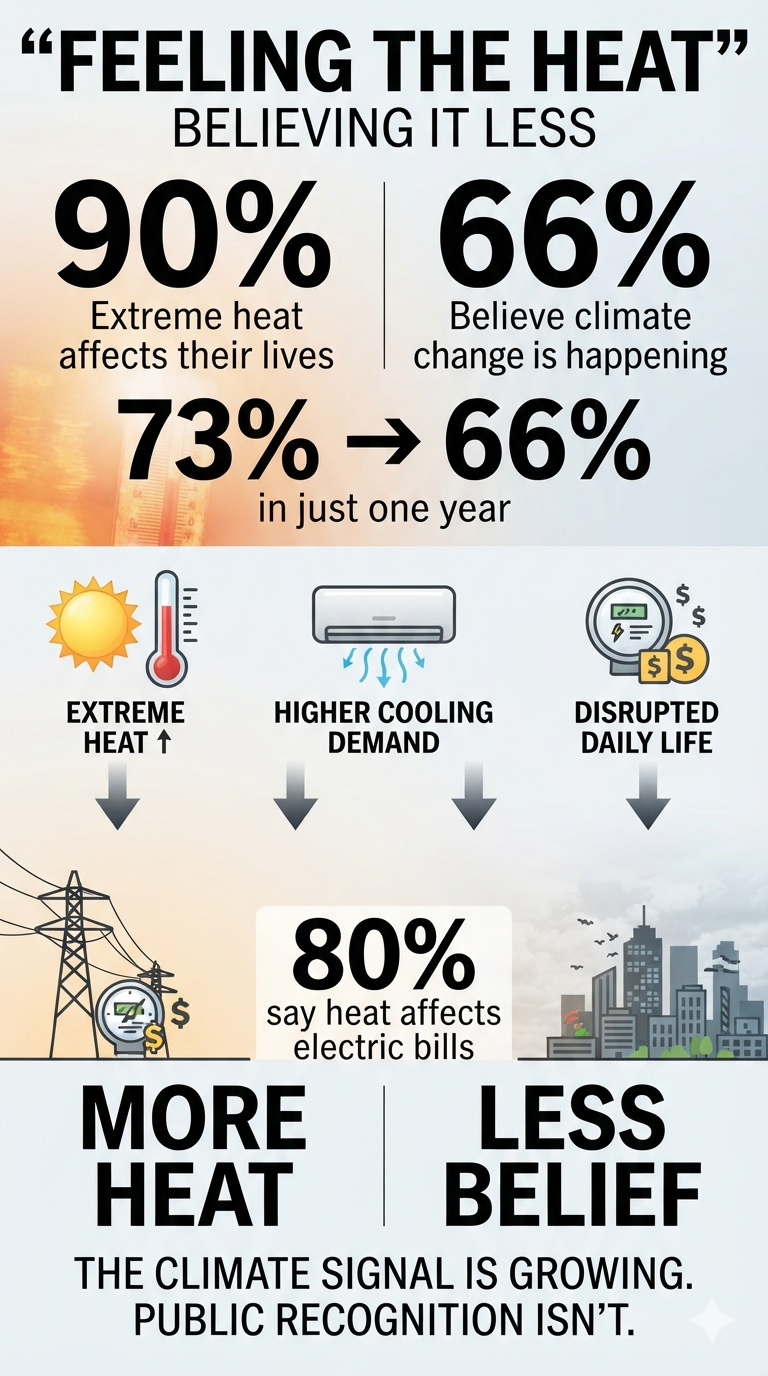
Roughly 20% of Americans appear to be actively fighting the energy transition.

At first, I found that almost dumbfounding. I expected the number to be closer to less than 2%.

But there is another way to look at it.

That still leaves roughly 80% of the population.

And if that 80% chooses to act—through voting, investment, purchasing decisions, business decisions, and simply choosing where to spend their dollars—the market can move remarkably quickly.

We don’t necessarily have to fight the remaining 20%.

We can vote with our dollars.

Markets respond to demand.

If enough consumers and businesses choose alternatives, capital will follow. Manufacturers will respond. Infrastructure will change. Companies will adapt.

And eventually, the fossil-fuel industry will have to adapt as well—or gradually lose market share.

That is the power of an energy transition driven not only by government policy, but by millions of individual economic decisions.

My Choice. Your Choice. Our Future.

I went net-zero years ago.

If I can do it, anybody can.

I don’t claim that my individual decision changed the world.

But my choice made the future a little better than it otherwise would have been.

And so can yours.

The future of energy isn’t predetermined by today’s production numbers, today’s political battles, or today’s assumptions.

It will be shaped by billions of decisions made by consumers, businesses, investors, engineers, scientists, and governments.

Some of those decisions will be political.

Many will be economic.

Some will be technological.

And countless others will be personal.

That’s why I don’t think the question is whether we can predict exactly what the energy system will look like in 10, 20, or 30 years.

We can’t.

The more important question is:

What direction are we moving—and how much can our choices influence where we ultimately arrive?

The transition is already underway.

Its speed is accelerating.

And the future is still ours to shape.

bookmark_borderScience Is Science: Confronting Denialism and Ecofascism

About Denialism and Ecofascism: Science Is Science

The Observation
Glad to know you’re watching out! At the same time, this divisiveness—when we desperately need everyone to pull together because it’s a CRISIS, right?—makes me somehow deeply sad.

That’s a big job right there… How do we reach those who seem furthest away from any kind of understanding? We need both a Winston Churchill and a Mahatma Gandhi in this endeavor…

The Response
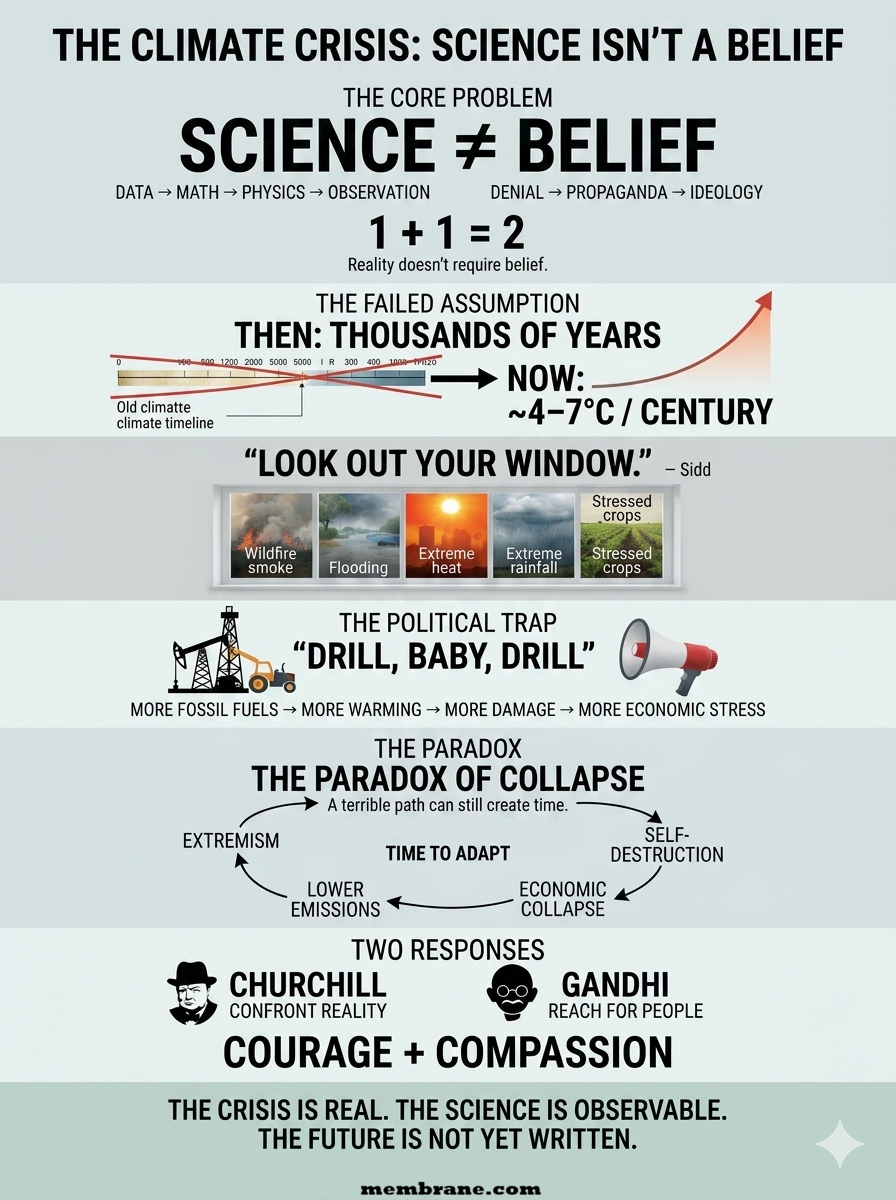
Agreed. Both denialism and ecofascism are ideologies that ultimately defy logic. In very different ways, they can become a kind of combination of self-destruction and destruction of others.

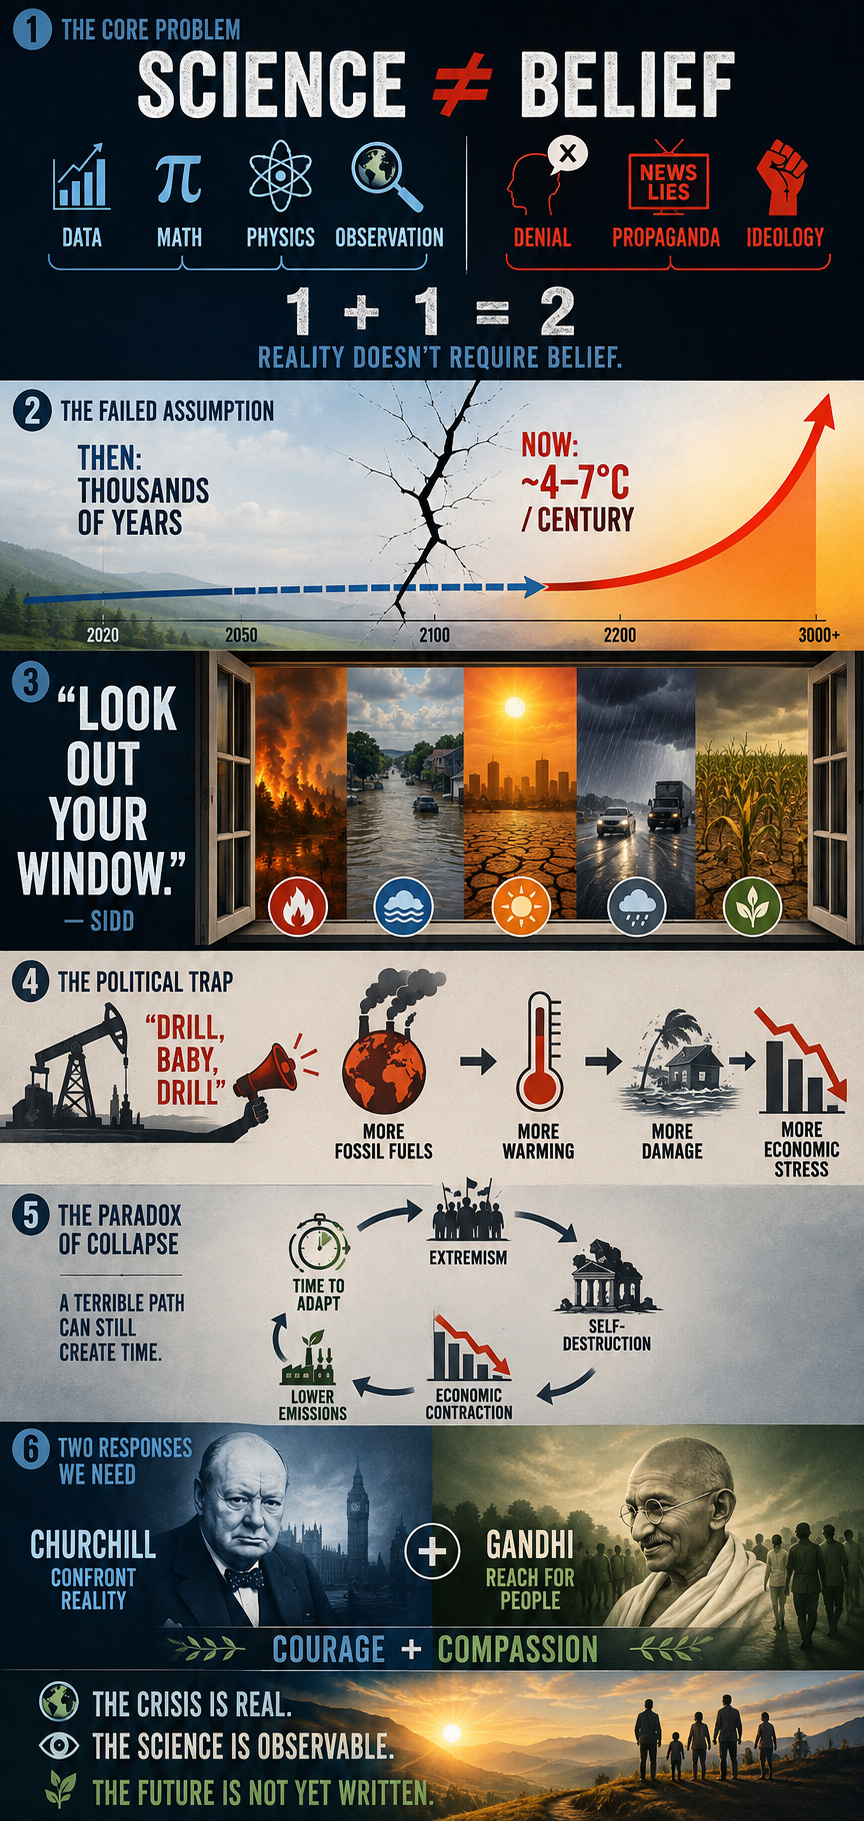
I’ve spent years battling misinformation, propaganda, and rhetoric. To the best of my knowledge, neither Sidd nor I have successfully converted—or even educated—a single committed denier. Climate science has somehow been transformed into a “belief” system. But science has nothing to do with belief. 1 + 1 = 2. If someone refuses to “believe” that, what exactly can you do?

From the beginning, our work has been based on observations, data, mathematics, and the laws of physics. So yes, I think this is at the heart of the crisis. When we started this work, we genuinely believed humanity would eventually take action. We thought we had thousands, if not tens of thousands, of years to adapt. That was the one thing we got wrong.

A couple of years ago, after explaining my continuing attempts to reach climate deniers, I asked Sidd what we could possibly do. His response was essentially, “Dude, just tell them to look out their window.” It sounds simplistic, but there is profound truth in it. The consequences are becoming increasingly difficult to deny.

Since then, we’ve had to rebuild much of our modeling. A +4°C world within thousands of years is no longer the worst-case scenario we worry about. The possibility of 4–7°C of warming within a century has become a much more serious concern in our work.

And then there is the political dimension. The rise of white-nationalist and authoritarian governments in the U.S. and elsewhere has made an already difficult problem considerably harder. Paradoxically, though, history offers one small reason for hope: fascism ultimately fails. It is inherently self-destructive.

The “drill, baby, drill” mentality is economically and environmentally self-defeating. A severe economic contraction could, ironically, buy humanity some time for adaptation while drastically reducing emissions. That is hardly the future anyone should want, but history has repeatedly demonstrated that systems built on extremism and authoritarianism eventually consume themselves.

So yes—we desperately need both the Churchill and Gandhi dimensions: the willingness to confront reality without flinching, and the willingness to keep reaching for people rather than giving up on them. I’m just not sure humanity has ever faced a crisis where we needed both quite this badly.

bookmark_borderReal Estate Climate Risk Models

by Daniel Brouse and Sidd Mukherjee

Background

Sidd said: “frightening article by Jeff Masters. We saw some of this coming, the flood risk aint just
along the coast, it extends 100 miles inland…
the water cant get out …”

https://yaleclimateconnections.org/2026/08/the-floods-of-the-future-wont-come-one-at-a-time/

In the 1990s, Sidd and I began developing real-estate-based climate risk models. From the beginning, one of the underlying high-risk factors was flooding—and, closely linked to it, the availability and affordability of flood insurance. In the early 2000s, we met with FEMA, Fannie Mae (FNMA), and Freddie Mac (FHLMC) to better understand their flood-risk modeling and emerging plans for managed retreat.

In October 2023, Sidd observed: “Now I am thinking the violent rain will be a bigger problem before we die.”

That concern has become increasingly relevant. As the Earth warms, warmer air can physically hold more water vapor than cooler air. For every 1°C (1.8°F) increase in temperature, the atmosphere can hold approximately 7% more moisture, increasing the potential for extreme precipitation. Over a 10°C increase, atmospheric moisture-holding capacity would nearly double, creating the potential for substantially more intense rainfall.

The problem, however, is not simply the amount of water falling from the sky. It is also what happens when that water moves across the landscape—and whether infrastructure and government response systems are capable of managing, containing, and recovering from the resulting flows.

Flow forces scale with the square of velocity (v²). As flow speeds increase—whether from heavier rainfall, steeper runoff, or more intense hydrological events—the destructive force of moving water rises rapidly. Density further magnifies this effect. Water is roughly 800 times denser than air, meaning that a comparable flow velocity can produce dramatically greater force.

Together, we developed a series of models incorporating the Clausius–Clapeyron relationship, the extreme energy transfer within the water cycle through latent heat, and fluid-flow dynamics. These models increasingly pointed toward a risk structure in which flooding could no longer be treated as an isolated coastal problem. Instead, precipitation intensity, runoff, topography, infrastructure vulnerability, insurance stress, and limited recovery capacity can interact and compound one another across much larger regions.

By 2026, the framework had evolved from a theoretical real-estate climate-risk model into a broader multiplicative risk framework that could be evaluated against observed real-world conditions.

The latest evolution of this work is presented in the following three papers:

bookmark_borderGlobal Real Estate Climate Risk: A Multiplicative Vulnerability Ranking

by Daniel Brouse and Sidd Mukherjee

The Multiplicative Climate Risk Formula

The Multiplicative Climate Risk Formula is a real-estate climate-risk model designed to capture how multiple hazards and vulnerabilities can interact and compound rather than occur independently. The framework incorporates interconnected risks including sea-level rise, storm surge, extreme precipitation, flooding, hydroclimatic whiplash, wildfires, drought, extreme heat, hurricanes, landslides, avalanches, and other cascading hazards.

Rather than treating each hazard as an isolated threat, the model evaluates how hazard exposure, hazard coupling, structural vulnerability, insurance stress, and recovery deficits can multiply overall real-estate risk.

The central premise is simple:

Climate risk is not merely additive. When multiple vulnerabilities interact, their combined impact can be substantially greater than the sum of their individual effects.

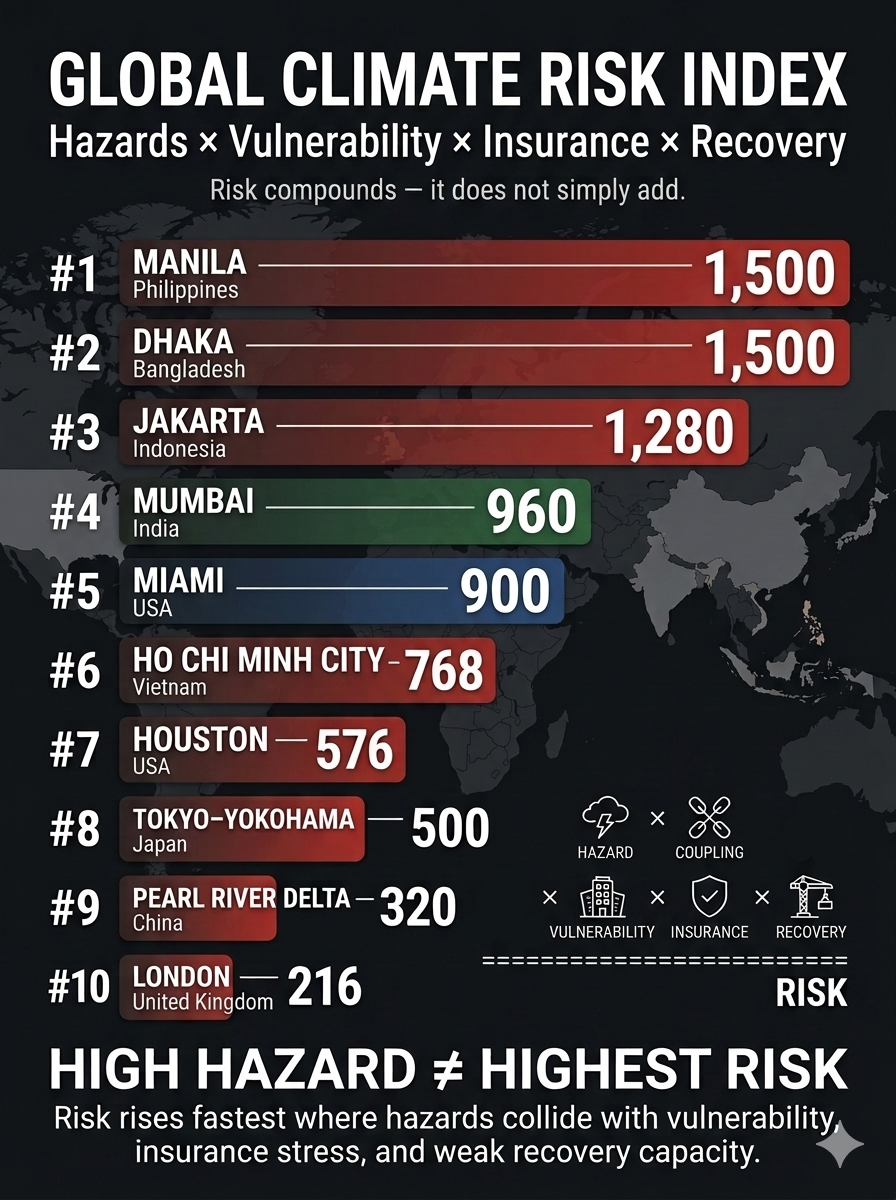
Applying the Multiplicative Climate Risk Formula on a global scale reveals that the greatest real-estate vulnerabilities are concentrated in major metropolitan and economic hubs where intense physical hazards intersect with structural fragility, insurance stress, and limited recovery capacity.

Unlike conventional hazard rankings, this framework recognizes that climate risk is not additive. A region can have relatively resilient buildings yet remain highly exposed because of insurance stress, infrastructure dependence, or coupled hazards. Conversely, a region with extreme physical exposure can rank lower when strong building standards, financial capacity, and rapid recovery systems substantially reduce vulnerability.

The global ranking applies the framework using a 1–5 scale, where 1 = Low and 5 = Extreme:

Hazard Exposure × Hazard Coupling × Vulnerability × Insurance Stress × Recovery Deficit = Multiplicative Real Estate Climate Risk

The resulting score is a comparative risk factor rather than a probability of loss or a forecast of future property values.


1. Manila & Central Luzon, Philippines

Hazard Exposure (5): Exceptional exposure to multiple severe Pacific typhoons, coastal storm surge, extreme rainfall, river flooding, and sea-level rise.

Hazard Coupling (5): Storm surge can coincide with torrential rainfall and river flooding, trapping inland water and producing prolonged flooding across low-lying urban districts.

Vulnerability (4): High population density, uneven construction quality, aging structures, and extensive informal development increase exposure to severe wind and flood damage.

Insurance Stress (3): Commercial insurance is more accessible for premium assets than for much of the broader property market, leaving substantial portions of residential and lower-value real estate underinsured.

Recovery Deficit (5): Severe recovery constraints can arise from infrastructure damage, disrupted electrical systems, engineering shortages, and delays in mobilizing reconstruction resources.

Total Multiplicative Risk: 5 × 5 × 4 × 3 × 5 = 1,500


2. Dhaka, Bangladesh

Hazard Exposure (4): Extreme exposure to tropical cyclones, riverine flooding, intense rainfall, extreme heat, and broader regional water stress.

Hazard Coupling (5): Extreme heat, heavy precipitation, drainage limitations, river flooding, and rapidly expanding urbanization can interact to amplify infrastructure and property losses.

Vulnerability (5): Large concentrations of densely developed, lower-quality and non-engineered structures create substantial exposure to flooding, subsidence, and extreme weather.

Insurance Stress (3): Formal property insurance penetration remains limited, leaving many losses concentrated on property owners and investors rather than broadly distributed through insurance markets.

Recovery Deficit (5): Limited fiscal capacity, infrastructure constraints, and dependence on external recovery financing can substantially extend post-disaster reconstruction.

Total Multiplicative Risk: 4 × 5 × 5 × 3 × 5 = 1,500


3. Greater Jakarta Area (Jabodetabek), Indonesia

Hazard Exposure (4): Severe exposure to chronic land subsidence, monsoonal flooding, extreme rainfall, coastal inundation, and sea-level rise.

Hazard Coupling (5): Land subsidence increases the effective impact of rising seas and high tides, while intense rainfall can overwhelm drainage systems and compound coastal flooding.

Vulnerability (4): Dense development, vulnerable transportation and utility infrastructure, and extensive below-grade systems increase exposure to flood-related disruption.

Insurance Stress (4): High climate-related losses and growing flood exposure can increase underwriting pressure, exclusions, deductibles, and affordability challenges.

Recovery Deficit (4): Major infrastructure investments are underway, but the scale of the metropolitan region and continuing subsidence create substantial long-term recovery and adaptation requirements.

Total Multiplicative Risk: 4 × 5 × 4 × 4 × 4 = 1,280


4. Mumbai Metropolitan Region, India

Hazard Exposure (4): High exposure to intense monsoon rainfall, coastal flooding, tropical cyclones, sea-level rise, and extreme heat.

Hazard Coupling (5): Extreme rainfall interacting with dense urbanization, inadequate drainage, coastal flooding, and heat stress can produce cascading infrastructure and real-estate disruption.

Vulnerability (4): Rapid development, extensive reclaimed land, aging buildings, and high-density urbanization increase exposure to flooding, structural deterioration, and infrastructure failure.

Insurance Stress (3): Climate-risk insurance penetration remains uneven, while rising exposure to flood and heat losses places increasing pressure on commercial and residential property coverage.

Recovery Deficit (4): Aging drainage systems, infrastructure deficits, population density, and high emergency-service demands can prolong recovery following major events.

Total Multiplicative Risk: 4 × 5 × 4 × 3 × 4 = 960


5. Miami & Southeast Florida, United States

Hazard Exposure (5): Exceptional exposure to major Atlantic hurricanes, storm surge, sea-level rise, tidal flooding, and recurrent coastal inundation.

Hazard Coupling (4): Storm surge, rainfall, rising seas, groundwater interactions, and porous limestone geology can combine to produce flooding beyond areas directly affected by rainfall.

Vulnerability (3): Modern buildings benefit from increasingly stringent wind standards, but extensive older and mid-tier residential and commercial properties remain vulnerable to wind, flood, and water intrusion.

Insurance Stress (5): Extreme insurance stress is driven by carrier withdrawals, rising premiums, higher deductibles, reinsurance costs, and growing exposure to catastrophic losses.

Recovery Deficit (3): High private wealth, federal disaster resources, and substantial construction capacity support recovery, although repeated disasters can strain public infrastructure and municipal finances.

Total Multiplicative Risk: 5 × 4 × 3 × 5 × 3 = 900


6. Ho Chi Minh City & Mekong Delta, Vietnam

Hazard Exposure (4): High exposure to chronic flooding, tropical storms, sea-level rise, extreme rainfall, and land subsidence.

Hazard Coupling (4): Tidal intrusion, river flooding, subsidence, upstream water management, and intense rainfall can combine to produce prolonged inundation.

Vulnerability (4): Large concentrations of low-rise residential, industrial, and manufacturing properties remain exposed to flooding and often lack comprehensive floodproofing or elevated mechanical systems.

Insurance Stress (3): Industrial assets may have access to international insurance capacity, but climate-risk pricing and coverage remain uneven across the broader real-estate market.

Recovery Deficit (4): Infrastructure investment continues to expand, but rapid urban and industrial growth can outpace drainage, flood-control, and adaptation capacity.

Total Multiplicative Risk: 4 × 4 × 4 × 3 × 4 = 768


7. Houston & Southeast Texas Gulf, United States

Hazard Exposure (4): High exposure to extreme rainfall, hurricanes, storm surge, coastal flooding, and occasional severe winter weather.

Hazard Coupling (4): Intense rainfall interacting with extensive impervious urban surfaces, bayous, drainage limitations, and coastal water levels can generate widespread property inundation.

Vulnerability (3): Large concentrations of slab-on-grade development and extensive construction across flood-prone areas increase exposure to flooding and infrastructure disruption.

Insurance Stress (4): Rising catastrophe losses, increasing deductibles, and elevated wind, hail, and flood costs place substantial financial risk on property owners.

Recovery Deficit (3): Strong corporate and regional financial capacity supports recovery, but large-scale flood-control, grid, and infrastructure projects can require years to complete.

Total Multiplicative Risk: 4 × 4 × 3 × 4 × 3 = 576


8. Tokyo-Yokohama Metropolitan Area, Japan

Hazard Exposure (5): Exceptional exposure to typhoons, storm surge, extreme rainfall, coastal flooding, and major seismic hazards.

Hazard Coupling (5): Typhoon rainfall can saturate soils and simultaneously trigger landslides, flooding, drainage failures, and infrastructure disruptions.

Vulnerability (2): Strong seismic engineering, rigorous building standards, sophisticated infrastructure, and extensive disaster-preparedness systems substantially reduce structural vulnerability.

Insurance Stress (5): Despite strong domestic resilience, the concentration of enormous asset values and catastrophe exposure creates substantial insurance and reinsurance accumulation risk.

Recovery Deficit (2): Strong national institutions, advanced emergency logistics, substantial financial capacity, and sophisticated construction and engineering systems support comparatively rapid recovery.

Total Multiplicative Risk: 5 × 5 × 2 × 5 × 2 = 500


9. Pearl River Delta — Hong Kong, Shenzhen & Guangzhou, China

Hazard Exposure (5): Exceptional exposure to typhoons, extreme precipitation, coastal flooding, sea-level rise, and heat.

Hazard Coupling (4): Extreme rainfall, storm surge, drainage constraints, underground infrastructure, and disruptions to industrial power and supply chains can interact to create cascading losses.

Vulnerability (2): Modern high-rise construction, extensive engineered infrastructure, and substantial flood and coastal defenses reduce the probability of widespread structural failure.

Insurance Stress (4): The extraordinary concentration of commercial and industrial assets creates significant aggregate-loss exposure for insurers and reinsurers during major catastrophes.

Recovery Deficit (2): Strong governmental capacity, extensive infrastructure, rapid mobilization, and substantial financial resources support comparatively rapid physical recovery.

Total Multiplicative Risk: 5 × 4 × 2 × 4 × 2 = 320


10. London & Thames Estuary, United Kingdom

Hazard Exposure (3): Moderate exposure to storm surge, coastal and river flooding, winter storms, extreme rainfall, and increasing heat stress.

Hazard Coupling (4): Sea-level rise increases pressure on tidal defenses, while a major surge combined with heavy rainfall could disrupt transportation, underground infrastructure, and commercial districts simultaneously.

Vulnerability (3): Extensive historic building stock, aging infrastructure, subsidence-sensitive soils, and limited cooling capacity increase exposure to certain climate hazards.

Insurance Stress (3): Insurance remains broadly accessible, but increasing exposure to flooding, heat, subsidence, and other climate-related losses may increase premiums and underwriting constraints.

Recovery Deficit (2): Strong institutions, substantial fiscal capacity, sophisticated infrastructure, and extensive engineering resources provide significant recovery advantages.

Total Multiplicative Risk: 3 × 4 × 3 × 3 × 2 = 216


Global Climate Risk Index Matrix

Because the framework is multiplicative rather than additive, high structural vulnerability and limited recovery capacity can propel a region above a wealthier, more technologically advanced city even when the latter faces greater absolute exposure to extreme weather.

RankGlobal RegionHazard ExposureHazard CouplingVulnerabilityInsurance StressRecovery DeficitMultiplicative Risk
1Manila & Central Luzon, Philippines554351,500
2Dhaka, Bangladesh455351,500
3Greater Jakarta, Indonesia454441,280
4Mumbai, India45434960
5Miami & Southeast Florida, USA54353900
6Ho Chi Minh City & Mekong Delta, Vietnam44434768
7Houston & Southeast Texas Gulf, USA44343576
8Tokyo-Yokohama, Japan55252500
9Pearl River Delta, China54242320
10London & Thames Estuary, UK34332216

What the Multiplicative Model Reveals

The ranking produces an important result: the most dangerous real-estate markets are not necessarily those with the most extreme individual hazards.

The multiplicative structure rewards resilience and penalizes systemic weakness. A highly exposed city with strong building standards, deep financial reserves, robust infrastructure, and rapid recovery capacity can therefore rank below a less technologically advanced city where multiple vulnerabilities interact.

This is the central insight of the model:

Climate risk is not simply where hazards are strongest. It is where hazards, vulnerability, insurance stress, and recovery deficits compound.

The greatest real-estate risks emerge when physical climate exposure becomes financially and institutionally amplified—turning a weather event into a prolonged property, insurance, infrastructure, and investment crisis.

bookmark_borderCoupled Climate Feedbacks and Cascading Real Estate Risk

by Daniel Brouse and Sidd Mukherjee

How Compound Flooding Is Reshaping Property Values, Insurance Availability, and Coastal Habitability

Climate change is creating a new class of real-estate risk in which the physical hazards of flooding increasingly interact with financial, insurance, infrastructure, and housing systems. Sea-level rise, heavier precipitation, and more intense or slower-moving hurricanes are not independent threats. They can interact to produce compound flooding, while the increasing frequency of damaging events can compress the time available for communities, property owners, insurers, and governments to recover.

The consequences extend far beyond the immediate cost of flood damage. As flood frequency increases, historical assumptions about property risk, insurance pricing, mortgage security, infrastructure design, and long-term property values become progressively less reliable. A property that was once considered a low-probability flood risk can become repeatedly exposed to flooding without the physical structure itself changing. As risk is repriced, insurance can become more expensive, less available, or unavailable altogether. Declining insurability can then reduce property values, constrain mortgage lending, discourage investment, weaken local tax bases, and reduce the resources available for infrastructure maintenance and adaptation.

This creates a coupled socioeconomic feedback loop:

Climate Warming → Hazard Intensification → Hazard Coupling → Compound Flooding → Damage and Losses → Insurance Stress → Property-Value Pressure → Reduced Investment → Infrastructure and Resilience Erosion → Greater Vulnerability → Greater Future Losses

A second feedback develops as recovery intervals contract:

Flood Frequency ↑ → Recovery Time Available ↓ → Unresolved Damage ↑ → Vulnerability ↑ → Subsequent Losses ↑

The resulting process is not simply an increase in flood risk. It is a potential transformation of real estate from a relatively stable store of household and institutional wealth into an increasingly climate-sensitive asset whose value, insurability, and financing depend upon the interaction of physical hazards and socioeconomic resilience.

The central argument of this paper is that real estate and insurance may become among the earliest and most visible indicators of cascading climate risk. When insurance becomes unaffordable or unavailable, property values weaken, lenders reassess collateral, investment retreats, and municipalities lose portions of their tax base, the effects of climate change have moved from the physical environment into the financial structure of communities.


1. Introduction: Climate Risk Is Becoming Real-Estate Risk

Climate change is often described in terms of rising temperatures, heavier rainfall, stronger storms, sea-level rise, and increasingly frequent flooding. Yet for households and communities, the most consequential effects may be transmitted through a different system:

Real Estate → Insurance → Mortgage Finance → Investment → Municipal Revenue → Infrastructure → Property Risk

A flood does not have to destroy a property to damage its economic value.

A property can lose value because:

  • flooding becomes more frequent;
  • flood insurance becomes more expensive;
  • insurance coverage becomes difficult to obtain;
  • insurers withdraw from the market;
  • lenders become more cautious;
  • infrastructure becomes less reliable;
  • buyers perceive increasing future risk;
  • investors demand higher returns for greater exposure;
  • municipal finances deteriorate;
  • repeated flooding reduces confidence in long-term habitability.

This changes the nature of climate risk.

The relevant question is no longer simply:

How much physical damage will the next flood cause?

It becomes:

What happens to the economic value and insurability of property when floods repeatedly occur before the community has fully recovered from previous events?

That is a fundamentally different risk problem.


2. Hurricane Harvey: The Beginning of the Feedback Chain

Hurricane Harvey provides a useful illustration of the physical mechanism underlying this emerging financial risk.

In August 2017, Harvey stalled over Texas and produced more than 40 inches of rainfall across a large area. At Nederland, Texas, 60.58 inches of rain was recorded, the largest single rainfall total associated with a tropical cyclone or its remnants in the United States. Damage was estimated at approximately $164 billion in 2026 dollars, with flooding responsible for most of the losses.

Harvey was also a compound-flood event.

Runoff from extreme rainfall moved toward the Gulf while storm surge pushed seawater inland. The elevated coastal water interfered with drainage, producing flooding through the interaction of rainfall runoff and storm surge.

The physical mechanism can therefore be expressed as:

Extreme Rainfall + Runoff + Storm Surge → Drainage Impairment → Compound Flooding

Climate change adds additional forcing:

Climate Warming → Heavier Rainfall + Higher Sea Level + More Intense/Slower Storms → Greater Compound Flood Risk

But the economic cascade begins after the water arrives:

Compound Flooding → Property Damage → Insurance Claims → Insurance Losses → Higher Insurance Costs and Reduced Availability

This is where physical climate risk begins to transform into financial risk.


3. The Three-Way Climate Pressure on Property

Three major mechanisms increasing compound flood risk along the U.S. Atlantic and Gulf coasts:

  1. More intense and slower-moving hurricanes
  2. Increased heavy precipitation as warmer air holds more water vapor
  3. Sea-level rise.

These mechanisms vary geographically.

Across the Gulf of Mexico and Florida, increased rainfall is projected to be the dominant driver in many locations. Across portions of the Southeast and Mid-Atlantic, changes in intense or slow-moving hurricanes become more important. Along the upper Mid-Atlantic and New England coasts, sea-level rise becomes increasingly dominant.

From a real-estate perspective, however, the distinction between the individual drivers may matter less than their combined effect.

The property does not experience three separate balance sheets.

It experiences one risk environment.

The resulting relationship is:

Sea-Level Rise + Extreme Rainfall + Storm Intensification → Compound Flood Risk → Property Risk

The financial system then responds:

Property Risk ↑ → Insurance Risk ↑ → Financing Risk ↑ → Property Value Pressure ↑

This is the beginning of the real-estate cascade.


4. Compound Flooding Creates Nonlinear Property Risk

The Harvey evidence demonstrates why conventional property-risk calculations can become inadequate.

A 2023 study found that approximately 19% of the flood area around Port Arthur, Texas, during Harvey resulted from compound flooding.

Under a scenario involving 0.57 meters of additional sea-level rise and 18% more rainfall, described as plausible around 2050, the compound-flooding area increased to 33%.

Under a scenario involving 1.6 meters of sea-level rise and 50% additional rainfall, described as plausible by 2100, compound flooding increased to 46%, while the number of structures affected was estimated to increase by approximately 23 times compared with 2017.

This is important for property markets because exposure can increase much faster than any single climate variable.

The relevant relationship is:

Climate Forcing ↑ → Hazard Interaction ↑ → Flood Exposure ↑↑ → Property Risk ↑↑

A property market that prices risk based primarily on historical flood frequency may therefore systematically underestimate future exposure.


5. The Return-Period Problem Becomes a Property-Valuation Problem

Real estate depends heavily on expectations about future risk.

A home buyer, mortgage lender, insurer, developer, or investor is effectively making a long-term assessment:

What is the probability that this property will suffer damaging losses during the period in which I own or finance it?

Historically rare floods can become much more frequent as the physical baseline changes.

Research found that human-driven sea-level rise has quadrupled the frequency of coastal sea-level extremes since 1900. At several locations, relative sea-level rise transformed a coastal flood that was a 100-year event in 1900 into an event occurring every five years or less frequently by 2005.

Recent examples illustrate the magnitude of this transformation.

A flood that historically occurred approximately once every ten years occurred:

Charleston → 17 times in 2025

Galveston → 9 times in 2024

Atlantic City → 10 times in 2024

Miami → 14 consecutive days in October 2025

Key West → 26 of 27 days in October 2025

For real estate, this represents a fundamental repricing problem.

A property does not need to be destroyed for its value proposition to change.

If the frequency of disruptive flooding changes from:

Rare → Occasional → Frequent → Persistent

then the economic characteristics of the property can change correspondingly.


6. The Insurance Market Is the First Financial Transmission Mechanism

Insurance is designed to transfer risk.

But insurance markets depend upon the ability to estimate and diversify that risk.

When climate change causes historical loss probabilities to change rapidly, insurers face a fundamental problem:

Historical Risk Models → Changing Climate Baseline → Increasing Loss Uncertainty

The response can take several forms:

Risk ↑ → Premiums ↑

Risk ↑ → Deductibles ↑

Risk ↑ → Coverage Restrictions ↑

Risk ↑ → Capacity ↓

Risk ↑ → Insurer Withdrawal ↑

For individual homeowners, the immediate consequence is affordability.

For the real-estate market, the deeper consequence is insurability.

Insurance availability is not simply another household expense.

It is part of the financial infrastructure supporting property ownership.


7. Insurance Availability Can Become a Property-Value Constraint

A property with affordable insurance can be financed, sold, and occupied relatively normally.

A property with extremely expensive insurance is economically less attractive.

A property that cannot obtain insurance may become difficult to finance.

The chain becomes:

Flood Risk ↑ → Insurance Cost ↑ → Ownership Cost ↑ → Buyer Demand ↓ → Property Value Pressure ↑

But the cascade can become stronger:

Flood Risk ↑ → Insurance Availability ↓ → Mortgage Financing Constraints ↑ → Buyer Pool ↓ → Property Liquidity ↓ → Property Values ↓

This produces a potentially powerful feedback.

As property values decline:

Property Values ↓ → Tax Base ↓ → Municipal Revenue ↓ → Infrastructure Investment Capacity ↓

If infrastructure resilience subsequently deteriorates:

Infrastructure Resilience ↓ → Flood Vulnerability ↑ → Property Risk ↑

The cycle closes:

Property Values ↓ → Tax Base ↓ → Infrastructure Capacity ↓ → Flood Risk ↑ → Insurance Stress ↑ → Property Values ↓

This is a coupled socioeconomic feedback loop.


8. The Insurance–Mortgage–Real Estate Feedback

Insurance and mortgage finance are closely connected.

A mortgage is a long-duration financial claim secured by an asset expected to retain sufficient value to protect the lender.

As flood risk increases, the financial system therefore confronts several interconnected questions:

Can the property be insured?

At what cost?

Will the property retain its value?

Will future buyers be able to obtain financing?

Will the property remain inhabitable?

The resulting feedback can be represented as:

Flood Risk ↑ → Insurance Risk ↑ → Insurance Cost/Availability Deteriorates → Mortgage Risk ↑ → Lending Constraints ↑ → Buyer Demand ↓ → Property Values ↓

The consequences can extend beyond individual homeowners.

Banks and mortgage investors may increasingly need to evaluate climate exposure at the portfolio level.

A geographic concentration of properties exposed to the same flood hazard creates correlated risk.

Unlike independent household losses, a major regional flood can affect thousands or millions of properties simultaneously.

That makes diversification more difficult.


9. Compound Flooding Creates Correlated Insurance Losses

This is one of the most important implications of compound hazards.

Insurance works most effectively when losses are sufficiently diversified.

But compound climate events can create geographically concentrated losses:

Extreme Rainfall + Storm Surge + High Sea Level → Regional Flooding → Thousands of Simultaneous Claims

A major hurricane can therefore produce simultaneous losses across:

  • homes
  • commercial properties
  • vehicles
  • infrastructure
  • businesses
  • utilities
  • municipal facilities

As compound events become more frequent, the financial system can face increasingly correlated losses.

That creates a feedback:

Compound Events ↑ → Correlated Claims ↑ → Insurer Losses ↑ → Pricing Pressure ↑ → Capacity Constraints ↑

This is fundamentally different from a world in which extreme floods are rare and geographically isolated.


10. Return-Period Compression Changes the Insurance Equation

Research examined extreme compound flooding defined as a one-in-100-year storm surge occurring simultaneously with a one-in-100-year rainfall event.

Historically, the combined event had a return period of approximately 200–500 years along the Gulf and southeastern Atlantic coasts and up to 1,000 years or more in parts of New England. Under an extreme warming scenario for 2100, the frequency increased by approximately 7–36 times in the South and 30–195 times farther north.

For insurance markets, the key issue is not the terminology “100-year event.”

The key issue is the frequency of claims-producing events.

If an event once expected to occur once in several centuries begins occurring multiple times within an insurance portfolio’s planning horizon, historical loss assumptions become increasingly unreliable.

Thus:

Return Interval ↓ → Claims Frequency ↑ → Expected Losses ↑ → Premium Pressure ↑ → Insurance Availability ↓


11. Stronger and Slower Hurricanes Increase Insurance Exposure

Our modeling projects the strongest hurricanes could become approximately 15–30% more intense while moving 20–30% more slowly along much of the U.S. coast. The combination increases the probability of simultaneous extreme rainfall and storm tide.

For property markets, this produces multiple simultaneous threats:

Intensity ↑ → Wind Damage ↑

Intensity ↑ → Storm Surge ↑

Intensity ↑ → Rainfall Potential ↑

Translation Speed ↓ → Rainfall Duration ↑

The combined result is:

Stronger + Slower Storms → Wind + Surge + Rainfall → Compound Property Losses

The insurance consequences can therefore be substantially larger than those associated with a simple increase in storm frequency.


12. Inland Property Markets Are Increasingly Exposed

Flood risk is not confined to oceanfront real estate.

Research finds substantial compound-flooding risks farther inland, including along Gulf Coast rivers where high streamflow can interact with storm surge. Increasing evidence suggests compound flooding can be greatest inland near the limit of tidal influence rather than directly at the coast.

A 2026 preprint found substantial increases in the probability of compound wind and precipitation extremes both within 100 kilometers of the coast and 100–500 kilometers inland under an extreme warming projection.

The significance for real estate is considerable.

Flood risk can migrate geographically.

Coastal Risk → Inland Watershed Risk → Inland Property Exposure

Communities that historically considered themselves outside the principal flood-risk zone can increasingly encounter climate-driven flooding.

That creates a major valuation problem because local markets may have little historical experience with these events.


13. Urban Flooding Creates a New Real-Estate Risk

Urban flooding introduces another dimension.

Extreme precipitation can overwhelm drainage systems even where properties are far from coastlines and major rivers.

The risk can become particularly acute in below-grade housing.

Extreme Rainfall → Stormwater System Overload → Rapid Urban Flooding → Basement/Below-Grade Exposure → Life-Safety Risk

This matters to real estate because conventional flood-risk perceptions often emphasize proximity to rivers, coastlines, or mapped floodplains.

But intense rainfall can create dangerous flooding through overwhelmed urban drainage systems.

As a result:

Flood Risk ≠ Coastal Risk Alone

Increasingly:

Flood Risk = Coastal + Riverine + Pluvial + Urban + Compound Risk

This expansion complicates property valuation, insurance underwriting, and municipal planning.


14. Recovery Deficit Is the Hidden Variable

The most important variable in cascading real-estate risk may not be flood magnitude.

It may be recovery time.

Consider:

Flood A → Damage → Partial Recovery → Flood B → Additional Damage → Partial Recovery → Flood C

If each event arrives before full recovery, unresolved losses accumulate.

A conceptual relationship is:

Resilience(t+1) = Resilience(t) + Recovery(t) − Damage(t)

When:

Recovery > Damage → Resilience Restored

But when:

Damage > Recovery → Resilience Declines

This creates a critical threshold:

Damage Rate > Recovery Rate

Once that condition persists, the system enters a recovery deficit.

For real estate, the consequences include:

Unrepaired Properties → Deferred Maintenance → Lower Property Quality → Lower Values → Reduced Investment → Greater Vulnerability

The property market therefore becomes a mechanism through which physical climate shocks can accumulate.


15. Repeated Flooding Can Produce a Negative Wealth Feedback

Homeownership represents a substantial component of household wealth.

Repeated climate-related losses can therefore create a feedback involving household balance sheets.

Flooding ↑ → Repair Costs ↑ → Insurance Costs ↑ → Property Values ↓ → Household Equity ↓ → Financial Resilience ↓

Lower household financial resilience can make recovery more difficult:

Financial Resilience ↓ → Delayed Repairs → Property Condition ↓ → Property Value ↓

The resulting loop becomes:

Flood Risk ↑ → Property Damage ↑ → Household Wealth ↓ → Recovery Capacity ↓ → Property Vulnerability ↑ → Future Losses ↑

This is particularly significant in communities where property represents a large share of household net worth.

Climate risk can therefore become wealth risk.


16. The Municipal Feedback Loop

The consequences do not stop at individual properties.

Municipal governments depend heavily on property values and economic activity.

A potential cascade is:

Flood Frequency ↑ → Property Damage ↑ → Property Values ↓ → Tax Base ↓ → Municipal Revenue ↓

The municipality then has fewer resources available for:

  • drainage improvements
  • flood defenses
  • road repair
  • stormwater systems
  • emergency response
  • public infrastructure maintenance
  • adaptation

This can produce:

Municipal Revenue ↓ → Infrastructure Investment ↓ → Resilience ↓ → Flood Damage ↑

The feedback closes:

Flood Risk ↑ → Property Values ↓ → Tax Base ↓ → Infrastructure Capacity ↓ → Flood Vulnerability ↑ → Property Risk ↑

At this point, the climate hazard has become embedded in the fiscal condition of the community.


17. The Insurance–Property–Infrastructure Feedback

The major feedback loops can be integrated into a single system:

Climate Warming → Hazard Intensification → Hazard Coupling → Compound Flooding → Physical Damage → Insurance Losses → Premiums/Availability Pressure → Property Value Decline → Investment Decline → Tax Base Erosion → Infrastructure Investment Decline → Resilience Erosion → Greater Flood Vulnerability → Greater Future Losses

This is the core cascading-risk mechanism.

The system is not linear.

Each component can alter the conditions affecting the next component.

The physical climate hazard creates the initial disturbance.

The socioeconomic system can then amplify the disturbance.


18. Insurance May Become an Early-Warning System for Climate Risk

Insurance markets have an unusual role in this transition.

They continuously translate physical risk into financial pricing.

Consequently, insurance-market changes may provide an early indicator of emerging real-estate instability.

The sequence may be:

Physical Risk ↑ → Actuarial Risk ↑ → Premiums ↑ → Deductibles ↑ → Coverage Restrictions ↑ → Insurer Withdrawal ↑

These signals can appear before large-scale property abandonment.

A community may therefore be approaching a real-estate resilience threshold even when most houses remain physically intact.

The early warning may instead appear as:

Insurance Availability ↓

Insurance Affordability ↓

Mortgage Availability ↓

Property Transactions ↓

Investment ↓

Property Values ↓

This suggests that insurance markets should be viewed not merely as financial institutions absorbing climate losses, but as risk sensors embedded within the real-estate system.


19. The Property-Value Feedback Can Accelerate

Once buyers begin incorporating future flood risk into property decisions, market expectations can change.

The feedback can become:

Flood Frequency ↑ → Risk Perception ↑ → Buyer Demand ↓ → Property Values ↓

Lower values can then produce additional effects:

Property Values ↓ → Equity ↓ → Investment ↓ → Maintenance ↓ → Vulnerability ↑

And:

Property Values ↓ → Tax Base ↓ → Public Infrastructure Investment ↓ → Vulnerability ↑

And:

Flood Risk ↑ → Insurance Costs ↑ → Total Cost of Ownership ↑ → Buyer Demand ↓ → Property Values ↓

The system therefore contains multiple reinforcing loops operating simultaneously.

This is what distinguishes a coupled-feedback system from a simple hazard-impact model.


20. The Sandy Example: An Accelerating Financial Risk Clock

Research found that a Sandy-like event in New York City, estimated at approximately once every 150 years in the current climate, could become approximately a once-in-65-year event by 2050 and once-in-30-year event by 2100 under the emissions scenario studied.

From a real-estate perspective, the significance is not simply that the probability of flooding increases.

The economic life of a mortgage, insurance policy, or property investment may span decades.

A hazard that occurs once every 150 years has a very different economic significance from one occurring once every 30 years.

Thus:

Return Interval ↓ → Probability of Loss During Ownership ↑ → Insurance Risk ↑ → Mortgage Risk ↑ → Property Risk ↑

The longer the investment horizon, the more consequential the changing hazard frequency becomes.


21. Sea-Level Rise Creates a Persistent Baseline Shift

Sea-level rise differs from many episodic hazards because it permanently alters the starting point from which future storms occur.

A higher ocean means:

Higher Baseline Water Level → Greater Storm-Surge Reach → Greater Flood Exposure

And:

Sea-Level Rise → Less Drainage Capacity → Greater Interaction Between Runoff and Surge

This means that even if a future storm were identical to a historical storm, its consequences could be different because it would occur against a changed physical baseline.

For property markets:

Sea-Level Rise → Persistent Risk Increase → Long-Term Property Exposure ↑

This is particularly important for real estate because buildings and infrastructure have long lifetimes.


22. The Coastal Property Paradox

Coastal property can remain economically attractive even while its physical risk is increasing.

That creates a potential divergence:

Amenity Value ↑

while:

Climate Risk ↑

For a period, rising demand may conceal increasing physical risk.

But eventually the financial system may begin incorporating the changing risk more aggressively.

The transition can be:

Physical Risk ↑ → Insurance Cost ↑ → Ownership Cost ↑ → Market Awareness ↑ → Buyer Demand ↓ → Property Values ↓

The result may be a delayed repricing.

Real estate markets do not necessarily respond immediately to slowly accumulating physical risk.

Insurance markets, however, may respond sooner because they must continually price expected losses.

This creates the possibility that:

Insurance repricing precedes real-estate repricing.


23. When Insurance Becomes Unaffordable, the Market Changes

Insurance affordability is particularly important because homeowners do not experience insurance as an abstract actuarial variable.

They experience it as part of the cost of owning a property.

The relevant relationship is:

Mortgage + Property Tax + Insurance + Maintenance + Expected Climate Losses = Cost of Ownership

If insurance premiums rise dramatically:

Insurance Cost ↑ → Total Cost of Ownership ↑

The property must either:

Price ↓

or:

Buyer Demand ↓

or both.

If insurance becomes unavailable:

Insurance Availability ↓ → Financing Constraints ↑ → Buyer Pool ↓ → Market Liquidity ↓

The property may remain physically valuable, but its economic utility as a financed asset declines.


24. From Insurability to Habitability

Insurance is not the only threshold.

Eventually, repeated flooding can affect whether a community remains economically and physically viable.

At the most susceptible U.S. sites, the odds of a one-in-50-year coastal flood could approximately double every five years under continuing sea-level rise. It also notes that many U.S. coastal engineering systems were designed around return periods of roughly 50–100 years.

As historically rare floods become increasingly frequent, the question changes.

It is no longer:

Can we recover from a flood?

It becomes:

Can we maintain a functioning community between floods?

That is the transition from flood risk to habitability risk.


25. The Real-Estate Resilience Threshold

A useful conceptual threshold is:

Insurance Cost + Expected Flood Losses + Infrastructure Costs > Property’s Economic Value Proposition

When this condition becomes persistent, the property may remain physically habitable while becoming economically unattractive.

A second threshold occurs when:

Damage Rate > Recovery Rate

At that point, the property or community cannot fully restore itself between successive events.

A third threshold may emerge when:

Protection Cost > Property Value / Tax Base / Available Capital

At that point, continued protection may become economically difficult.

These thresholds can interact:

Flood Risk ↑ → Insurance Cost ↑ → Property Value ↓ → Tax Base ↓ → Protection Capacity ↓ → Flood Risk ↑

This is a cascading threshold system.


26. From Property Decline to Retreat

The ultimate consequence need not be sudden abandonment.

A more realistic process may occur gradually:

Flood Frequency ↑ → Insurance Stress ↑ → Property Values Stagnate → Investment Declines → Maintenance Declines → Infrastructure Deteriorates → Insurance Availability Declines Further → Property Values Fall → Population Outmigration ↑

Eventually:

Population Decline → Tax Base Decline → Infrastructure Capacity Decline → Resilience Decline

At some point, adaptation may become economically preferable to continued protection.

This can lead to:

Protection → Adaptation → Managed Retreat → Abandonment

The timing and geographic extent of such transitions will vary considerably by location.

The key point is that the transition can be driven not by a single catastrophic flood but by cumulative climate risk interacting with economic feedbacks.


27. The Complete Coupled-Feedback / Cascading Real-Estate Framework

The emerging system can be represented as:

Warming → Hazard Intensification → Hazard Coupling → Compound Flooding → Damage → Insurance Losses → Insurance Cost/Availability Pressure → Property-Value Pressure → Reduced Investment → Tax-Base Erosion → Infrastructure Resilience Decline → Greater Vulnerability → Greater Future Losses

A second loop operates through recovery:

Flood Frequency ↑ → Recovery Window ↓ → Unresolved Damage ↑ → Resilience ↓ → Vulnerability ↑ → Subsequent Damage ↑ → Recovery Window ↓

A third loop operates through insurance:

Flood Risk ↑ → Expected Losses ↑ → Premiums ↑ / Coverage ↓ → Cost of Ownership ↑ → Buyer Demand ↓ → Property Values ↓ → Insurer/Lender Risk ↑ → Insurance and Financing Constraints ↑

A fourth operates through municipal finance:

Property Values ↓ → Tax Base ↓ → Municipal Revenue ↓ → Infrastructure Investment ↓ → Resilience ↓ → Flood Risk ↑ → Property Values ↓

These feedbacks are interconnected.

Together they create:

Climate Forcing → Physical Hazard Coupling → Financial Amplification → Resilience Erosion → Cascading Real-Estate Risk


28. A New Definition of Climate-Exposed Property Risk

Traditional real-estate risk often focuses on:

Location + Structure + Historical Flood Zone

A future-oriented model must incorporate additional variables:

Flood Frequency

Compound-Hazard Probability

Sea-Level Rise

Extreme Precipitation

Storm Intensity and Translation Speed

Insurance Availability

Insurance Affordability

Mortgage Availability

Infrastructure Resilience

Recovery Capacity

Property-Value Trajectory

Municipal Fiscal Capacity

The risk of a property is therefore not simply its probability of flooding.

A more comprehensive conceptual formulation is:

Real-Estate Climate Risk ∝ Hazard Exposure × Hazard Coupling × Vulnerability × Insurance Stress × Recovery Deficit

Again, this is a conceptual framework rather than a validated predictive equation.

Its purpose is to recognize that physical exposure and financial vulnerability can amplify one another.


29. Why Historical Property Valuation Models May Become Increasingly Unreliable

A property valuation based heavily on historical comparable sales assumes that the past provides meaningful information about future risk.

But if the climate baseline is changing:

Historical Flood Frequency ≠ Future Flood Frequency

And therefore:

Historical Property Risk ≠ Future Property Risk

This creates the potential for a valuation lag.

A property may continue selling at prices based on historical assumptions even as:

Flood Frequency ↑

Insurance Cost ↑

Infrastructure Stress ↑

Future Risk ↑

The market can therefore experience a delayed repricing once these factors become visible to buyers, lenders, and insurers.

The longer the delay, the greater the possibility of a discontinuous adjustment.


30. The Central Role of Insurance in Price Discovery

Insurance markets can force climate risk into property economics because they must continually reassess expected losses.

This creates a potentially important sequence:

Physical Climate Change → Insurance Repricing → Mortgage Reassessment → Buyer Reassessment → Property Repricing

In this framework, insurance functions as an intermediary between the climate system and the real-estate market.

This makes insurance availability and affordability among the most important indicators to monitor.

A deteriorating insurance market can signal that the physical risk has become financially material even before large-scale property abandonment occurs.


31. The Emerging Climate-Real-Estate Feedback

The broader system can therefore be summarized as:

Physical System

Warming → Sea-Level Rise + Heavier Rainfall + Stronger/Slower Storms → Compound Flooding

Insurance System

Compound Flooding → Claims → Losses → Premium Increases + Coverage Restrictions + Reduced Capacity

Real-Estate System

Insurance Stress → Cost of Ownership ↑ → Buyer Demand ↓ → Property Values ↓

Financial System

Property Values ↓ → Mortgage Risk ↑ → Lending Constraints ↑ → Investment ↓

Municipal System

Property Values ↓ → Tax Base ↓ → Infrastructure Investment ↓

Resilience System

Infrastructure Investment ↓ → Flood Vulnerability ↑

The loop closes:

Flood Vulnerability ↑ → Compound Flood Risk ↑

This is a coupled climate-financial feedback loop.


32. The Difference Between a Disaster and a Cascading Risk

A conventional disaster model begins and ends with the event:

Storm → Flood → Damage → Recovery

The cascading-risk model is different:

Storm → Compound Flood → Damage → Insurance Loss → Financial Stress → Property-Value Decline → Tax-Base Erosion → Infrastructure Stress → Reduced Resilience → Greater Vulnerability → Next Flood → Greater Damage

The disaster is therefore no longer an isolated event.

It becomes a state-changing event.

Each major flood can alter the economic and physical conditions under which the next flood occurs.

This makes the system path dependent.


33. The Most Important Variable May Be the Time Between Disasters

“The Floods of the Future Won’t Come One at a Time”—captures the central problem.

The issue is not simply that flood events become more severe.

It is that the interval between them can become shorter.

The resulting relationship is:

Flood Frequency ↑ + Recovery Time Constant → Recovery Window ↓

Then:

Recovery Window ↓ + Damage Per Event ↑ → Recovery Deficit ↑

Then:

Recovery Deficit ↑ → Property Condition ↓ + Infrastructure Condition ↓ + Financial Resilience ↓

Then:

Resilience ↓ → Consequences of the Next Flood ↑

This is the mechanism through which frequency becomes amplification.


34. From Compound Flooding to Cascading Real-Estate Instability

The complete process can now be expressed in one horizontal chain:

Warming → Hazard Intensification → Hazard Coupling → Compound Flooding → More Frequent Losses → Insurance Stress → Higher Cost of Ownership → Reduced Buyer Demand → Property-Value Decline → Mortgage and Investment Stress → Tax-Base Erosion → Infrastructure Resilience Decline → Recovery Deficit → Greater Future Flood Vulnerability → Cascading Real-Estate Instability

This is the central thesis of the paper.

The most important climate consequence for real estate may not be the destruction of individual properties.

It may be the progressive deterioration of the economic conditions that make those properties insurable, financeable, maintainable, and desirable.


35. Conclusion: When Climate Risk Becomes Property Risk

The emerging flood threat is fundamentally different from the historical model of isolated disasters.

Climate change is increasing the potential for:

Sea-Level Rise + Heavy Rainfall + Stronger/Slower Hurricanes → Compound Flooding

At the same time:

Flood Frequency ↑ → Recovery Windows ↓

These physical changes increasingly interact with:

Insurance

Mortgage Finance

Property Markets

Municipal Finance

Infrastructure

Household Wealth

The resulting system can develop reinforcing feedbacks:

Flood Risk ↑ → Insurance Stress ↑ → Property Values ↓ → Investment ↓ → Infrastructure Resilience ↓ → Flood Vulnerability ↑

and:

Flood Frequency ↑ → Recovery Deficit ↑ → Resilience ↓ → Future Losses ↑

These feedbacks create the possibility of nonlinear and cascading consequences.

The immediate manifestation may be rising insurance premiums, shrinking insurance availability, higher deductibles, declining property demand, or increasing difficulty obtaining mortgages.

The next stage may be declining property values and reduced investment.

The subsequent stage may involve weakening municipal tax bases, deteriorating infrastructure, and increasing difficulty financing adaptation.

The final stage in the most vulnerable locations could involve managed retreat, population displacement, and abandonment.

The critical transition is therefore:

Climate Risk → Insurance Risk → Real-Estate Risk → Financial Risk → Municipal Risk → Resilience Risk → Cascading Systemic Risk

This suggests that real estate and insurance markets should be treated as critical components of the climate system’s socioeconomic response.

Insurance is not merely a mechanism for paying claims after a disaster. It is a mechanism for translating physical risk into financial information.

Real estate is not merely a collection of buildings. It is a store of household wealth, collateral for debt, a source of municipal revenue, and the foundation of local economic activity.

When the physical climate changes, these interconnected systems change with it.

The most consequential question is therefore not simply:

Will a property flood?

It is:

Will the property remain insurable, financeable, valuable, maintainable, and economically viable as the probability of flooding changes?

That is the central real-estate question of the emerging climate era.

The ultimate risk is not a single catastrophic flood.

It is the transition from:

Rare Disaster → Recurrent Hazard → Compound Flooding → Insurance Stress → Property Repricing → Investment Retreat → Resilience Erosion → Cascading Real-Estate Risk

When floods begin arriving faster than properties, infrastructure, insurers, lenders, governments, and communities can adapt, the flood itself becomes only the initiating event.

The deeper crisis is the progressive erosion of the economic and institutional systems that allow a place to remain habitable and investable.

In that sense, the future of climate-exposed real estate may be determined less by whether a property floods once than by whether the surrounding system can continue to recover between floods.

The flood becomes the trigger.
Insurance becomes the transmission mechanism.
Real estate becomes the financial amplifier.
Resilience becomes the limiting factor.
And cascading risk becomes the ultimate consequence.
bookmark_borderHigh-Risk U.S. Real Estate Regions Under the Multiplicative Climate Risk Framework

by Daniel Brouse and Sidd Mukherjee

The Multiplicative Climate Risk Formula

The Multiplicative Climate Risk Formula is a real-estate climate-risk model designed to capture how multiple hazards and vulnerabilities can interact and compound rather than occur independently. The framework incorporates interconnected risks including sea-level rise, storm surge, extreme precipitation, flooding, hydroclimatic whiplash, wildfires, drought, extreme heat, hurricanes, landslides, avalanches, and other cascading hazards.

Rather than treating each hazard as an isolated threat, the model evaluates how hazard exposure, hazard coupling, structural vulnerability, insurance stress, and recovery deficits can multiply overall real-estate risk.

The central premise is simple:

Climate risk is not merely additive. When multiple vulnerabilities interact, their combined impact can be substantially greater than the sum of their individual effects.

Applying the Multiplicative Climate Risk Formula reveals an important characteristic of climate-driven real-estate risk: the highest-risk regions are not necessarily those experiencing the most dramatic individual weather events. The greatest systemic risk emerges where multiple risk dimensions interact and amplify one another.

A region can experience severe hurricanes, wildfires, flooding, or extreme heat without necessarily experiencing the highest level of cascading real-estate risk. The critical question is what happens when physical hazards interact with high exposure, hazard coupling, structural vulnerability, insurance-market stress, and limited recovery capacity.

The framework therefore evaluates five interacting dimensions:

Hazard Exposure × Hazard Coupling × Vulnerability × Insurance Stress × Recovery Deficit = Multiplicative Climate Risk

Each component is scored from 1 to 5, where:

1 = Low Risk

2 = Moderate-Low Risk

3 = Moderate Risk

4 = High Risk

5 = Extreme Risk

The resulting score is not a probability of loss or a conventional actuarial measure. It is a comparative systems-risk index designed to identify locations where multiple weaknesses can reinforce one another.

This distinction is critical.

A region with a score of 5 in one category but relatively low scores elsewhere may be less systemically exposed than a region scoring 4 or 5 across nearly every category.

The multiplicative framework captures that interaction:

Physical Hazard ↑ + Coupling ↑ + Vulnerability ↑ + Insurance Stress ↑ + Recovery Capacity ↓ → Cascading Real-Estate Risk ↑↑

The following ranking represents a comparative assessment of major U.S. real-estate risk regions, incorporating physical hazards and the increasingly important financial and institutional dimensions of climate exposure.


1. Gulf Coast & Southern Florida

The Compound-Compounding Zone

Hazard Exposure — 5/5

The Gulf Coast and southern Florida face some of the country’s most concentrated combinations of acute and chronic climate hazards.

These include:

Major Hurricanes + Storm Surge + Extreme Rainfall + Sea-Level Rise + Coastal Flooding + Extreme Heat

The region’s vulnerability is not based on any single hazard. It is the convergence of multiple hazards affecting a densely developed coastal real-estate market.

Hazard Coupling — 5/5

The defining characteristic is the interaction among hazards.

A tropical cyclone can simultaneously produce:

Storm Surge + Extreme Rainfall + River Flooding + High Winds

Sea-level rise increases the baseline upon which storm surge occurs, while extreme rainfall can overwhelm drainage systems at the same time that elevated coastal water levels restrict drainage.

The resulting process is:

Hurricane → Storm Surge + Extreme Rainfall → Drainage Impairment → Compound Flooding → Widespread Property Exposure

This is precisely the type of coupled hazard that can produce disproportionate economic consequences.

Vulnerability — 4/5

The region contains enormous quantities of residential, condominium, commercial, and infrastructure assets exposed to coastal and flood hazards.

Building age and construction standards vary substantially. Newer construction and mitigation measures can reduce vulnerability, while older structures and properties with inadequate flood, wind, or drainage protection remain substantially more exposed.

The critical issue is therefore not simply the age of the housing stock, but the mismatch between:

Long-Lived Real Estate Assets → Rapidly Changing Climate Risk

Insurance Stress — 5/5

Insurance is one of the most consequential real-estate constraints in the region.

The combination of hurricanes, storm surge, flooding, wind damage, sea-level rise, and repeated catastrophe losses places substantial pressure on insurance availability and affordability.

The resulting feedback is:

Climate Risk ↑ → Expected Losses ↑ → Insurance Premiums ↑ → Deductibles and Coverage Restrictions ↑ → Insurance Availability ↓

For homeowners, insurance costs directly increase the cost of ownership.

For commercial real estate, rising insurance expenses can reduce net operating income and asset values by increasing operating costs. The effect is particularly significant for multifamily, hospitality, retail, and other income-producing properties.

The insurance problem therefore extends beyond individual policies.

It becomes a real-estate valuation problem:

Insurance Cost ↑ → Cost of Ownership ↑ → Buyer Demand ↓ → Property Values ↓

Recovery Deficit — 4/5

The region’s substantial public and private capital resources provide recovery capacity, but the scale of the infrastructure challenge is enormous.

Long-term pressures include:

Flood-Control Systems + Pump Stations + Drainage Networks + Seawalls + Roads + Bridges + Utilities + Wastewater Systems

The concern is not whether these systems can recover from one disaster.

The concern is whether:

Repeated Damage > Available Recovery and Adaptation Capacity

If the frequency of major events increases faster than infrastructure can be repaired, upgraded, or relocated, a recovery deficit can develop.

Multiplicative Risk

5 × 5 × 4 × 5 × 4 = 2,000

Total Risk Factor: 2,000

The Gulf Coast and southern Florida therefore represent the most pronounced example of compound climate-real-estate risk in the framework.


2. Central & Southern California Wildland-Urban Interface

The Fire–Flood–Insurance Cascade Zone

Hazard Exposure — 4/5

The Central and Southern California WUI faces a combination of:

Wildfire + Extreme Heat + Drought + Water Stress + Extreme Rainfall

The exposure is particularly consequential because enormous quantities of residential real estate have been constructed adjacent to or within wildfire-prone landscapes.

Hazard Coupling — 5/5

The defining feedback is:

Drought → Vegetation Stress → Wildfire → Vegetation Loss → Soil Destabilization → Extreme Rainfall → Mudslides and Debris Flows

This is a classic sequential compound-risk mechanism.

Wildfire does not simply produce immediate property losses.

It can alter the landscape in ways that increase the consequences of subsequent precipitation events.

The result is:

Wildfire → Landscape Transformation → Increased Post-Fire Flood/Mudslide Risk

This creates a risk cascade extending beyond the original fire.

Vulnerability — 4/5

Residential development in steep terrain, narrow canyons, and areas with constrained evacuation routes can create substantial exposure.

Vulnerability also depends on construction standards, defensible space, vegetation management, access routes, and the ability of communities to recover rapidly after catastrophic fires.

Insurance Stress — 5/5

California represents one of the clearest examples of insurance-market stress becoming a real-estate problem.

The combination of catastrophic wildfire exposure, rapidly changing risk conditions, and repeated losses creates pressure on insurers to increase premiums, restrict coverage, reduce exposure, or withdraw from high-risk markets.

When private insurance becomes unavailable or unaffordable, property owners may be forced into residual or state-backed insurance mechanisms.

The resulting feedback is:

Wildfire Risk ↑ → Insurance Losses ↑ → Premiums ↑ → Coverage Restrictions ↑ → Private Insurance Availability ↓ → Residual-Market Dependence ↑

This creates a second real-estate feedback:

Insurance Availability ↓ → Financing Constraints ↑ → Buyer Pool ↓ → Property Liquidity ↓ → Property Values ↓

The insurance problem can therefore become a leading indicator of broader real-estate repricing.

Recovery Deficit — 4/5

Large wildfire events can produce extensive reconstruction requirements simultaneously.

The recovery system must contend with:

Destroyed Housing + Infrastructure Damage + Debris Removal + Labor Requirements + Construction Demand + Supply Constraints

The resulting competition for labor and materials can extend rebuilding timelines and increase reconstruction costs.

The longer recovery takes, the greater the potential for:

Recovery Delay → Business Interruption → Household Displacement → Reduced Local Economic Activity → Reduced Community Resilience

Multiplicative Risk

4 × 5 × 4 × 5 × 4 = 1,600

Total Risk Factor: 1,600

The California WUI therefore represents a particularly important example of insurance availability becoming a leading indicator of real-estate climate risk.


3. Coastal Texas

The Industrial and Commercial Risk Hub

Hazard Exposure — 4/5

Coastal Texas faces:

Hurricanes + Storm Surge + Extreme Rainfall + Flash Flooding + Extreme Heat + Grid Stress

The region’s importance is amplified by its enormous concentration of industrial, commercial, petrochemical, port, logistics, and residential assets.

Hazard Coupling — 4/5

The physical hazards can interact through several pathways.

For example:

Extreme Heat → Electricity Demand ↑ → Grid Stress ↑ → Power Disruption → Cooling/Industrial/Commercial Disruption

At the same time:

Hurricane → Wind + Surge + Rainfall → Flooding + Power Loss → Business Interruption

And:

Flooding + Heat + Power Loss → Mold + Water Damage + Equipment Failure + Building-System Damage

This produces a multi-system cascade rather than a single flood loss.

Vulnerability — 4/5

Coastal Texas contains enormous concentrations of development and infrastructure in flood-prone and low-lying areas.

Impervious surfaces can increase runoff, while dense development can make drainage problems more consequential.

The concentration of industrial and commercial assets also creates correlated economic risk.

A single major event can affect multiple businesses, transportation systems, suppliers, utilities, and customers simultaneously.

Insurance Stress — 4/5

Insurance costs and coverage limitations are becoming an increasingly important component of real-estate risk.

Wind, hail, hurricane, flood, and business-interruption exposures can produce substantial premiums and deductibles.

As insurers reassess catastrophe exposure, property owners can increasingly absorb a greater portion of the risk through:

Higher Deductibles + Coverage Restrictions + Increased Premiums + Greater Self-Insurance

For commercial real estate, increasing insurance expenses directly affect:

Operating Expenses ↑ → NOI ↓ → Capitalization Value ↓

This provides a direct financial transmission mechanism between climate risk and commercial property valuation.

Recovery Deficit — 3/5

Coastal Texas possesses substantial private capital and strong economic capacity, which can accelerate reconstruction.

However, public infrastructure and regional systems can take much longer to repair.

The result is a two-speed recovery:

Private Capital → Rapid Property Recovery

while:

Public Infrastructure → Slower System Recovery

This creates a temporary resilience gap.

Multiplicative Risk

4 × 4 × 4 × 4 × 3 = 768

Total Risk Factor: 768

Coastal Texas represents an important example of how high-value commercial real estate can convert physical climate exposure into large-scale correlated financial losses.


4. Mississippi River Delta & Inland Waterways

The Structural-Aging and Recovery-Deficit Zone

Hazard Exposure — 3/5

The Mississippi Delta and associated inland waterways face:

River Flooding + Extreme Rainfall + Severe Convective Storms + Subsidence + Coastal Flooding

The region’s raw hazard exposure is lower than some Gulf Coast locations, but the interaction of hazards with infrastructure and socioeconomic vulnerability dramatically increases systemic risk.

Hazard Coupling — 3/5

One important pathway is:

Upstream Extreme Rainfall → River Discharge ↑ → Downstream Flooding → Prolonged Inundation → Structural and Infrastructure Damage

In coastal portions of the Delta, this can interact with:

River Flooding + Storm Surge + Sea-Level Rise → Compound Inland/Coastal Flooding

The duration of inundation can be as important as peak water depth because prolonged water exposure can increase mold, structural deterioration, electrical damage, and infrastructure failure.

Vulnerability — 5/5

This region’s primary vulnerability is structural.

Risk is amplified by:

Aging Infrastructure + Levee Dependence + Aging Buildings + Economic Constraints + Limited Local Fiscal Capacity

The critical issue is not simply whether flood-control infrastructure exists.

It is whether that infrastructure can be maintained, upgraded, and replaced at the rate required under changing climate conditions.

Insurance Stress — 4/5

Flood insurance is an essential component of property financing in designated high-risk areas where federal requirements apply.

However, the availability and affordability of private flood coverage can vary substantially by location and risk profile.

Where private coverage is limited, property owners can become increasingly dependent on federal flood insurance and other residual mechanisms.

This creates another form of concentration risk:

Private Insurance Capacity ↓ → Public Backstop Dependence ↑

The problem becomes more acute when repeated losses increase premiums, deductibles, or coverage restrictions faster than property values and household incomes can absorb them.

Recovery Deficit — 5/5

This is the region’s defining weakness.

A major flood can produce:

Property Damage → Income Loss → Reduced Local Tax Revenue → Infrastructure Damage → Limited Local Recovery Capacity

Federal disaster assistance can be essential, but administrative processes, funding requirements, and reconstruction complexity can extend recovery timelines.

The resulting feedback can become:

Low Local Fiscal Capacity → Slow Recovery → Persistent Damage → Lower Property Values → Lower Tax Base → Even Lower Recovery Capacity

Multiplicative Risk

3 × 3 × 5 × 4 × 5 = 900

Total Risk Factor: 900

This produces an important result:

The Mississippi Delta scores lower than Coastal Texas in raw hazard exposure but higher in total multiplicative risk.

That is precisely why a multiplicative framework is useful.

A moderate physical hazard can produce extreme systemic risk when combined with high vulnerability and a severe recovery deficit.


5. Urban Northeast Corridor

The Legacy-Infrastructure and Urban-Flooding Zone

Hazard Exposure — 3/5

The urban Northeast faces:

Nor’easters + Extreme Rainfall + Tidal Flooding + Sea-Level Rise + Urban Flash Flooding

The region does not necessarily experience the most extreme individual climate hazards in the country.

Its risk derives from density, infrastructure age, and enormous concentrations of economic value.

Hazard Coupling — 4/5

A central pathway is:

Sea-Level Rise → Higher Coastal Baseline → Reduced Stormwater Drainage Capacity → Heavy Rainfall → Urban Flooding

The resulting flooding can affect:

Basements + Subways + Tunnels + Electrical Systems + Transportation Networks + Commercial Districts

This creates a particularly important urban cascade:

Extreme Rainfall → Stormwater Overload → Transit Disruption → Workforce Disruption → Business Interruption → Economic Loss

Vulnerability — 4/5

The region contains extraordinary quantities of legacy infrastructure and older real estate.

Many structures were designed under climate conditions substantially different from those now emerging.

Below-grade spaces can be especially vulnerable:

Basement Housing + Electrical Rooms + Subway Infrastructure + Underground Transportation

This makes the region highly sensitive to intense precipitation even when properties are not located directly adjacent to rivers or coastlines.

Insurance Stress — 3/5

Insurance remains more available than in the most stressed coastal and wildfire markets, but the trajectory remains important.

Increasing flood claims, basement losses, storm damage, and infrastructure disruption can gradually increase premiums and deductibles.

The principal concern is therefore not an immediate insurance-market collapse but gradual repricing of urban climate exposure.

The feedback is:

Urban Flood Risk ↑ → Claims ↑ → Insurance Costs ↑ → Cost of Ownership ↑ → Property-Value Pressure ↑

Recovery Deficit — 2/5

The Northeast possesses comparatively strong municipal tax bases, financial resources, infrastructure institutions, and access to federal resources.

This provides substantial recovery capacity.

However, the scale and age of infrastructure create long-term adaptation challenges.

The region’s primary weakness is therefore not immediate recovery capacity but the enormous cost of modernizing legacy systems before they become repeatedly overwhelmed.

Multiplicative Risk

3 × 4 × 4 × 3 × 2 = 288

Total Risk Factor: 288

The Urban Northeast demonstrates that high population density and high property values do not automatically produce the highest multiplicative risk.

Strong fiscal and institutional recovery capacity can substantially reduce systemic risk.


Real-Estate Climate Risk Comparison Matrix

The following matrix applies the five-factor multiplicative framework:

RegionHazard ExposureHazard CouplingVulnerabilityInsurance StressRecovery DeficitMultiplicative Risk
1. Gulf Coast & Southern Florida554542,000
2. California WUI454541,600
3. Mississippi River Delta & Inland Waterways33545900
4. Coastal Texas44443768
5. Urban Northeast Corridor34432288

Why the Ranking Matters

The ranking demonstrates why climate-driven real-estate risk cannot be measured solely by the severity of weather.

The Mississippi Delta provides the clearest example.

Its 3/5 hazard-exposure score is lower than Coastal Texas’s 4/5, yet its overall multiplicative score is higher:

Mississippi Delta → 900

Coastal Texas → 768

The difference arises from the interaction of:

High Vulnerability + High Insurance Stress + Severe Recovery Deficit

This is the essence of cascading risk.

A region does not need to have the most extreme weather to have the greatest systemic vulnerability.

It needs to have the most dangerous combination of interacting weaknesses.


The Central Insurance Feedback

Across the five regions, insurance functions as one of the primary transmission mechanisms connecting physical climate risk to real-estate values.

The feedback can be represented as:

Climate Risk ↑ → Expected Losses ↑ → Insurance Claims ↑ → Premiums ↑ → Deductibles ↑ → Coverage Restrictions ↑ → Insurance Availability ↓ → Cost of Ownership ↑ → Property Demand ↓ → Property Values ↓

Once property values begin declining, another feedback can emerge:

Property Values ↓ → Mortgage Collateral ↓ → Lending Risk ↑ → Financing Constraints ↑ → Buyer Pool ↓ → Property Liquidity ↓ → Property Values ↓

Insurance therefore does not merely compensate property owners after losses.

It can influence whether a property can be:

Owned → Financed → Sold → Developed → Maintained → Insured

This makes insurance availability and affordability a critical component of real-estate climate risk.


The Major Coupled Feedback Loops

1. Insurance–Property Value Feedback

Climate Risk ↑ → Insurance Losses ↑ → Premiums ↑ / Availability ↓ → Cost of Ownership ↑ → Buyer Demand ↓ → Property Values ↓


2. Property Value–Tax Base Feedback

Property Values ↓ → Tax Base ↓ → Municipal Revenue ↓ → Infrastructure Investment ↓ → Resilience ↓ → Flood Risk ↑ → Property Values ↓


3. Recovery-Deficit Feedback

Disaster Frequency ↑ → Recovery Window ↓ → Unresolved Damage ↑ → Vulnerability ↑ → Next-Event Losses ↑ → Recovery Window ↓


4. Insurance–Mortgage Feedback

Physical Risk ↑ → Insurance Stress ↑ → Coverage Constraints ↑ → Mortgage Risk ↑ → Lending Constraints ↑ → Buyer Pool ↓ → Property Values ↓


5. Commercial Real-Estate Feedback

For income-producing properties:

Climate Risk ↑ → Insurance + Maintenance + Adaptation Costs ↑ → Operating Expenses ↑ → NOI ↓ → Property Value ↓

This relationship is particularly important for multifamily, hospitality, retail, industrial, and other income-producing properties.


The Cascading Real-Estate Framework

The five regional examples reveal several recurring stages in the emerging climate-real-estate cascade:

Physical Hazard

Warming → Sea-Level Rise + Heavier Rainfall + Stronger/Slower Storms + Extreme Heat + Drought

Hazard Coupling

Multiple Hazards → Compound Events → Greater Physical Exposure

Property Damage

Compound Hazard → Structural Damage + Infrastructure Damage + Business Interruption

Insurance Stress

Losses ↑ → Premiums ↑ + Deductibles ↑ + Coverage Restrictions ↑ + Availability ↓

Property Repricing

Insurance Cost ↑ → Cost of Ownership ↑ → Buyer Demand ↓ → Property Values ↓

Financial Amplification

Property Values ↓ → Mortgage Risk ↑ + Investment ↓ + Liquidity ↓

Municipal Amplification

Property Values ↓ → Tax Base ↓ → Infrastructure Investment ↓

Resilience Erosion

Infrastructure Investment ↓ + Recovery Capacity ↓ → Vulnerability ↑

Cascading Risk

Vulnerability ↑ → Future Losses ↑ → Insurance Stress ↑ → Property Values ↓

The resulting closed-loop system is:

Climate Hazard → Physical Loss → Insurance Stress → Property-Value Decline → Investment Decline → Tax-Base Erosion → Infrastructure Deterioration → Recovery Deficit → Greater Vulnerability → Greater Future Loss


The Central Finding

The Multiplicative Climate Risk framework produces a fundamentally different understanding of climate-exposed real estate.

The highest-risk region is not necessarily the region with:

The Most Hurricanes

The Most Wildfires

The Most Rainfall

or

The Highest Sea-Level Rise

Instead, it is the region where multiple risk factors interact:

Hazard Exposure × Hazard Coupling × Vulnerability × Insurance Stress × Recovery Deficit

The resulting system can become self-reinforcing:

Climate Hazard → Insurance Stress → Property-Value Decline → Investment Decline → Tax-Base Erosion → Infrastructure Resilience Decline → Recovery Deficit → Greater Vulnerability → Greater Future Loss

This is the central transition from climate hazard to cascading real-estate risk.

The most consequential property-market question is therefore no longer simply:

Will this property flood, burn, or be damaged by extreme weather?

It is:

Can this property remain insurable, financeable, valuable, maintainable, and economically viable as climate hazards become more frequent and increasingly coupled?

That question shifts climate-risk analysis from the physical event itself to the long-term resilience of the economic system surrounding the property.

And that is where the greatest risks may emerge.

The weather creates the shock.
Coupled hazards amplify the shock.
Insurance translates the shock into financial cost.
Real estate capitalizes the cost into property values.
Weak recovery capacity allows the damage to accumulate.
And cascading feedbacks can turn a climate hazard into a real-estate crisis.

bookmark_borderAmericans Are Feeling the Heat—But Fewer Believe Climate Change Is Happening

by Daniel Brouse

An AP-NORC poll reveals a deeply troubling contradiction in the American public’s understanding of climate change: Americans are increasingly experiencing the effects of extreme heat, yet fewer now believe climate change is actually happening.

According to the poll, just 66% of Americans say climate change is happening, down sharply from 73% a year ago. That seven-percentage-point decline is particularly alarming because it comes at a time when Americans are reporting increasingly direct and disruptive experiences with extreme heat.

The disconnect raises an important question: How can people increasingly experience the consequences of a changing climate while becoming less likely to recognize climate change as the cause?

Extreme Heat Is Becoming Personal

The same poll found that 90% of Americans say extreme heat has affected their lives in some way, up from 83% in July 2024.

The impacts aren’t confined to abstract concerns about the environment. Americans report that extreme heat is affecting everyday life, including:

  • Electricity bills
  • Outdoor activities
  • Sleep
  • Travel and vacations
  • Daily routines

Perhaps most significantly, about 80% say extreme heat has affected their electricity bills, up from 69% in 2024.

In the Midwest, the increase is even more striking: 44% now say extreme heat has had a major impact on their electricity bills, compared with 29% two years ago.

That is climate change translated into something tangible: a higher household expense.

The Perception–Attribution Gap

The most important finding may not be the increase in heat-related disruption. It may be the growing gap between what Americans experience and what they believe is causing it.

The survey presents two seemingly contradictory trends:

90% say extreme heat has affected their lives.

Yet only 66% say climate change is happening.

And that 66% figure is down from 73% just one year ago.

This is a remarkable perception–attribution gap.

Americans can recognize that summers are becoming more difficult, electricity costs are rising, outdoor activities are being disrupted and extreme heat is affecting sleep—without necessarily connecting those experiences to a changing climate.

The result is a potentially dangerous disconnect between physical reality and public understanding.

Political Division Is Part of the Explanation

Political ideology continues to play an enormous role in how Americans interpret climate-related experiences.

Democrats are substantially more likely than Republicans to describe extreme heat as having a major impact on their lives. But that doesn’t mean Republicans aren’t experiencing the same heat.

The distinction is increasingly about interpretation and attribution.

People across the political spectrum can experience the same 100-degree day. They can experience the same oppressive humidity, pay the same higher electricity bill and face the same restrictions on outdoor activity.

But they may reach very different conclusions about why it is happening.

That distinction matters because climate change doesn’t require public agreement in order to produce physical consequences.

Climate Change Is Becoming an Economic Issue

The AP-NORC findings also demonstrate why climate change should not be viewed exclusively as an environmental issue.

Extreme heat creates a chain of consequences:

Higher temperatures → greater air-conditioning demand → higher electricity consumption → increased household costs

But that is only one pathway.

Extreme heat can also affect worker productivity, agriculture, infrastructure, public health, insurance losses and energy-grid reliability.

The household electricity bill may therefore be only the first visible economic manifestation of a much larger systemic problem.

The public doesn’t need to understand atmospheric physics to experience these consequences.

They simply need to notice that something is different.

The Most Alarming Finding Isn’t the Heat

The increase in extreme-heat impacts is concerning, but the seven-point decline in belief that climate change is happening may be even more alarming.

The country is experiencing a growing number of climate-related disruptions while simultaneously becoming less certain—or less willing—to identify climate change as the underlying cause.

That creates a dangerous situation for public policy.

Democratic societies depend upon the public recognizing problems before governments can effectively address them. If the physical impacts become increasingly severe while public recognition of their underlying causes declines, political pressure for adaptation and mitigation can weaken precisely when the need for action is growing.

This creates a potential feedback loop:

More climate disruption → greater personal impacts → greater economic costs → political polarization → weaker recognition of climate change → less public support for climate action → greater future vulnerability

That is not merely a communications problem.

It is a systemic risk.

Experience Is Increasing Faster Than Understanding

The AP-NORC poll doesn’t measure the physical climate system. It measures what Americans are experiencing and what they believe.

Those are different things.

The survey cannot establish how much of an individual’s electricity bill, sleep disruption or outdoor inconvenience is attributable specifically to climate change. Establishing those causal relationships requires observational climate data and scientific attribution studies.

But the poll does reveal something extremely important about the human response to climate change.

The consequences are becoming increasingly personal while public recognition of climate change is moving in the opposite direction.

That should concern everyone, regardless of political affiliation.

The challenge is no longer simply convincing people that the climate is changing.

It is explaining why their increasingly familiar experiences—extreme heat, higher cooling demand, disrupted outdoor activities, poor sleep and growing economic costs—are connected to a much larger physical system.

Americans may not agree about climate change.

But increasingly, they are living with its consequences.

And the most alarming finding from this poll is that as those consequences become harder to escape, fewer Americans say climate change is actually happening: 66% today, compared with 73% a year ago.

America Is an International Outlier on Climate Change

The decline in American belief becomes even more concerning when viewed against the rest of the world.

A 2025 Pew Research Center international survey of 25 countries found that a global median of 67% of respondents considered climate change a major threat to their country. In the United States, however, only 51% said the same—a gap of 16 percentage points.

The U.S. was among the least concerned countries surveyed. Americans were less likely than respondents in 13 of the 16 high-income countries included in the survey to view climate change as a major threat. In countries such as Argentina, Brazil, France, Japan and South Korea, roughly 80% of respondents regarded climate change as a major threat.

The difference is particularly striking because the United States is not insulated from climate impacts. Americans are experiencing extreme heat, rising cooling demand, disrupted outdoor activities and other consequences of a warming climate, yet concern about climate change remains comparatively low.

The American Divide Is Also Unusually Political

The international comparison becomes even more revealing when political ideology is considered.

Pew found that approximately 84% of U.S. liberals regarded climate change as a major threat, compared with only about 20% of U.S. conservatives. That enormous gap makes the United States an international outlier in the degree to which climate change has become politically polarized.

The result is a remarkable paradox.

Americans across the political spectrum can experience the same heat wave, pay the same electricity bill and endure the same disruption to their daily lives. Yet they may reach dramatically different conclusions about what those experiences mean.

The disagreement therefore isn’t simply about the physical environment. It is increasingly about how Americans interpret the physical environment.

Believing the Climate Is Changing Is Not the Same as Accepting Why

Another Pew measure illustrates the problem even more clearly.

In 2026, only 48% of Americans said the Earth is warming mostly because of human activity. That is substantially lower than the 66% who currently say climate change is happening in the AP-NORC poll.

The difference is crucial.

A person can acknowledge that the climate is changing without accepting that human activity is primarily responsible for that change. Others may accept human-caused warming but disagree about its severity, consequences or appropriate policy response.

This creates several layers of public perception:

Is the climate changing?

↓

Is human activity causing it?

↓

Is it becoming dangerous?

↓

Should government and society act?

Americans can answer those questions very differently.

An Alarming Combination

Taken together, the international and domestic polling reveals a troubling pattern:

90% — say extreme heat has affected their lives

80% — say heat has affected their electricity bills

73% → 66% — Americans saying climate change is happening

51% — Americans calling climate change a major national threat

48% — Americans saying warming is mostly caused by human activity

The numbers measure different things and should not be treated as interchangeable. But together they reveal a striking disconnect between experience, attribution and concern.

The United States is already an international outlier in climate skepticism and political polarization. Now, at a time when Americans report increasingly personal impacts from extreme heat, the share saying climate change is happening has fallen seven percentage points in only one year.

That may be the most troubling finding of all.

The physical climate signal is becoming harder to escape, while public recognition of that signal is moving in the opposite direction.

bookmark_borderStrategic Petroleum Reserve Falls to Lowest Level Since 1983

As of July 31, 2026, the U.S. Strategic Petroleum Reserve (SPR) held approximately 304.8 million barrels of crude oil, its lowest level since March 1983.

From its historic peak of roughly 726 million barrels in 2009, the SPR has experienced a cumulative drawdown of approximately 421 million barrels—about a 58% reduction. The decline has been driven primarily by major emergency releases following Russia’s 2022 invasion of Ukraine and subsequent supply disruptions associated with instability in the Middle East in 2026.

The U.S. Energy Information Administration (EIA) estimates that the reserve could eventually fall to approximately 243 million barrels as currently authorized emergency release schedules conclude.

Strategic Risk: Erosion of U.S. Energy Security

The primary risk of reducing the SPR to approximately 243 million barrels is a severe loss of national energy security and geopolitical leverage during a major global crisis.

At that level—near the lowest inventory in more than four decades—the United States would have substantially less capacity to respond to an extended disruption in global oil supplies. A depleted reserve could also reduce the credibility and effectiveness of the SPR as a deterrent against supply shocks, geopolitical coercion, or major disruptions to global petroleum markets.

Structural and Infrastructure Risks

Cavern Structural Integrity

The SPR is stored in underground salt caverns that require careful management of pressure, oil levels, and cavern conditions. Repeatedly moving crude oil and fresh water into and out of these caverns can alter the physical characteristics of the salt formations and potentially increase operational and structural risks.

Maintaining the integrity of the caverns becomes increasingly important as the reserve is drawn down because the SPR’s ability to rapidly refill or sustain emergency withdrawals depends on the continued reliability of this underground storage infrastructure.

International Energy Agency Compliance

A substantially reduced SPR could also complicate U.S. compliance with International Energy Agency (IEA) emergency-stockholding requirements.

IEA member countries are generally required to maintain emergency oil stocks equivalent to at least 90 days of net oil imports. The relevant measure, however, is based on a country’s total qualifying emergency stocks—not simply the number of barrels held in the SPR. Therefore, the U.S. position must be evaluated using the full national stockholding calculation, including other qualifying inventories.

The Strategic Concern

The SPR was designed as a national insurance policy against severe and prolonged disruptions in petroleum supplies. Reducing the reserve by more than half from its 2009 peak fundamentally changes the country’s ability to absorb a major energy shock.

If inventories approach 243 million barrels, the United States would enter a period in which rebuilding the reserve could become increasingly important but potentially difficult. Large-scale purchases to replenish the SPR would require substantial funding, available crude supplies, suitable market conditions, and sufficient time.

The central strategic issue is therefore not simply how many barrels remain, but whether the United States retains enough readily deployable petroleum reserves to withstand a prolonged global supply disruption while simultaneously preserving the infrastructure, flexibility, and geopolitical leverage needed to respond to the next crisis.

bookmark_borderWildfire Catastrophe Bonds Surge as Insurers Transfer Record Climate Risk to Capital Markets

by Sidd Mukherjee and Daniel Brouse

A New Era of Climate Risk Finance

Wildfire-exposed catastrophe bond issuance has surged to $5.183 billion year-to-date in 2026, rapidly approaching the full-year record of $5.55 billion set in 2025. Driven by escalating wildfire losses, expanding climate risks, and increasingly sophisticated risk models, insurers are turning to global capital markets to transfer unprecedented levels of wildfire exposure.

Catastrophe bonds—often called cat bonds—allow insurers and governments to shift extreme disaster risks away from traditional insurance markets and onto investors. Investors receive attractive returns if a defined catastrophe does not occur, but may lose some or all of their principal if a triggering event causes significant losses.

The rapid growth of wildfire-linked cat bonds reflects a fundamental shift: wildfire is no longer viewed as a regional insurance problem but as a major global financial risk.


Wildfire Cat Bond Issuance Reaches Historic Levels

According to data compiled by Artemis, wildfire-related risk capital has experienced dramatic multi-year growth:

  • 2023: $2.57 billion issued
  • 2024: $2.84 billion issued
  • 2025: Record $5.55 billion issued
  • 2026 (year-to-date): $5.183 billion issued

The acceleration reflects rising insured wildfire losses, increasing pressure on traditional insurers, and investor demand for alternative assets that are not closely correlated with stocks and bonds.


Wildfire Risk Becomes a Major Alternative Asset Class

From Niche Exposure to Global Investment Market

Wildfire risk is rapidly evolving from a specialized insurance concern into a standalone catastrophe-risk asset class. Investors are increasingly attracted to catastrophe bonds because disaster events generally have little relationship to traditional financial markets.

Unlike stocks, bonds, or commodities, catastrophe bonds are driven primarily by physical climate events rather than economic cycles.

Advanced Climate Risk Modeling

Improved modeling capabilities have increased investor confidence. Companies such as Verisk and Moody’s have developed increasingly sophisticated catastrophe models that incorporate updated climate data, changing fire behavior, and evolving exposure patterns.

These models help investors evaluate wildfire probability, potential losses, and appropriate risk premiums.

Human Mitigation Changes the Risk Equation

Wildfire risk differs from many natural hazards because human actions can influence outcomes. Measures such as vegetation management, defensible space creation, utility improvements, and community fire planning can alter expected losses and affect catastrophe bond risk assessments.


Key Sponsors and Expanding Markets

California FAIR Plan Returns to the Cat Bond Market

California’s insurer of last resort, the California FAIR Plan, returned to the catastrophe bond market through the Golden Bear Re Ltd. Series 2026-2 transaction, successfully raising its target to $400 million.

The move highlights the growing difficulty of relying solely on traditional insurance markets in regions facing persistent wildfire threats.

Mercury General Targets Fire Risk Transfer

Mercury General Corporation sponsored the Luca Re Ltd. Series 2026-1 catastrophe bond transaction, targeting $150 million in fire-related reinsurance protection.

European Insurers Explore Wildfire Risk Transfer

Although wildfire catastrophe bond issuance remains heavily concentrated in California, increasingly severe wildfire seasons are pushing European insurers to explore capital-market solutions and alternative risk-transfer structures.


How Catastrophe Bonds Work

A catastrophe bond transfers disaster risk from an insurer to investors.

The insurer pays investors a premium for assuming the risk. Investors receive regular interest payments, but their principal is placed at risk if a predefined catastrophe occurs.

How Investors Make Money

1. Regular Interest Payments

Investors receive monthly or quarterly coupon payments that compensate them for accepting catastrophe exposure.

2. Risk Premium Spread

Sponsors pay an elevated interest spread because investors are taking on the possibility of losing principal.

3. Collateral Yield

The invested principal is typically held in a secure collateral account that generates additional low-risk interest income.

4. Total Return

The investor’s return combines the catastrophe bond premium spread and collateral investment yield.


How Investors Can Lose Their Principal

Binary Catastrophe Risk

If a wildfire reaches the bond’s predetermined trigger conditions, investors may lose part or all of their principal.

Immediate Capital Transfer

When triggered, the lost principal is transferred to the insurance sponsor to help cover wildfire claims.

No Insurance Company Default Required

Unlike traditional corporate bonds, investors do not lose money because an insurer fails financially. The catastrophe itself triggers the loss.

Full Return Without Trigger

If no qualifying wildfire occurs during the bond term—typically three to five years—the investor receives the full principal back at maturity.


How Wildfire Cat Bond Triggers Work

Indemnity Triggers

Payments are based on the sponsor’s actual insured losses from a wildfire event.

Example: An insurer suffers billions of dollars in wildfire claims, triggering payment from the catastrophe bond.

Parametric Triggers

Payments are based on measurable physical conditions rather than financial losses.

Examples:

  • Acres burned
  • Fire intensity
  • Geographic location
  • Wind conditions
  • Temperature thresholds

Industry Loss Triggers

Payments are based on total insurance industry losses from a catastrophe, calculated by independent organizations such as catastrophe loss index providers.


Climate Risk Moves Into Global Finance

The rapid expansion of wildfire catastrophe bonds signals a major transformation in how society manages climate risk. As extreme wildfire seasons become more frequent and expensive, insurers are increasingly relying on financial markets to absorb losses that traditional insurance systems can no longer easily contain.

Wildfire risk is becoming not only an environmental challenge but also a major test of global financial resilience.

The Major Perils Behind the Global Catastrophe Bond Market

Tropical cyclones and earthquakes remain the two foundational pillars of the global catastrophe bond market, traditionally accounting for a large share of the roughly $65.6 billion in outstanding risk capital. Wildfire, however, has rapidly expanded into a significant standalone risk category as insurers confront escalating losses and growing climate exposure.

The catastrophe bond market now spans a broad spectrum of natural, human-caused, and emerging systemic risks.

Core Property Perils

Tropical Cyclones — Hurricanes and Typhoons
Tropical cyclones are among the largest sources of catastrophe bond risk. Coverage is concentrated in U.S. hurricanes, particularly along Florida, the Gulf Coast, and the Eastern Seaboard, as well as Japanese typhoons and Australian cyclones.

Earthquakes
Earthquake risk represents one of the longest-established and most consistently modeled catastrophe bond perils. Major exposure centers include California, the Pacific Northwest, Japan, and New Zealand, where severe seismic events can generate enormous insured losses.

Severe Convective Storms
This increasingly important category covers highly localized but frequent atmospheric hazards, including tornadoes, severe hail, and straight-line winds such as derechos. Repeated losses from these events have become a significant source of claims for U.S. property insurers.

Wildfires
Wildfire has rapidly evolved from a relatively specialized exposure into a major standalone catastrophe bond peril. California remains the dominant market, but growing wildfire losses are driving interest in risk-transfer solutions across other regions.

Winter Storms and Floods
Catastrophe bonds can also protect insurers against extreme winter weather, including freezing events, heavy snowfall, ice damage, and infrastructure failures, as well as coastal and inland flooding.

Emerging and Specialized Perils

Cyber Risk
Cyber catastrophe bonds are an emerging non-natural peril designed to protect insurers against systemic cyber events. Potential triggers include widespread cloud-service disruptions, ransomware attacks, or failures of critical digital infrastructure.

Life, Health, and Mortality Risk
Life and health catastrophe securities can transfer the risk of sudden, extreme increases in mortality or health-related losses. Pandemic-scale events represent one potential source of catastrophic exposure.

Operational and Terrorism Risk
Specialized catastrophe structures have also been used to transfer extreme human-caused risks, including terrorism and major operational disruptions affecting businesses, infrastructure, or public institutions.

Multi-Peril vs. Standalone Catastrophe Bonds

Catastrophe bonds do not always cover a single peril. Many transactions combine several risks into a multi-peril structure, allowing insurers to diversify their exposure and potentially provide investors with a broader risk profile.

For example, a single transaction may combine U.S. named storms, earthquakes, severe convective storms, and wildfire under one bond.

This structure is important because catastrophe bonds can function much like a portfolio of climate and disaster risks: investors are exposed to multiple potential events, while insurers gain protection against losses that could otherwise overwhelm traditional reinsurance capacity.

A Market Expanding Beyond Traditional Disasters

The evolution of the catastrophe bond market reflects a broader transformation in global risk. What began primarily as a mechanism for transferring hurricane and earthquake risk has expanded into a sophisticated financial system capable of pricing and transferring exposure to wildfires, severe storms, floods, cyberattacks, pandemics, and other low-probability, high-impact events.

As climate change increases the frequency, severity, geographic reach, or financial consequences of certain extreme events, catastrophe bonds are becoming an increasingly important bridge between physical risk, insurance markets, and global investment capital.

bookmark_borderClimate Shock to the Food System

by Daniel Brouse

How Extreme Heat, Drought, Disease, and Global Supply Disruptions Are Reshaping Agriculture and Raising Food Prices

Introduction

Climate change is increasingly affecting agriculture through multiple, interconnected pathways. Extreme heat, prolonged drought, erratic rainfall, declining water availability, wildfire, shifting pest and disease pressures, and disruptions to livestock production are converging to create a more volatile global food system.

The consequences extend far beyond individual farms. When climate extremes reduce harvests or livestock productivity, they can simultaneously tighten global supplies, increase production costs, disrupt international trade, and raise food prices for consumers.

The result is a climate-driven agricultural feedback loop:

Extreme Weather → Lower Production → Tighter Supply → Higher Costs → Higher Food Prices

And because modern food systems are globally interconnected, a crop failure thousands of miles away can eventually appear as a higher price on an American grocery shelf.


1. The Agricultural Climate Shock

Severe droughts, extreme heatwaves, and increasingly erratic rainfall are placing growing pressure on agricultural production.

Major agricultural regions across Europe and North America have experienced significant crop stress from rapid soil drying, water restrictions, excessive heat, and premature crop maturation. In some regions and individual crops, harvest losses have reached extraordinary levels.

Severe Drought and Heat

Intense summer heat can:

  • Dry out topsoil before crops reach maturity
  • Reduce corn, wheat, soybean, and vegetable yields
  • Accelerate crop maturation before plants reach their full potential
  • Increase irrigation requirements
  • Reduce pasture productivity
  • Increase livestock heat stress

When extreme heat arrives during critical stages such as flowering, pollination, or grain filling, even short-lived temperature spikes can produce disproportionately large losses.

Water Shortages

Agriculture is increasingly competing with municipal, industrial, ecological, and energy demands for limited water supplies.

Low river levels, depleted reservoirs, declining groundwater, and prolonged drought have forced irrigation restrictions in portions of Europe and the United States.

Water scarcity creates a second-order effect: farmers may not simply harvest less. They may also reduce the acreage they plant in the first place.

Livestock Stress

Extreme heat is equally damaging to animal agriculture.

Heat-stressed cattle and other livestock often eat less, gain weight more slowly, reproduce less efficiently, and become more vulnerable to illness. Dairy cattle can experience substantial reductions in milk production during periods of severe heat.

Pests, Weeds, and Plant Disease

Climate disruption is also changing the biological environment in which crops grow.

Warmer temperatures can expand the geographic range and seasonal activity of some insects, while altered precipitation can create conditions favorable to weeds and plant pathogens.

The emerging pattern can be summarized as:

“Wetter wets. Drier dries. Greater volatility.”

The agricultural problem is not simply that the planet is becoming warmer. It is that weather conditions are becoming increasingly difficult to manage.


2. The Economic Shock

Agricultural losses propagate rapidly through the economy.

Financial Pressure on Farmers

When yields decline, farmers receive less revenue per acre while many costs remain fixed or increase.

At the same time, drought and heat can require:

  • Additional irrigation
  • More expensive feed
  • Higher fuel consumption
  • Additional pest and disease management
  • Greater fertilizer expenditures
  • Emergency infrastructure repairs

This creates a dangerous combination:

Lower Output + Higher Costs = Collapsing Margins

Higher Food Prices

When production falls faster than demand, commodity prices rise.

The effect can move through the food system in stages:

Crop Failure → Commodity Shortage → Higher Wholesale Prices → Higher Processing Costs → Higher Retail Prices

Consumers therefore experience climate disruption indirectly, even when no climate disaster occurs anywhere near them.


3. The U.S. Protein Crisis

American protein production faces two distinct climate-related pressures:

Direct climate stress on livestock

and

Climate-sensitive disease pressures affecting poultry.

Together, these pressures can reduce domestic production while increasing costs for beef, poultry, eggs, and dairy.


4. Beef and Cattle: Heat, Drought, Fire, and Herd Contraction

The U.S. cattle industry has experienced a historically small cattle inventory after years of drought, elevated feed costs, and herd liquidation.

Extreme Heat

Prolonged triple-digit temperatures across portions of the Plains and Midwest can cause severe cattle heat stress.

Heat-stressed cattle consume less feed, gain weight more slowly, and can experience reduced reproductive performance.

The effects become particularly serious when extreme heat coincides with drought and poor pasture conditions.

Drought and Forage Destruction

Drought reduces the availability of grass, hay, alfalfa, and other livestock feed.

Wildfires can compound the problem by destroying grazing land, fencing, water infrastructure, barns, and other ranch assets.

Smoke exposure can also create respiratory stress for animals.

Feed Scarcity

When drought reduces forage production, ranchers may have to purchase expensive supplemental feed.

That creates an economic dilemma:

Buy Expensive Feed → Absorb Large Losses

or

Sell Breeding Animals → Shrink the Herd

Large-scale liquidation can temporarily increase beef supplies but ultimately reduces the nation’s productive cattle base.

The long-term consequence is a tighter supply of beef and greater vulnerability to subsequent climate shocks.


5. Poultry and Eggs: H5N1 and Climate-Sensitive Disease Risk

The poultry industry has faced an extraordinary challenge from Highly Pathogenic Avian Influenza (H5N1).

Millions of domestic birds have been lost through infection and mandatory depopulation measures designed to prevent further transmission.

Climate change should not be treated as the sole cause of the outbreak. However, climate-driven changes in temperature, precipitation, migration timing, habitat, and wildlife distribution can alter the ecological conditions under which infectious diseases circulate.

Changing Wild-Bird Migration

Wild waterfowl are important reservoirs and carriers of avian influenza viruses.

Changes in climate and weather can affect:

  • Migration timing
  • Migration routes
  • Stopover locations
  • Habitat availability
  • Population concentration

These changes can alter opportunities for viruses to move between wild birds and commercial poultry.

Extreme Weather and Disease Transmission

Highly variable weather can also change where and when migrating birds congregate.

That can create new opportunities for pathogen transmission and increase biosecurity challenges for poultry producers.

The Depopulation Problem

H5N1 can be devastating to commercial poultry operations.

When infection is detected, strict disease-control protocols can require entire flocks to be destroyed to prevent further spread.

For producers, this creates a severe economic shock:

Infection → Flock Depopulation → Lost Production → Reduced Supply → Higher Prices

The impact is especially severe for smaller producers with limited financial reserves.

Cross-Species Transmission

The emergence of H5N1 infections in additional mammalian species, including dairy cattle, has demonstrated the capacity of the virus to move beyond traditional avian hosts.

That creates a more complicated agricultural disease environment and increases the importance of surveillance, biosecurity, and rapid containment.


6. The U.S. Breadbasket Under Pressure

The United States is one of the world’s most important agricultural producers, but American agriculture is not insulated from climate disruption.

Midwest Yield Pressure

Extreme heat and drought can reduce yields of rain-fed corn and soybeans.

Higher atmospheric carbon dioxide can provide some benefits to certain crops under some conditions, but those benefits can be overwhelmed when heat, water stress, nutrient limitations, and other environmental pressures become sufficiently severe.

The critical issue is therefore not simply:

“More CO₂ = More Growth.”

It is:

CO₂ Benefit − Heat Stress − Water Stress − Other Constraints = Actual Yield

When environmental constraints become severe, theoretical fertilization benefits may provide little protection against major crop losses.

Western Water Crisis

The American West faces a particularly difficult agricultural challenge.

Persistent drought, declining reservoir levels, groundwater depletion, and competing demands for water have forced reductions in irrigation and planted acreage in some agricultural regions.

California’s Central Valley illustrates the problem.

Reduced water availability can threaten the production of fruits, nuts, vegetables, and other high-value crops that depend heavily on irrigation.

Livestock and Dairy

Heat stress also affects cattle and dairy production.

Extreme temperatures can reduce feed intake, fertility, growth rates, and milk production.

The resulting loss is both biological and economic.


7. Climateflation: When Global Weather Hits the American Grocery Store

The climate vulnerability of American food prices does not stop at the nation’s borders.

The United States depends heavily on imports for many commodities, including coffee, cocoa, tropical produce, olive oil, sugar, wine, and other agricultural products.

Consequently, extreme weather overseas can become inflation at home.

This phenomenon can be described as climateflation:

Climate Shock Abroad → Global Supply Reduction → Higher Commodity Prices → Higher U.S. Import Costs → Higher Retail Prices


8. Cocoa and Chocolate

The Climate Shock

A large share of global cocoa production is concentrated in West Africa, particularly Côte d’Ivoire and Ghana.

Changing rainfall patterns, extreme precipitation, heat, and plant disease can simultaneously threaten production.

Black pod disease and other pathogens can become particularly damaging when environmental conditions favor their spread.

The U.S. Impact

When cocoa supplies tighten, American manufacturers face higher input costs.

The consequences can include:

  • Higher chocolate prices
  • Smaller package sizes
  • Recipe reformulation
  • Substitution of some expensive ingredients
  • Reduced product margins

The consumer may therefore experience climate disruption not as a failed harvest in West Africa, but as a smaller chocolate bar costing more money.


9. Olive Oil

The Climate Shock

Mediterranean agriculture is particularly exposed to heat and drought.

Spain, Italy, and Greece—major olive-producing regions—have experienced severe weather conditions capable of damaging flowering, fruit development, and harvests.

Repeated poor harvests can create persistent supply shortages.

The U.S. Impact

Because the United States imports most of its olive oil, reduced European production can rapidly affect American prices.

A climate-driven decline in Mediterranean production therefore becomes an American grocery-store problem.


10. Coffee

Coffee is another highly climate-sensitive commodity.

Brazil and Vietnam are among the world’s largest coffee producers, making weather conditions in those countries important to global supply.

Heat, drought, excessive rainfall, and shifting disease pressures can damage coffee production and affect both Arabica and Robusta supplies.

The result can be a chain reaction:

Extreme Weather → Lower Coffee Yield → Global Supply Tightening → Higher Wholesale Prices → Higher Retail Prices

For American consumers, the climate signal may ultimately appear as a more expensive cup of coffee.


11. Sugar

Global sugar production is also vulnerable to weather extremes.

Drought, irregular monsoons, heat, and El Niño-related precipitation changes can reduce sugarcane production in major producing countries such as India and Thailand, as well as in parts of Central and South America.

Because the United States operates under a managed sugar import system, global shortages can translate into higher costs for American food manufacturers.

Those costs can eventually appear in:

  • Candy
  • Baked goods
  • Soft drinks
  • Processed foods

12. Fruits and Vegetables

The United States imports substantial quantities of fresh produce from Mexico, Central America, and South America, particularly during the winter months.

Extreme heat, drought, flooding, and severe storms in producing regions can produce localized crop failures.

When supply contracts, U.S. consumers can experience sharp price volatility in commodities such as:

  • Avocados
  • Limes
  • Tomatoes
  • Berries
  • Other fresh produce

The grocery store therefore functions as the final link in a global climate-sensitive supply chain.


13. Wine and Spirits

Climate disruption is also reshaping beverage agriculture.

Traditional wine-producing regions in France, Italy, and Spain face combinations of:

  • Extreme heat
  • Drought
  • Late-season frost
  • Wildfire
  • Altered precipitation

Mexico’s blue-agave production is similarly exposed to changing rainfall and temperature patterns.

When harvests decline, producers and distributors may have to seek alternative sources, accept higher input costs, or pass those costs on to consumers.


14. The Hidden Vulnerability: Global Food Interdependence

The greatest danger may not be any single crop failure.

It is the coupling of multiple failures.

A drought in the American Midwest can affect corn and soybean production.

A heatwave in Europe can reduce wheat or vegetable output.

Drought in Brazil can affect coffee.

Heat and disease can damage cocoa production in West Africa.

Mediterranean drought can reduce olive oil.

Disease outbreaks can devastate poultry.

When these disruptions occur independently, markets can sometimes compensate.

But when several occur simultaneously, the world’s food system has fewer buffers.

This produces a potentially dangerous nonlinear effect:

One Climate Shock → Manageable

Multiple Simultaneous Shocks → Systemic Stress


15. The Agricultural Feedback Loop

Climate change therefore creates more than isolated agricultural disasters.

It creates interacting feedbacks.

Climate → Agriculture

Heat + Drought + Flooding + Fire + Disease

↓

Lower Crop and Livestock Productivity

↓

Reduced Food Supply

↓

Higher Commodity Prices

↓

Higher Production Costs

↓

Higher Food Prices

↓

Economic Stress

At the same time, declining agricultural productivity can increase pressure to expand production into marginal lands, intensify irrigation, increase fertilizer use, or otherwise compensate for declining yields.

The result is a system under increasing stress from multiple directions.


Conclusion: From Weather Extremes to Food-System Instability

Climate change is increasingly becoming an agricultural problem, an economic problem, and a food-security problem simultaneously.

The threat does not depend on a single catastrophic harvest failure.

The greater danger lies in the simultaneous accumulation of smaller disruptions across interconnected agricultural systems.

Extreme heat stresses crops and livestock.

Drought reduces water and forage.

Wildfire destroys pasture and infrastructure.

Disease attacks crops and animals.

Changing ecological conditions can alter pest and pathogen pressures.

International trade then transmits these disruptions across borders.

The American consumer may ultimately experience the result as a higher price for beef, eggs, coffee, chocolate, olive oil, produce, wine, or everyday processed foods.

The emerging pattern is therefore clear:

Climate Change

↓

More Extreme and Erratic Weather

↓

Agricultural Stress

↓

Lower and More Volatile Production

↓

Tighter Global Food Supplies

↓

Higher Production and Transportation Costs

↓

Food Inflation

↓

Greater Economic and Social Vulnerability

The food system is not a collection of isolated farms.

It is a globally interconnected network.

And as climate extremes intensify, the vulnerability of that network increasingly depends not only on how much food the world can produce—but on whether multiple agricultural shocks arrive at the same time.

That is where climate risk can transform from a collection of local disasters into a systemic food-security problem.