California Wildfire Insurance: Who Pays When the Forest Burns?
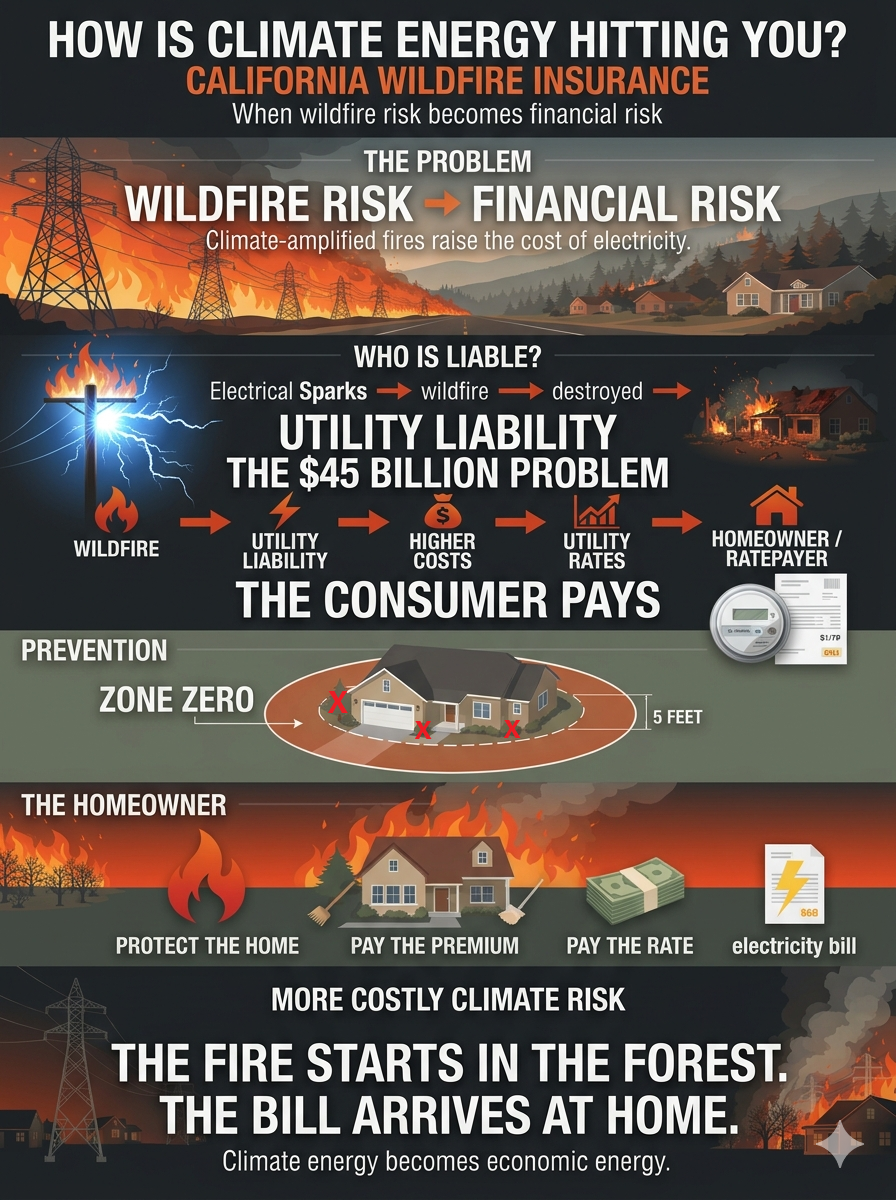
California is confronting a difficult new reality: increasingly destructive wildfires are no longer just an environmental problem. They are becoming a financial, legal, insurance, and property-risk problem that reaches directly into the lives of homeowners, utilities, insurers, investors, and taxpayers.
California lawmakers and Governor Gavin Newsom have reached a landmark compromise on Senate Bill 492 (SB 492) to reform the state’s wildfire liability system. At the same time, the California Board of Forestry and Fire Protection has finalized strict new “Zone Zero” landscaping requirements for homeowners in high-risk areas.
Together, these actions address two sides of the wildfire problem:
Who pays when utility equipment starts a catastrophic fire—and what can homeowners do to reduce the probability that their property burns?
1. Utility Liability and Wildfire Compensation
After intense negotiations, state lawmakers finalized a compromise version of SB 492 that removes the liability protections sought by California’s investor-owned utilities.
The “Fast-Pay” Program
The legislation establishes an expedited compensation process intended to get money to wildfire victims more quickly. Compensation can cover property losses, pain and suffering, while victims retain the right to pursue litigation and conduct legal discovery.
No Subrogation Limits
One of the most consequential provisions concerns subrogation—the process through which insurance companies seek reimbursement from utilities when utility equipment is responsible for a fire.
Lawmakers rejected efforts to restrict this process.
That matters because a wildfire does not end when the flames are extinguished. The financial losses can continue for years through insurance claims, litigation, infrastructure replacement, and potential utility liabilities.
If utility equipment ignites a catastrophic fire, the utility can remain financially exposed to enormous claims.
2. “Zone Zero”: Moving Fire Prevention Onto the Property
California is also attacking wildfire risk at the individual-property level.
The California Board of Forestry and Fire Protection has adopted what are being described as first-in-the-nation wildfire safety requirements focused on the immediate area surrounding homes in high-risk locations.
The central concept is Zone Zero—the first five feet surrounding a structure.
The 5-Foot Rule
Homeowners in designated high-hazard areas must remove combustible materials, wooden sheds, and most vegetation within five feet of their homes.
The goal is straightforward:
Create a defensible noncombustible space immediately around the structure.
What Can Remain?
Some vegetation is permitted.
Lawns, flowers, and non-woody plants shorter than 18 inches can remain under specified conditions, provided they are not directly beneath a roofline.
Trees are permitted only when branches are maintained at least five feet away from structures.
Nearly 2 Million Existing Homes
The requirements apply immediately to new construction and will be phased in over five years for nearly 2 million existing homes.
That represents a major shift in wildfire policy.
California is effectively treating individual homes as components of the larger wildfire-risk system. Homeowners who fail to comply with Zone Zero requirements could face fines or other penalties—and, depending on the terms of their insurance policy and applicable law, noncompliance could also jeopardize their wildfire coverage.
3. The Insurance Problem
The insurance industry has raised concerns about inconsistencies in the new rules.
Representatives, including the Personal Insurance Federation of California, have objected to provisions allowing local governments to establish their own exceptions.
From an insurer’s perspective, inconsistent standards create a difficult problem:
How do you accurately price wildfire risk when neighboring jurisdictions can apply different rules to otherwise similar properties?
Insurance depends on the ability to estimate risk.
As wildfire risk becomes more geographically variable—and as losses become more severe—the ability to accurately price that risk becomes increasingly important.
Utilities face potentially enormous liabilities. Insurers face increasingly expensive claims. Homeowners face higher premiums and stricter mitigation requirements. Investors must reassess utility risk. Governments may ultimately face pressure to intervene when private insurance markets become unable or unwilling to absorb catastrophic losses.
4. The Market Is Repricing Wildfire Risk
Over the weekend, California lawmakers finalized the compromise version of SB 492, stripping out the liability protections that utility companies had been seeking.
The market reaction has been immediate, with utility stocks—including Edison International and PG&E—coming under significant pressure as investors reassess the potential financial exposure.
The underlying issue is bigger than one bill or one wildfire.
Investors are being forced to reconsider a fundamental question:
What is the true financial liability of operating electrical infrastructure in a climate where extreme wildfire conditions are becoming more dangerous—and how will that liability affect utility rates?
The consumer will foot the bill.
Over the past decade, catastrophic wildfires have cost California’s major electric utilities more than $45 billion through direct settlement payouts, insurance subrogation claims, and historic bankruptcy costs.
California’s strict legal doctrine of “inverse condemnation” adds another layer of financial exposure. Under this doctrine, electric utilities can be held responsible for property damage caused by their equipment even when the utility was not negligent.
The result is a massive financial burden concentrated among California’s largest utilities.
But utilities do not ultimately absorb these costs in isolation. Billions of dollars in wildfire liabilities, infrastructure hardening, insurance costs, legal settlements, financing costs, and risk premiums become part of the economic cost of providing electricity.
And those costs eventually flow back to the ratepayer.
When wildfire risk increases, the cost of electricity infrastructure increases with it:
More extreme fire conditions → greater utility liability → higher insurance and financing costs → billions in wildfire settlements and mitigation spending → higher utility costs → higher electricity rates.
California’s wildfire crisis is therefore becoming an insurance problem, a utility problem, and ultimately a consumer problem.
The question is no longer simply who is legally responsible when a power line starts a fire?
The larger question is:
Who ultimately pays for the growing cost of operating an electrical grid in a climate of escalating wildfire risk?
The consumer will foot the bill.
Climate Energy Becomes Financial Energy
This is what climate change increasingly looks like at the ground level.
It is not simply a hotter atmosphere or a longer fire season.
Climate energy moves through interconnected systems:
The physical climate system becomes an economic system.
And eventually, that system reaches the homeowner.
California’s wildfire response is therefore becoming something much larger than a debate about fire suppression.
It is becoming a test of whether insurance markets, utility companies, homeowners, investors, and governments can absorb the financial consequences of escalating climate-amplified wildfire risk.
Rerouting the Walker Circulation: The Pacific El Niño–Atlantic Niña Atmospheric Bridge
The unusual co-occurrence of a Pacific El Niño and an Atlantic Niña illustrates how strongly connected Earth’s climate system is. Although the Pacific and Atlantic are separate ocean basins, the atmosphere links them through planetary-scale circulation patterns.
One of the most important connections is the Walker circulation—a vast east-west circulation of rising and sinking air across the tropics. When El Niño warms the central and eastern tropical Pacific, it reorganizes convection, atmospheric pressure, and wind patterns across the tropics. Those changes can extend into the Atlantic, altering the trade winds and ocean circulation there.
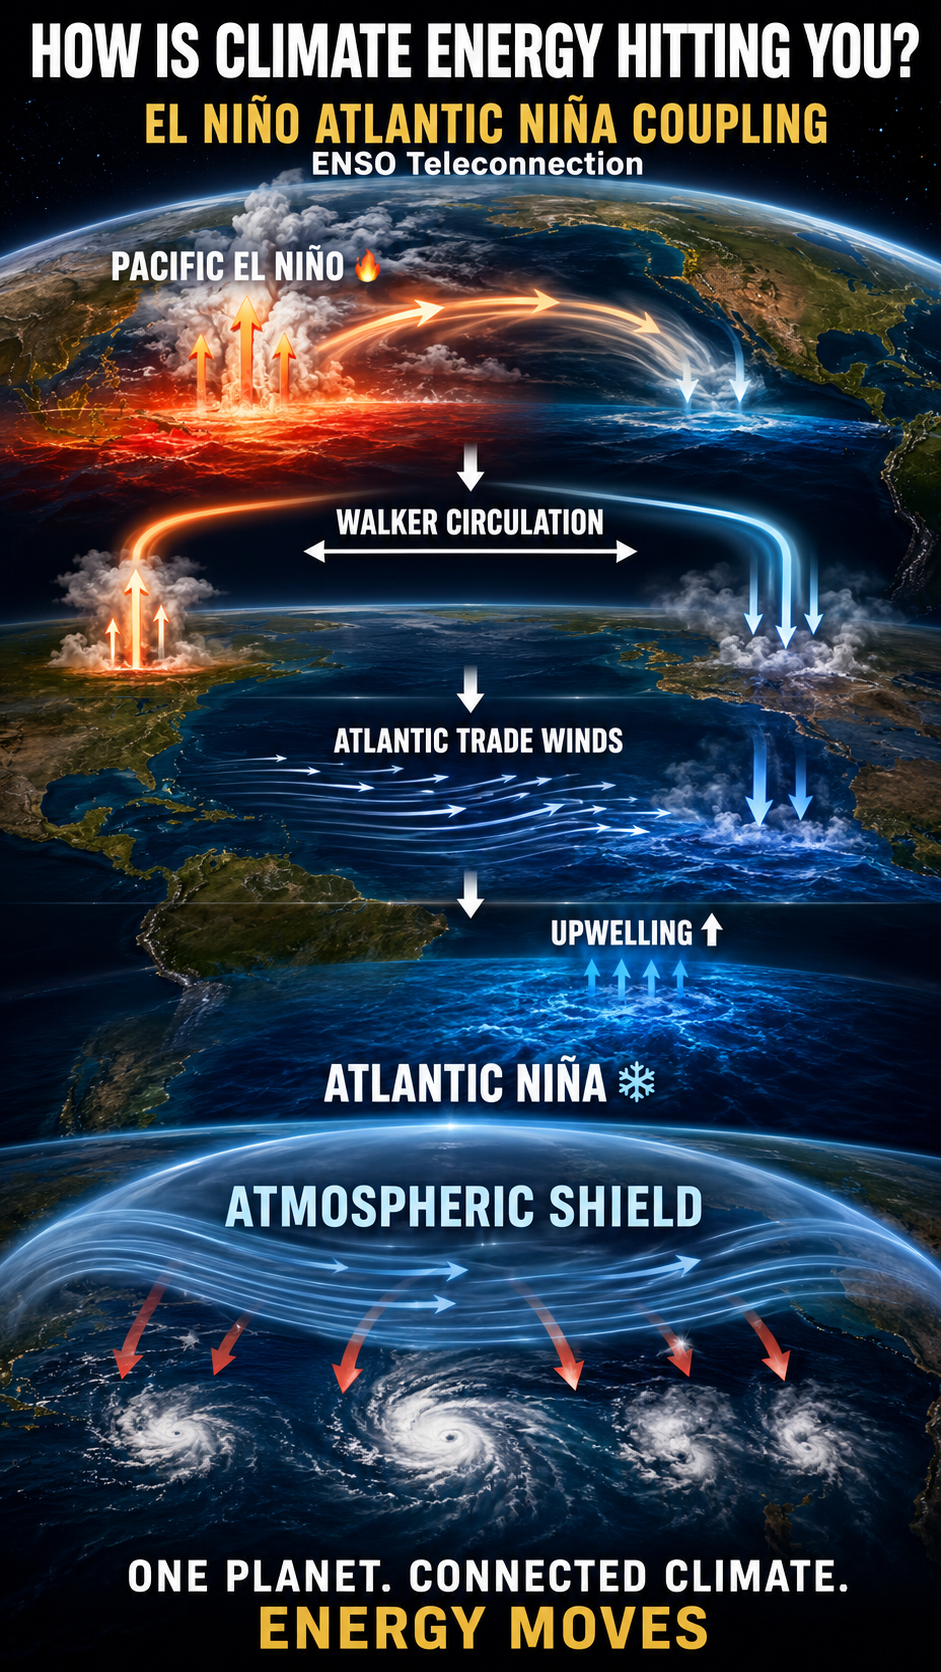
The result is a remarkable sequence of interconnected processes: Pacific warming → atmospheric rerouting → Atlantic pressure changes → stronger trade winds → enhanced upwelling → Atlantic cooling.
1. Rerouting the Walker Circulation
Walker circulation / ENSO Teleconnection: The Walker circulation is a large-scale tropical atmospheric circulation that links changes in convection, pressure, winds, and ocean–atmosphere heat exchange across the Pacific and beyond. During El Niño, changes in Pacific sea-surface temperatures reorganize this circulation, creating atmospheric teleconnections that can extend into the Atlantic.
Pacific warming: During El Niño, unusually warm surface waters develop across the central and eastern tropical Pacific. The additional oceanic heat increases evaporation and fuels stronger deep atmospheric convection.
Shifted convection: As warm, moisture-rich air rises over the anomalously warm Pacific, the center of tropical convection shifts eastward. This changes the pattern of rising and sinking air that defines the Walker circulation, redistributing atmospheric energy and altering pressure and wind patterns across the tropics.
Atlantic subsidence: The reorganized tropical circulation can produce compensating regions of sinking, relatively dry air over parts of the tropical Atlantic and Caribbean. This subsidence suppresses cloud formation and deep convection and can contribute to higher surface pressure.
The atmospheric bridge: The Pacific warming does not directly “cause” the Atlantic to cool. Instead, ENSO reorganizes the atmospheric circulation, and that planetary-scale response can alter Atlantic pressure, winds, evaporation, and ocean circulation—providing the atmospheric bridge between the two ocean basins.
2. The Planetary Teleconnection: From the Pacific to the Atlantic and Beyond
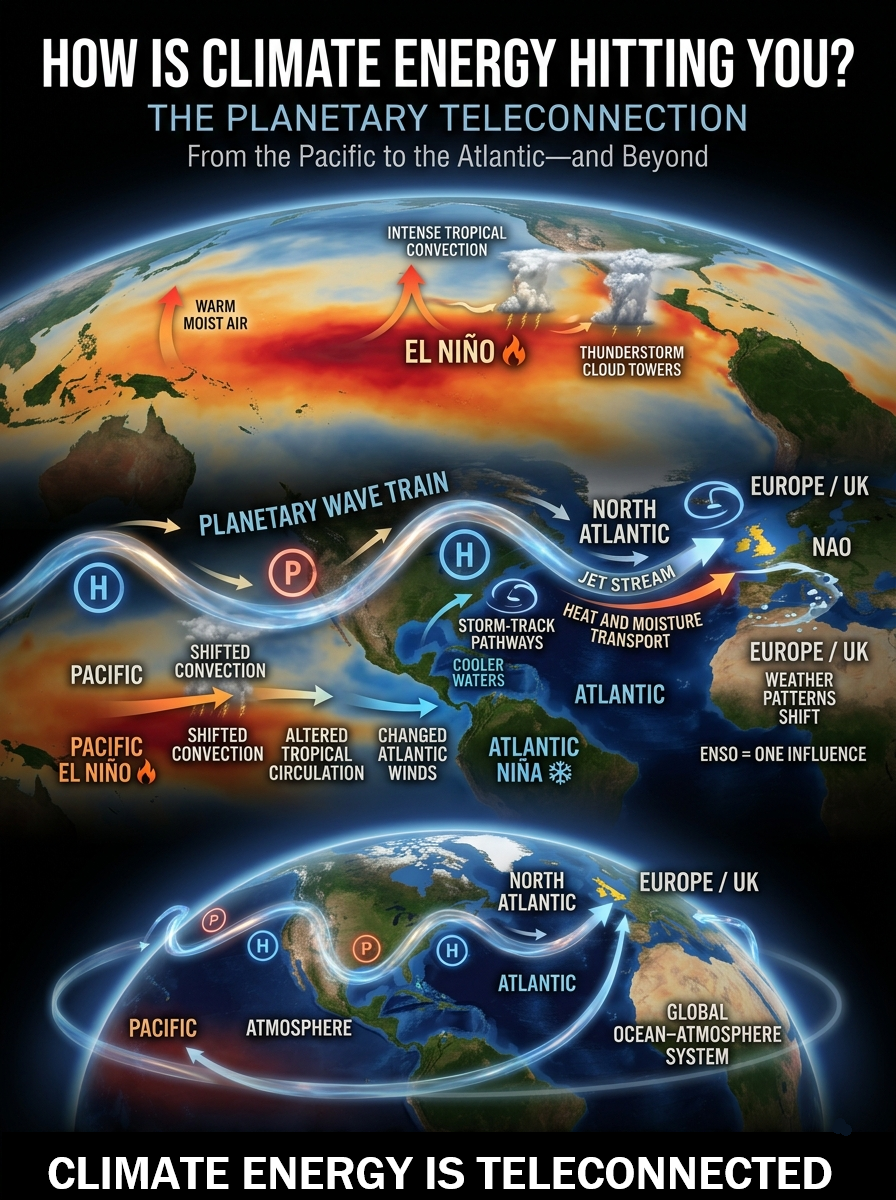
The ENSO teleconnection does not stop at the Atlantic. The atmospheric disturbance generated by El Niño can propagate across the tropics and into the extratropics, linking the Pacific to the Atlantic, North Atlantic, Europe, and the United Kingdom through a network of atmospheric circulation patterns.
As tropical convection shifts over the Pacific, it alters the distribution of atmospheric heating. These changes can generate large-scale Rossby waves that propagate through the atmosphere, modifying the position and strength of the jet streams, storm tracks, and persistent pressure systems far from the original Pacific anomaly.
Pacific → Atlantic
The first major connection is the tropical Atlantic.
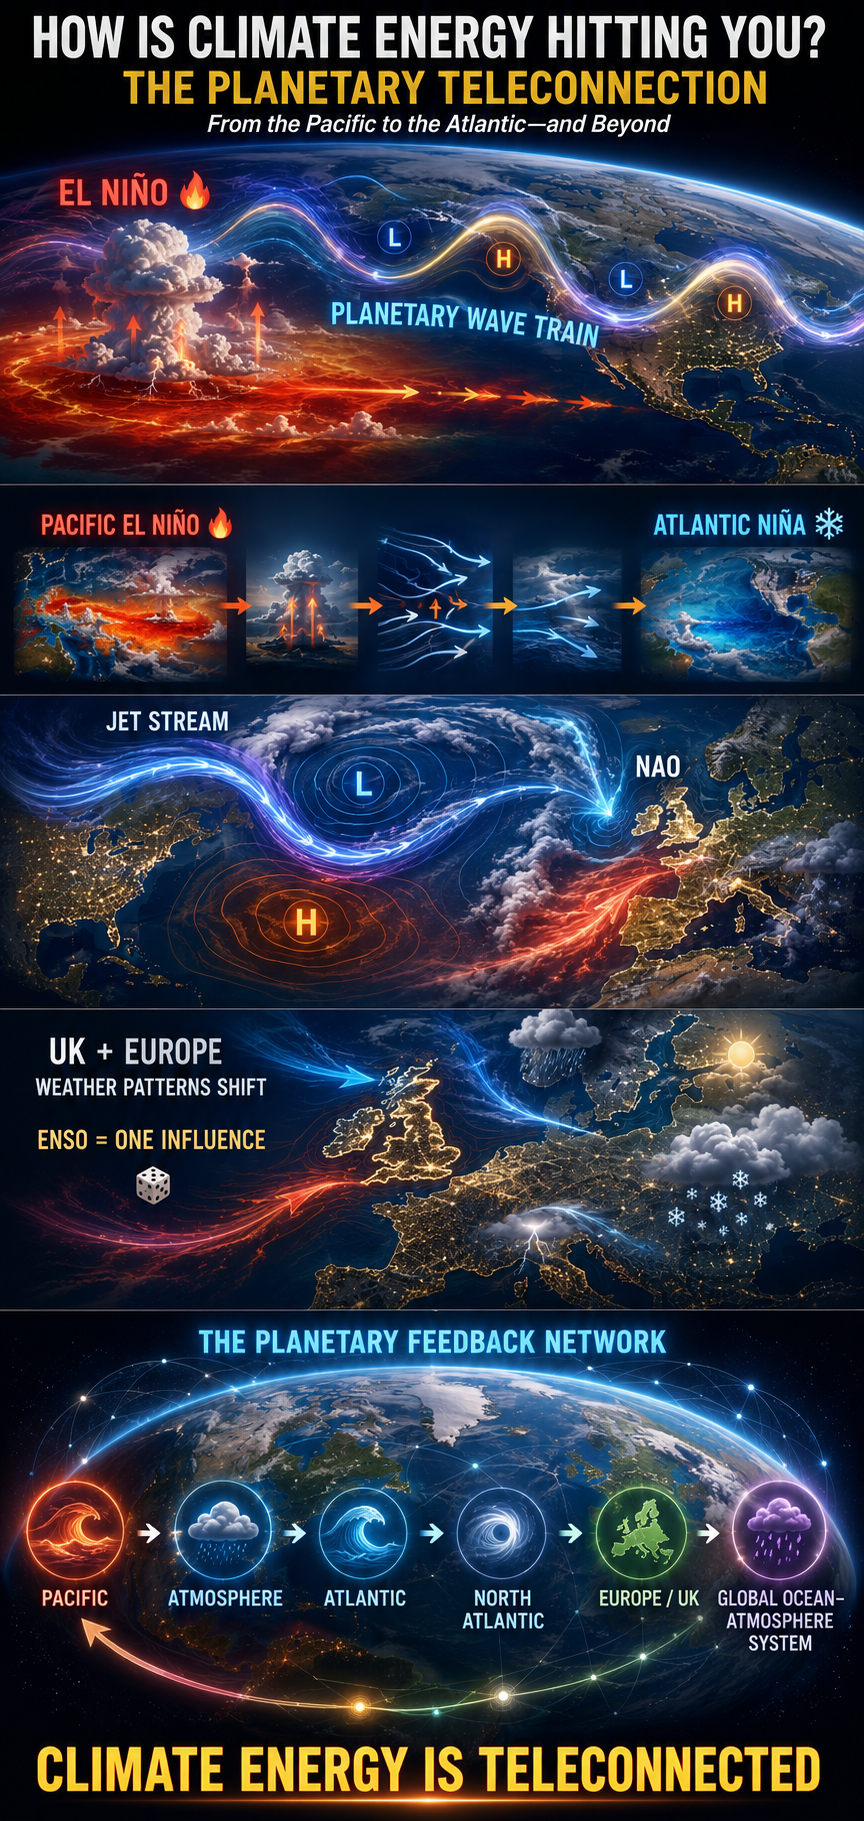
Pacific El Niño ↓ Shifted tropical convection ↓ Walker circulation response ↓ Changes in tropical pressure and winds ↓ Atlantic trade-wind response ↓ Ocean circulation and sea-surface temperature changes
This atmospheric bridge helps explain how a warming anomaly in the Pacific can coincide with cooling in the tropical Atlantic.
Atlantic → North Atlantic → Europe
The teleconnection can extend farther north.
Changes in tropical heating and atmospheric wave patterns can influence the North Atlantic jet stream and pressure fields, including variations associated with the North Atlantic Oscillation (NAO). These changes can alter the path of Atlantic storms and the transport of heat and moisture toward Europe.
The United Kingdom sits downstream of this North Atlantic circulation and can therefore experience changes in the probability of particular weather regimes—even though the original oceanic disturbance began thousands of miles away in the tropical Pacific.
The relationship is probabilistic, not deterministic. ENSO is one influence among many, and the eventual European response depends on the season, the state of the North Atlantic, stratospheric conditions, and other interacting climate modes.
A Planetary Feedback Network
The important point is that this is not a simple one-way pipeline.
PACIFIC 🔥 El Niño ↓ ATMOSPHERE Walker circulation + planetary waves ↓ ATLANTIC Trade winds + ocean response ↓ NORTH ATLANTIC Jet stream + NAO ↓ EUROPE / UK Weather-pattern response ↓ GLOBAL OCEAN–ATMOSPHERE SYSTEM ↓ PACIFIC
The final connection back toward the Pacific should not be interpreted as a single atmospheric current literally traveling around the planet. Instead, it represents coupled feedbacks within the global climate system. Changes in one ocean basin alter atmospheric circulation; those atmospheric changes affect other ocean basins and land surfaces; and those changes can subsequently feed back into the global circulation system.
ENSO is therefore not simply a Pacific phenomenon.
It is a planetary-scale disturbance that can reorganize atmospheric and oceanic conditions across multiple basins and continents.
One ocean warms. The atmosphere responds. The response travels. The planet adjusts.
3. Amplification of Atlantic Trade Winds
Pressure gradients: The redistribution of rising and sinking air modifies sea-level pressure across the tropical Atlantic. A stronger pressure gradient can develop along the equatorial Atlantic.
Stronger easterly winds: The resulting pressure gradient can strengthen the Atlantic trade winds. These persistent easterlies are critical because they directly interact with the ocean surface.
The atmosphere has effectively rerouted part of the Pacific’s excess energy through a planetary-scale circulation response, creating conditions that can cool a distant ocean basin.
4. Wind-Driven Ocean Upwelling
Surface-water displacement: Stronger easterly trade winds push warm surface waters westward across the equatorial Atlantic and alter the distribution of ocean heat.
Cold water rises: As surface waters are displaced, deeper, colder water can rise toward the surface through equatorial upwelling. This water is typically cooler and richer in nutrients than the surface layer.
The Atlantic Niña emerges: When the resulting cooling is sufficiently strong and persistent, tropical Atlantic sea-surface temperatures can fall substantially below normal, producing the characteristic cold anomaly known as an Atlantic Niña.
The Atlantic cooling is therefore not an isolated ocean event. It can be part of a larger coupled atmosphere–ocean response initiated thousands of miles away in the Pacific.
The Atmospheric Shield: A Planetary Teleconnection Comes Full Circle
When a Pacific El Niño and an Atlantic Niña occur together, their effects can reinforce one another over the tropical Atlantic. But the hurricane response is only one part of a much larger planetary circulation story.
The resulting Atlantic conditions can then influence tropical cyclone development.
El Niño tends to increase vertical wind shear, disrupting the organization of developing tropical cyclones. At the same time, cooler tropical Atlantic waters reduce the oceanic heat available to support deep convection and storm intensification.
Together, these effects can create an atmospheric shield over the Atlantic hurricane-development region:
ATLANTIC NIÑA ❄️ Cooler ocean ↓ Less convective energy
EL NIÑO 🔥 Pacific warming ↓ Stronger vertical wind shear
Combined effect ↓ Less favorable conditions for Atlantic tropical cyclones
This does not mean an Atlantic hurricane season becomes impossible. Tropical cyclone activity depends on many interacting factors, including sea-surface temperatures, atmospheric moisture, vertical wind shear, African easterly waves, upper-level circulation, and broader Atlantic climate conditions.
One Planetary System
The deeper significance is the connection itself.
A thermal anomaly in the Pacific can reorganize tropical convection. That atmospheric reorganization can propagate through the global circulation system, altering pressure and winds over the Atlantic. Those winds can change ocean upwelling and sea-surface temperatures. The resulting ocean anomaly can then modify atmospheric moisture, convection, and storm development.
The signal can extend even farther through the North Atlantic jet stream and atmospheric wave patterns, influencing weather regimes across Europe and the United Kingdom.
This is not a single atmospheric current traveling around the planet. It is a coupled network of atmospheric and oceanic responses operating across different spatial and temporal scales.
What begins as:
PACIFIC WARMING 🔥
can become:
ATMOSPHERIC REROUTING
then:
ATLANTIC COOLING ❄️
and ultimately:
REGIONAL WEATHER + HYDROCLIMATIC CONSEQUENCES
The climate system is therefore not a collection of isolated ocean basins and weather systems.
Energy moves through the connections. The atmosphere carries the signal. The oceans respond. Feedbacks propagate.
One planet. One interconnected climate system.
Public Access Version
Tonight’s homework assignment is about climate chaos.
The climate system is chaotic. I started out researching the odd ENSO coupling — Pacific El Niño + Atlantic Niña. Usually, the Pacific and Atlantic pretty much “do their own thing.”
But this year is different.
The climate system has been supercharged with energy, and that energy is manifesting in some strange and surprisingly interconnected ways.
How Is Climate Energy Hitting You? Rerouting the Walker Circulation
This is a story about teleconnections.
That proverbial butterfly wing flapping in the Pacific… flutters across the atmosphere… affects the USA… and messes with the Atlantic.
At some point during this homework assignment, I thought to myself:
“I wonder if this teleconnection is… planetary?”
Does it hit Rocky Rex in the UK? 🇬🇧
A: Yes. Yes, it does.
And if you keep following the atmospheric energy and the feedbacks, you discover something even more interesting:
It isn’t just a Pacific–Atlantic connection.
It’s a planetary teleconnected climate system, where disturbances propagate through the atmosphere and oceans, affecting distant regions—and feeding back into the system.
One ocean warms. The atmosphere responds. The response travels. The planet adjusts.
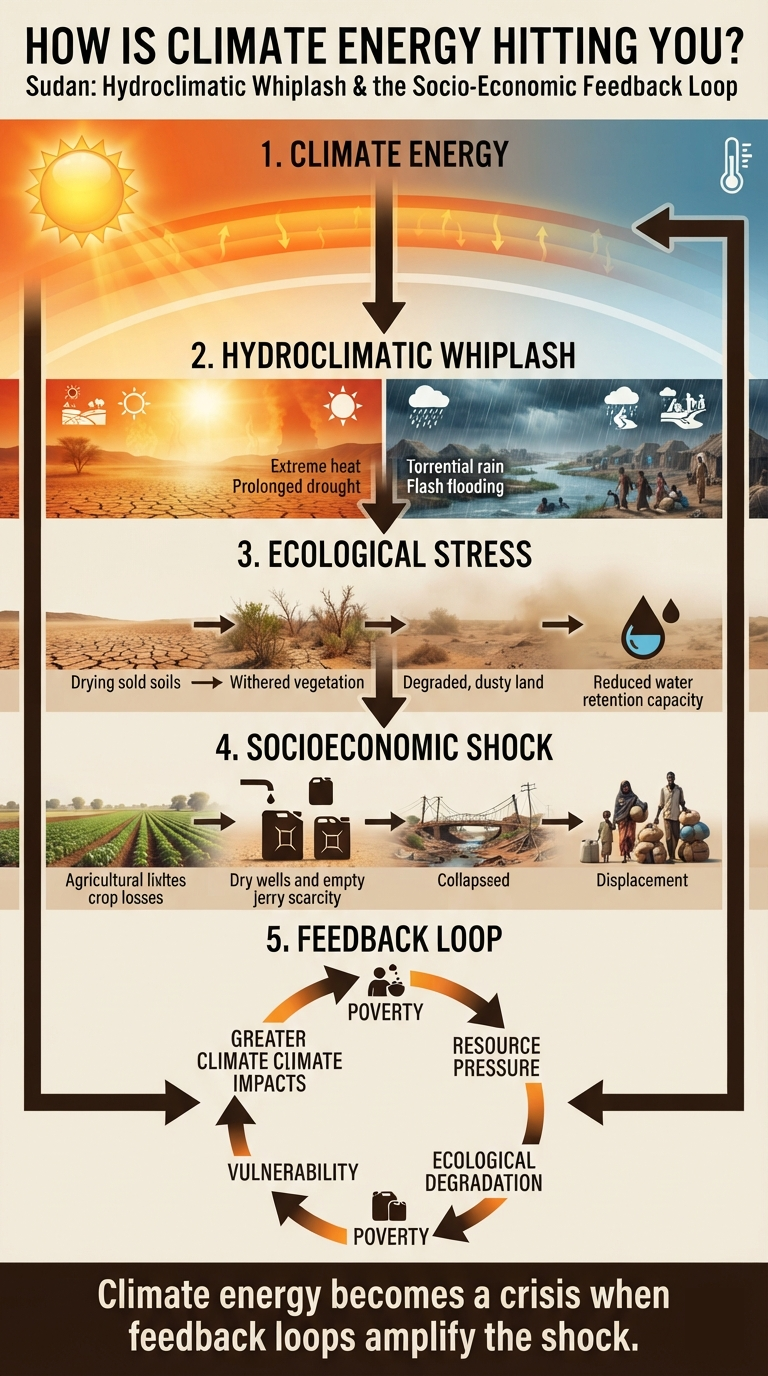
Sudan: Hydroclimatic Whiplash and the Socio-Economic Feedback Loop
Sudan is experiencing more than a succession of extreme weather events. It is experiencing a coupled climate, ecological, and socioeconomic crisis in which each shock weakens the systems needed to absorb the next one.
Extreme heat increases water demand and accelerates soil and vegetation stress. Drought reduces agricultural productivity. Then intense rainfall arrives, producing flash floods that destroy crops, homes, roads, dams, and water infrastructure. Conflict magnifies the damage by degrading institutions, displacing populations, destroying infrastructure, and forcing people to rely more heavily on already-stressed natural resources.
The result is a reinforcing feedback loop:
Climate energy → hydroclimatic extremes → ecological degradation → economic losses → displacement and resource pressure → weakened infrastructure and institutions → greater vulnerability → larger impacts from the next climate extreme.
This is hydroclimatic whiplash interacting with socioeconomic vulnerability.
The Climate Shock Is Only the Beginning
A warmer climate does not simply produce more heat. Additional energy in the climate system can intensify the hydrological cycle, increasing atmospheric moisture demand while creating conditions for more intense precipitation when moisture is released.
Sudan is particularly vulnerable because millions of people depend directly or indirectly on rainfall, agriculture, groundwater, grazing lands, and fragile infrastructure.
A period of extreme heat and drying can therefore initiate a chain reaction. Heat increases evaporation and evapotranspiration. Soils lose moisture. Vegetation becomes stressed. Agricultural productivity declines. Water demand increases. Households and farmers draw more heavily on remaining water resources. Then, when intense rainfall arrives, degraded soils and damaged landscapes may have less capacity to absorb and retain water. Runoff increases. Flooding intensifies. Crops are destroyed. Infrastructure fails.
And the socioeconomic damage begins feeding back into the ecological system.
Hydroclimatic Whiplash
The most important feature is not simply that Sudan experiences droughts and floods.
It is the rapid alternation between them.
Prolonged heat and drying can be followed by intense, irregular rainfall. Communities already weakened by drought have fewer resources available to respond when flooding arrives.
The same climate energy can therefore produce apparently opposite hazards—drought and flood, scarcity and excess—within the same broader system.
Ecological Degradation Becomes an Economic Feedback
Environmental degradation is not merely an ecological consequence of the crisis. It can become an amplifier of socioeconomic risk.
Vegetation provides natural protection against erosion, slows runoff, promotes infiltration, stores carbon, and helps moderate local temperatures.
When forests and other vegetation are removed, those ecological services decline.
In Khartoum, the loss of large areas of green cover has reduced natural buffering against heat and intense rainfall. Conflict and desperate resource extraction can accelerate this process as displaced and impoverished populations become increasingly dependent on local biomass for fuel and other necessities.
The people most dependent on the natural environment are often the people least able to absorb its degradation.
Conflict Accelerates the Feedback
Sudan’s civil war dramatically increases the speed and severity of these feedbacks.
Conflict destroys roads, electrical systems, water infrastructure, health facilities, housing, agricultural assets, and government institutions. It also displaces people from established livelihoods and concentrates populations in places with limited resources.
The result is a reduction in adaptive capacity at precisely the moment climate volatility is increasing. A functioning society can respond to a flood by evacuating people, repairing roads, restoring electricity, treating contaminated water, rebuilding homes, and providing emergency food. A society experiencing war may be unable to do any of those things at sufficient scale. Consequently, the same physical climate event produces a much larger socioeconomic impact.
And that impact creates the conditions for the next crisis.
Water: The Central Feedback
Water connects nearly every component of Sudan’s crisis. Extreme heat increases atmospheric demand for moisture and raises human and agricultural water requirements. Drought reduces available water. Power failures can prevent wells and pumps from operating. Flooding can contaminate water supplies and damage water infrastructure. Displacement increases demand in receiving communities. Damaged infrastructure reduces distribution capacity. Unsafe water increases health risks. Illness reduces household productivity and increases economic stress. The system can therefore become self-reinforcing:
Heat → water demand → infrastructure stress → water scarcity → socioeconomic stress → reduced resilience → flood damage → contaminated water → health and economic losses.
Water is not simply another resource being affected by climate change. It is the connecting medium through which climate, ecology, infrastructure, health, agriculture, and economics interact.
Agriculture: Where Climate and Economy Collide
Agriculture is particularly sensitive to hydroclimatic whiplash.
Drought and extreme heat can reduce yields, deplete soil moisture, damage livestock, and consume seed reserves. Then intense rainfall can wash away soil, flood fields, destroy standing crops, and delay planting or harvesting.
A failed harvest has consequences beyond the farm. Food prices rise. Household purchasing power falls. Farmers lose income. Seed stocks decline. Livestock assets are depleted. Families sell productive assets to survive. Malnutrition increases. Migration and displacement accelerate. And the next growing season begins with fewer resources.
The feedback can therefore look like:
Climate shock → crop failure → income loss → asset depletion → reduced productive capacity → greater vulnerability to the next climate shock.
This is how a meteorological event becomes an economic event—and eventually a humanitarian event.
Displacement Creates New Ecological Pressure
Displacement adds another layer to the feedback system. People fleeing conflict or flooding must find food, water, shelter, fuel, and land. Large concentrations of displaced populations can place enormous pressure on surrounding forests, groundwater, agricultural land, and grazing areas. As resources become depleted, competition increases. Environmental degradation accelerates. Local livelihoods become less viable. More people become dependent on humanitarian assistance or migration.
The feedback therefore extends beyond individual households:
Extreme event → displacement → resource pressure → ecological degradation → livelihood loss → further displacement.
Institutions are another component of the feedback loop. Effective meteorological services, flood monitoring, early-warning systems, emergency communications, and local governance can reduce the consequences of extreme weather. But conflict has severely weakened Sudan’s institutional capacity, including its ability to provide reliable meteorological information and early warnings.
That creates an important asymmetry:
The climate hazard can intensify faster than society’s capacity to respond to it.
When institutional capacity declines, the same amount of climate energy produces greater damage. Greater damage then further reduces institutional and economic capacity.
That is a reinforcing feedback.
The Socio-Economic Multiplier
The critical point is that climate change does not need to directly cause every component of Sudan’s crisis to substantially amplify it.
War is not caused by climate change. Poverty is not caused by climate change. Infrastructure destruction is not caused by climate change. But climate extremes can make each of these problems harder to manage.
Likewise, war, poverty, environmental degradation, and infrastructure failure do not cause climate change—but they can dramatically increase the damage produced by a given climate hazard.
This is why vulnerability matters. The physical climate signal enters a system that already contains feedbacks.
Those feedbacks determine how large the final impact becomes.
From Climate Energy to Human Consequences
Sudan provides a powerful example of how climate energy propagates through a coupled human-environment system.
The pathway is not simply:
Climate change → extreme weather → disaster.
It is closer to:
Climate energy ↓ Heat and hydroclimatic volatility ↓ Water and agricultural stress ↓ Ecological degradation ↓ Economic losses ↓ Displacement and resource pressure ↓ Infrastructure and institutional stress ↓ Reduced adaptive capacity ↓ Greater vulnerability ↓ Larger impacts from the next extreme event ↺
That final arrow is the most important part.
It turns a sequence of disasters into a feedback system.
Sudan as a Climate-Energy Feedback Experiment
Sudan demonstrates why climate risk cannot be understood through temperature records or individual disasters alone.
The important question is not simply:
How much hotter is it?
It is:
What does that additional energy do when it enters a stressed ecological and socioeconomic system?
In Sudan, it is interacting with water scarcity, extreme rainfall, agricultural vulnerability, environmental degradation, displacement, infrastructure failure, institutional collapse, and conflict.
Each component can reinforce the others.
The result is a system in which ecological degradation increases socioeconomic vulnerability, while socioeconomic stress accelerates ecological degradation.
Climate change supplies the additional energy.
Hydroclimatic whiplash supplies the shocks.
And the ecological and socioeconomic feedback loops determine how those shocks propagate through society.
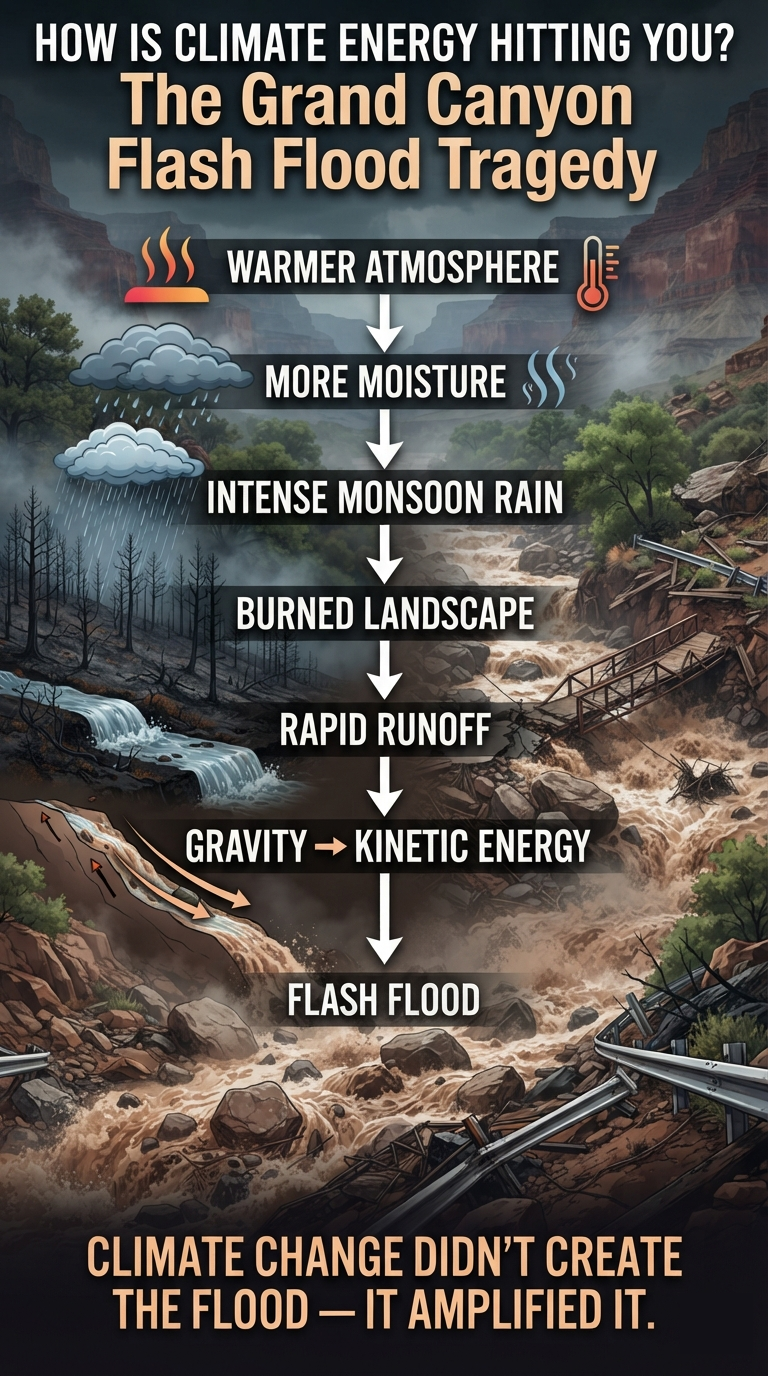
A devastating flash flood on August 29, 2026, tore through Grand Canyon National Park, leaving one person dead and approximately 15 people missing or unaccounted for. The disaster struck around 2:30 p.m. following intense rainfall on the Kaibab Plateau. Up to an inch of rain fell in just 20 to 30 minutes, sending an enormous surge of water cascading down the steep terrain into Bright Angel Canyon and the Phantom Ranch area.
The sudden deluge unleashed massive torrents that destroyed nearly every footbridge over Bright Angel Creek, forced the helicopter evacuation of more than 60 hikers and campers, and swept heavy boulders, trees, mud and metal debris into the Colorado River.
Emergency crews recovered the body of a 46-year-old man Sunday evening near Crystal Rapids.
This was not simply a lot of rain.
It was atmospheric water being converted into enormous amounts of kinetic energy in a matter of minutes.
And the conditions that made the landscape so vulnerable are increasingly being shaped by climate change.
Infrastructure and Park Impact
The flash flood caused severe and widespread damage to the inner canyon’s ecosystem and infrastructure.
Water Logistics: The flood ruptured the park’s critical water pipeline, forcing immediate water restrictions. Because the pipeline supplies essential water and fire-suppression capacity, overnight lodging within Grand Canyon National Park was suspended beginning August 31, 2026, while officials addressed the water emergency.
Transit Closures: The Colorado River was closed to river traffic because of hazardous floating debris and metal structures.
Trail Closures: The Black Bridge and Silver Bridge crossings of the Colorado River were closed, as was the North Kaibab Trail.
The destruction occurred extraordinarily quickly.
A few inches of atmospheric water falling over a few minutes became a moving wall of water, carrying enough energy to move massive rocks and debris, destroy bridges and fundamentally reshape portions of the canyon.
The Climate Connection
Monsoon storms are not new to the American Southwest. Flash floods have always occurred in the Grand Canyon. But saying that flash floods are natural does not mean climate change is irrelevant.
Climate change is altering the energy and moisture conditions under which these storms occur—and it is also altering the landscape through which that water moves.
As temperatures rise, the atmosphere can hold substantially more water vapor. The Clausius-Clapeyron relationship tells us that the atmosphere’s capacity to hold water vapor increases by approximately 7% for every 1°C of warming.
More atmospheric moisture means more potential precipitation energy available to intense storms. When that moisture is released rapidly through a powerful convective storm, enormous quantities of water can fall over a very small area in a very short period of time. That is exactly the kind of event that produces flash flooding in steep terrain.
But there is another part of the climate connection.
Wildfire Changes the Landscape
Climate change is also contributing to hotter, drier conditions and an increasingly dangerous wildfire environment across the American West. Wildfire strips vegetation from the landscape and can dramatically alter soil properties. Severe burns can leave soils far less capable of absorbing intense rainfall. Then the monsoon arrives.
Instead of rainfall being intercepted by vegetation and gradually infiltrating the ground, a much larger fraction can become rapid surface runoff.
The National Park Service has specifically warned that areas affected by the Dragon Bravo Fire are particularly vulnerable to flash flooding and debris flows during monsoon storms.
This is where climate energy becomes visible.
When Climate Energy Becomes Kinetic Energy
The atmosphere supplies the water. The landscape supplies the gravitational potential. The canyon converts that potential energy into motion.
Rain falling on the Kaibab Plateau enters steep drainage channels. As the water rapidly descends toward Bright Angel Creek and the Colorado River, gravitational potential energy is converted into kinetic energy.
And the water begins carrying the landscape with it. Rocks. Boulders. Trees. Sediment. Mud. Ash. Metal. Infrastructure.
The result is a fluidized mass capable of enormous destructive force.
A rainfall event lasting only 20 or 30 minutes can therefore produce geological-scale consequences.
Atmospheric energy becomes hydrologic energy. Hydrologic energy becomes gravitational energy. Gravitational energy becomes kinetic energy. Kinetic energy becomes destruction.
That is the physics of the event.
Climate Change Doesn’t Have to Create the Hazard
One of the most important points about climate attribution is that climate change does not have to invent a completely new type of weather event to make the event more dangerous. The Grand Canyon has always experienced monsoons. It has always experienced flash floods. It has always experienced erosion.
But climate change can change the background state of the system.
A warmer atmosphere can contain more moisture. Hotter and drier conditions can increase wildfire risk. Wildfires can remove vegetation and alter soils. A burned watershed can produce much faster runoff. And when extreme precipitation arrives, the same amount of rain—or potentially more rain—can produce a substantially different physical response.
The climate system is therefore not merely changing the weather.
It is changing the conditions under which weather interacts with the landscape.
Hydroclimatic Whiplash
This is one expression of hydroclimatic whiplash: rapid transitions between extreme drying and extreme wetting as increasing climate energy moves through the hydrological cycle.
First comes heat and drying. Then wildfire. Then atmospheric moisture. Then extreme precipitation. Then runoff. Then erosion and debris flows. The landscape can go from severely water-stressed to violently inundated in a matter of hours.
That is the whiplash.
And the Grand Canyon provides an almost perfect natural laboratory for watching the process unfold because steep terrain concentrates and accelerates the movement of water.
The Bigger Picture
The August 29 tragedy is therefore more than another isolated weather disaster. It is a powerful example of how climate energy can move through a coupled atmosphere-landscape system. The atmosphere held the moisture. The storm released it. The burned and altered landscape failed to absorb it. Gravity accelerated it. The canyon concentrated it.And the resulting kinetic energy moved rocks, debris and infrastructure toward the Colorado River.
One person died. Approximately 15 people remained missing or unaccounted for. More than 60 people had to be evacuated by helicopter. Bridges were destroyed. Trails were closed. The Colorado River was closed to river traffic. Critical water infrastructure was ruptured. And the landscape itself was reshaped.
This is what climate change looks like when you follow the energy.
It is not just a number on a temperature chart. It is not just a rising global average. It is not just another hotter summer.
Climate energy moves.
It moves through the atmosphere as heat and moisture.
It moves through storms as precipitation.
It moves through watersheds as runoff.
It moves downhill as gravitational energy.
And eventually, it becomes kinetic energy powerful enough to move boulders, destroy bridges and sweep human beings away.
The Grand Canyon has always been a place where the forces of geology are visible.
On August 29, 2026, those forces became brutally visible again.
Climate change didn’t create the Grand Canyon flash flood—it amplified the energy that drove it.
A warmer, more energetic climate can make the atmospheric and landscape conditions that produce such disasters more extreme.
And when that energy is released all at once, the question is no longer simply:
How much rain fell?
The more important question is:
How much energy did that rain unleash?
That is How Is Climate Energy Hitting You?
In the Grand Canyon, on August 29, 2026, the answer was:
As a wall of water, rock, mud and debris moving through the canyon with enough energy to destroy almost everything in its path.
The permafrost tipping point—and its feedbacks with other tipping points—is the most interesting part to me. Permafrost was kind of the glue holding everything together… until 1.5°C. Then the coupled feedbacks start feeding each other, and the whole system begins to unravel. And the mountains crumble to the sea… see? 😉
The Backyard Experiments: Hydroclimatic Whiplash, Soil Degradation, Insect Decline, and Ecosystem Collapse
By Daniel Brouse
Have You Looked Out Your Back Door for Climate Change?
It’s there.
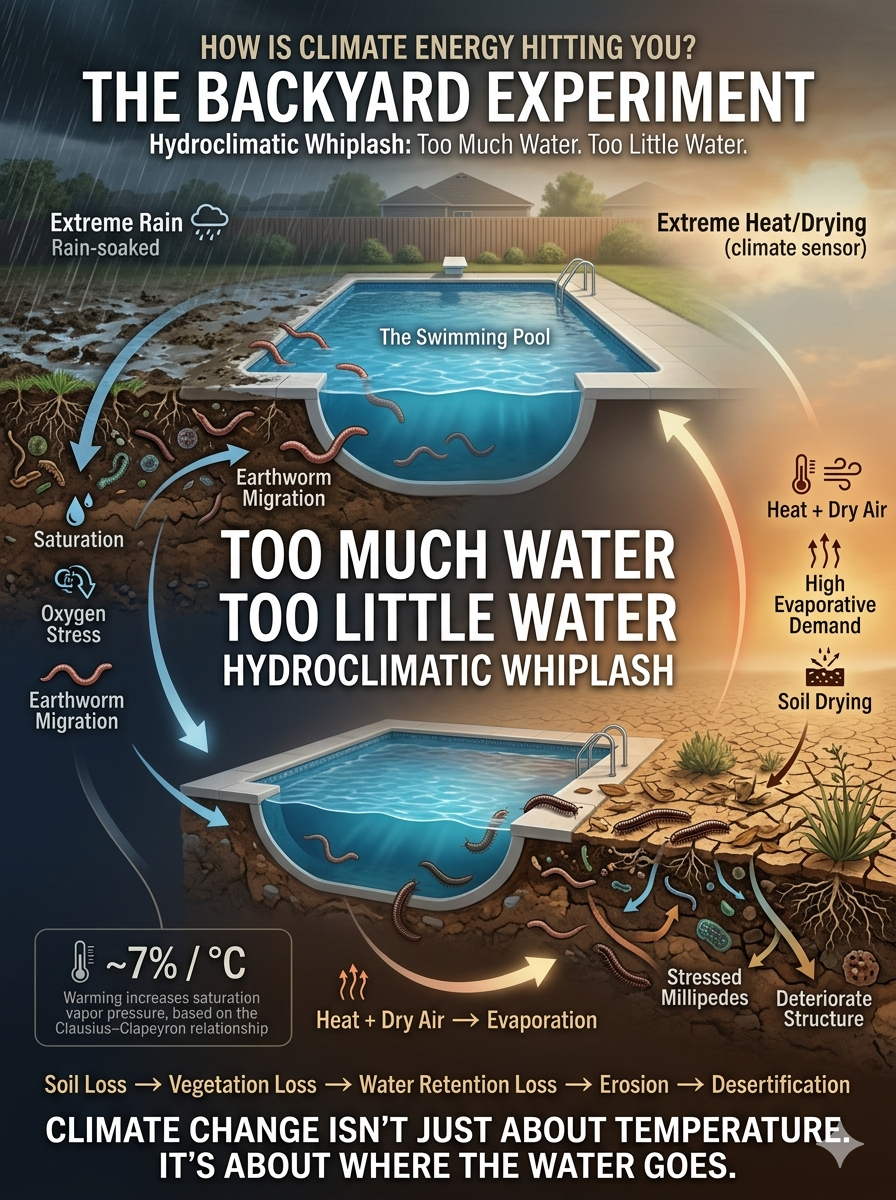
I noticed an interesting phenomenon: an increase in dead earthworms and millipedes in the swimming pool.
It turns out this is connected to opposite extremes of a coupled feedback loop.
Too wet. Then too dry. Then too wet. Then too dry.
That is hydroclimatic whiplash, and it was destroying the ecosystem that is my backyard.
What initially appeared to be two unrelated observations—earthworms at the bottom of the swimming pool after extreme rainfall and millipedes at the bottom during periods of intense drying—began to look like two sides of the same climate-energy problem: too much water, followed by too little.
The backyard was being hit from both directions.
TOO MUCH WATER
Earthworms commonly move toward the soil surface when soils become saturated. Heavy rainfall can produce much larger and more rapid changes in soil moisture and oxygen availability than gentle, prolonged rainfall.
The swimming pool then becomes an accidental trap.
Millipedes are fundamentally creatures of moist microhabitats.
They live in leaf litter, soil, rotting wood, and other environments where humidity remains relatively high. Their survival depends on maintaining water balance in an environment that is normally protected from direct solar heating and rapid atmospheric drying.
When extreme evaporative demand suddenly arrives, that microclimate can collapse.
The same atmospheric conditions that pull extraordinary amounts of water from a swimming pool can also pull moisture from the soil and leaf litter where millipedes live.
Extreme evaporative demand amplifies evapotranspiration, a core component of Earth’s climate system that links soil, vegetation, and atmosphere through continuous water and energy exchange.
Extreme rainfall can cause erosion, nutrient loss, oxygen stress, physical disruption, and mortality among soil organisms.
Extreme drying can produce an entirely different set of stresses: dehydration, vegetation loss, declining microbial activity, loss of organic matter, and collapse of moisture-dependent habitat.
This was evident across the soil layers in my backyard:
Epigeic — Surface Dwellers
Endogeic — Shallow Soil Dwellers
Anecic — Deep Burrowers
Both too much rain and not enough rain resulted in mass casualties within the same week—and on multiple occasions during a single season.
That is not simply a wet-dry cycle.
It is an ecological stress cycle.
The soil receives an extreme pulse of water, followed by extreme atmospheric demand for water.
Then the process repeats.
The organisms living in the soil are caught between extremes.
WHEN SOIL DIES
When soil dies, it undergoes desertification.
Desertification is the transformation of productive, biologically functioning land into degraded land with declining capacity to support vegetation and ecosystem processes.
As soil loses organic matter, biological activity, structure, and water-holding capacity, it becomes increasingly vulnerable to erosion and drying.
When soil can no longer retain water effectively, rainfall increasingly becomes runoff rather than stored moisture. When the atmosphere demands water, there is less moisture available to sustain vegetation. The result is a landscape increasingly vulnerable to both flooding and drought.
That is the climate paradox of degraded soil:
Too much water can destroy its structure.
Too little water can destroy its biology.
Repeatedly alternating between the two can destroy its resilience.
As this process advances, the land can cross from a productive biological system into a degraded one.
That is desertification.
And once the soil’s biological engine begins to fail, its capacity to sequester and store carbon declines as well.
The climate feedback then becomes even more serious:
Soil therefore acts as both a carbon reservoir and a climate buffer.
Destroy the soil, and you weaken both.
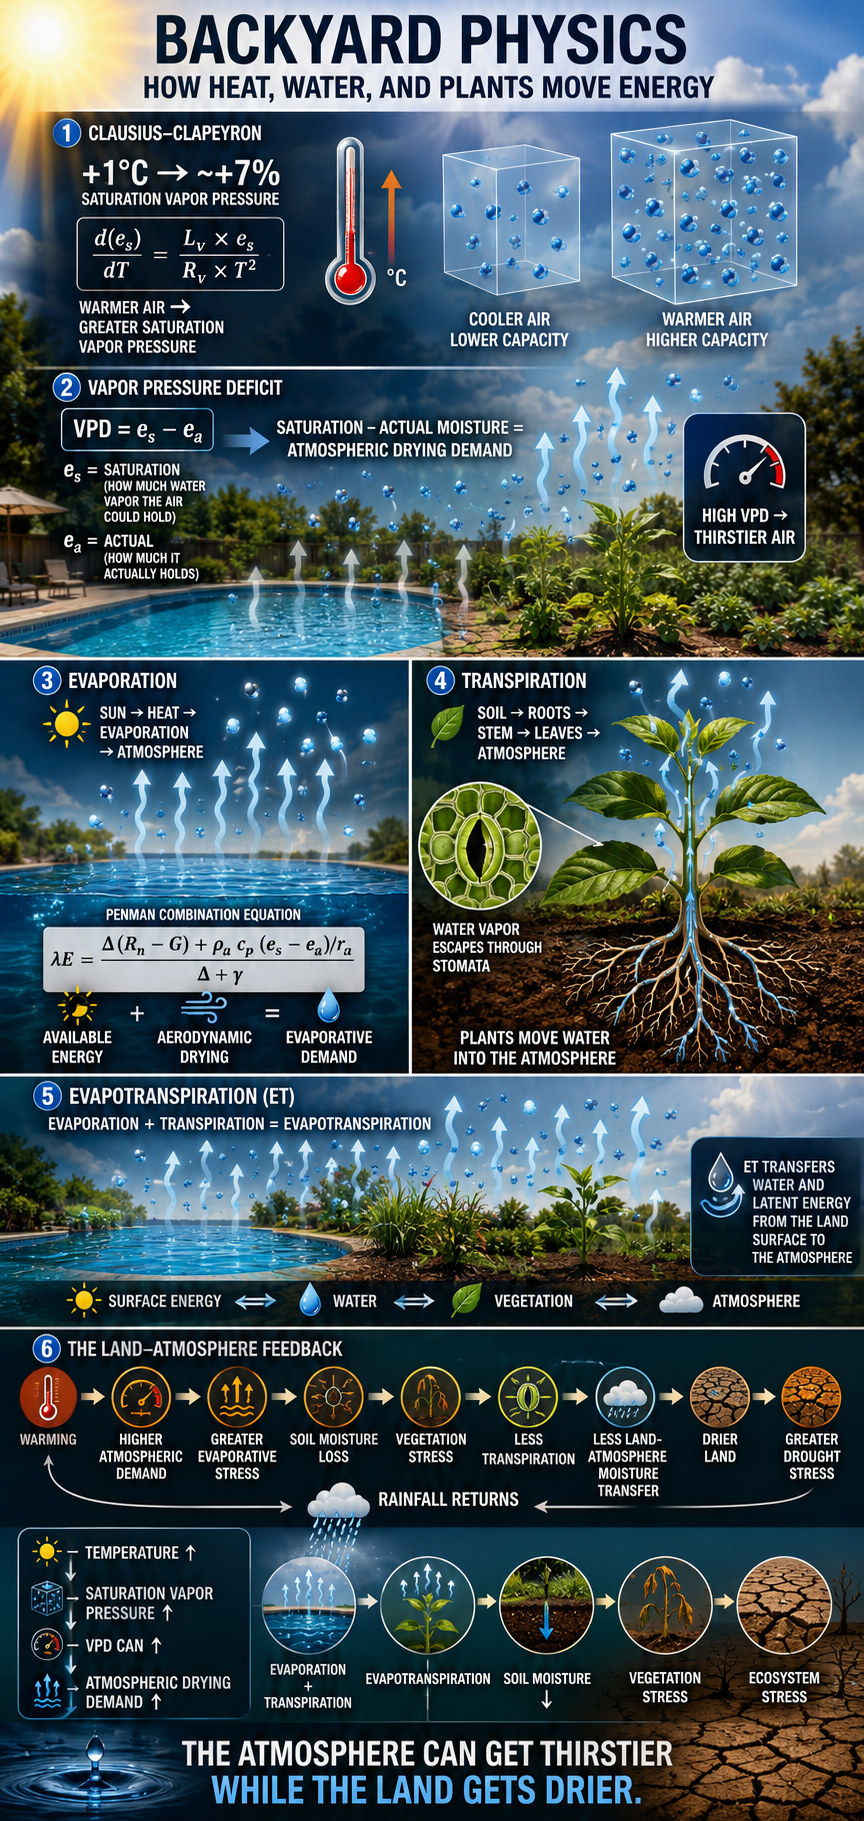
BACKYARD PHYSICS
The backyard observations can be connected to fundamental physical relationships governing Earth’s water and energy cycles.
Two of the most important are the Clausius–Clapeyron relationship and the Penman combination equation.
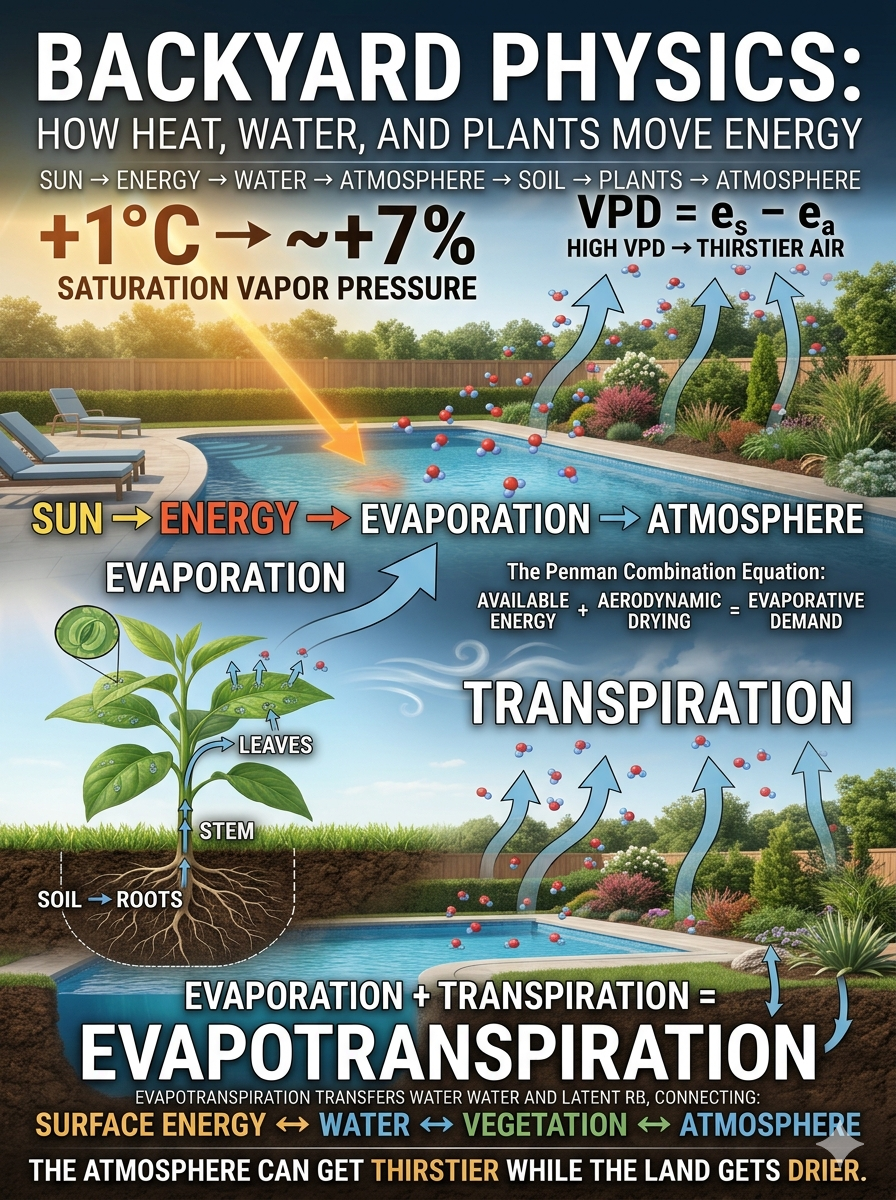
The Clausius–Clapeyron relationship describes how saturation vapor pressure changes with temperature.
The Penman combination equation describes how available surface energy and atmospheric drying conditions combine to determine evaporative demand.
Together, they help explain the physics behind extreme evaporation.
THE CLAUSIUS–CLAPEYRON RELATIONSHIP
The Clausius–Clapeyron relationship describes the temperature dependence of saturation vapor pressure.
In differential form:
d(e_s)/dT = (L_v × e_s) / (R_v × T²)
where:
e_s = saturation vapor pressure
T = absolute temperature in kelvins
L_v = latent heat of vaporization
R_v = specific gas constant for water vapor
Dividing both sides by e_s gives:
(1/e_s) × (d(e_s)/dT) = L_v / (R_v × T²)
Under typical near-surface atmospheric temperatures, this relationship corresponds approximately to a 7% increase in saturation vapor pressure per 1°C of warming.
In other words, a warmer atmosphere has a substantially greater capacity to contain water vapor before reaching saturation.
That increased capacity matters because it can increase the atmospheric demand for evaporation when water is available.
EXTREME EVAPORATION
For an open water surface such as a swimming pool, evaporation depends on several interacting variables.
A useful framework is the Penman combination equation, which incorporates both the available energy at the surface and aerodynamic drying.
Why are millipedes showing up dead at the bottom of the swimming pool?
The answer may seem strange at first: extreme weather is changing the moisture dynamics of the tiny ecosystem around your home.
Earlier this summer, I wrote about earthworms turning up dead in the pool. Their appearance followed intense rainfall after several dry days—a small example of climate-change-driven hydroclimatic whiplash.
After prolonged dryness, intense rainfall can rapidly saturate the soil and displace oxygen from the pore spaces. Earthworms respond by moving toward the surface, where oxygen is more readily available. But when the surface is saturated, they can still be trapped in an inhospitable environment. As they search for better conditions, some ultimately end up in the swimming pool.
Millipedes are responding to the opposite extreme.
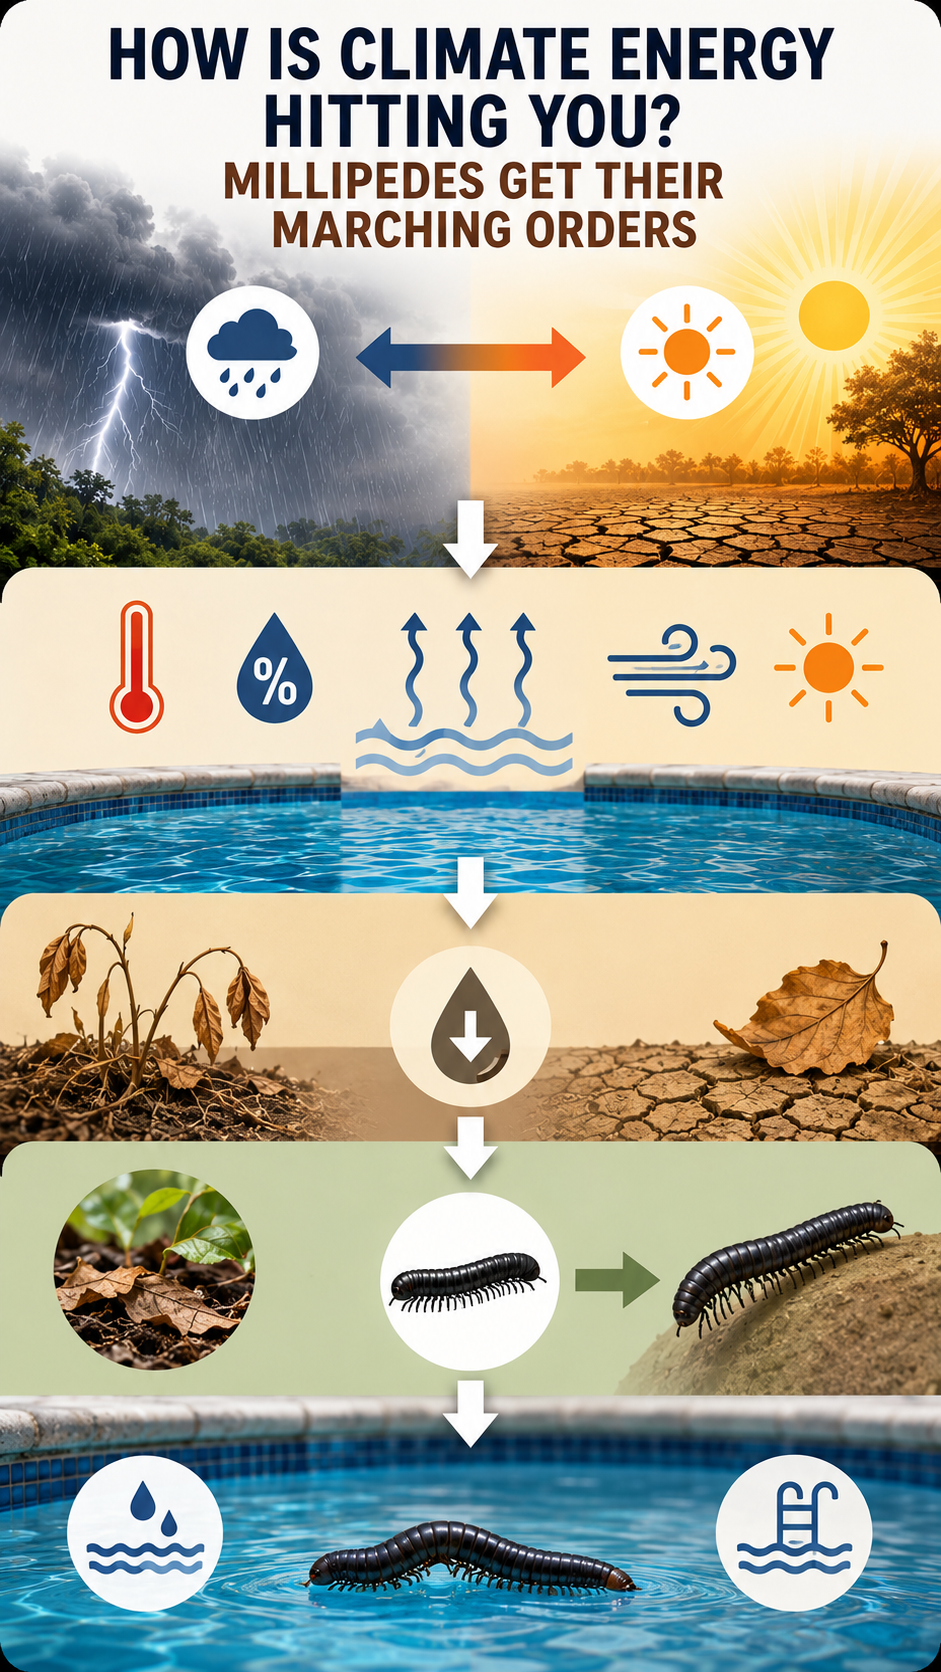
They are showing up after several days without rain, particularly during periods of unusually rapid evaporation. In my backyard, the microclimate can swing from flash rainfall to flash drought within a day or two.
And those swings matter.
When a Swimming Pool Becomes an Evaporation Gauge
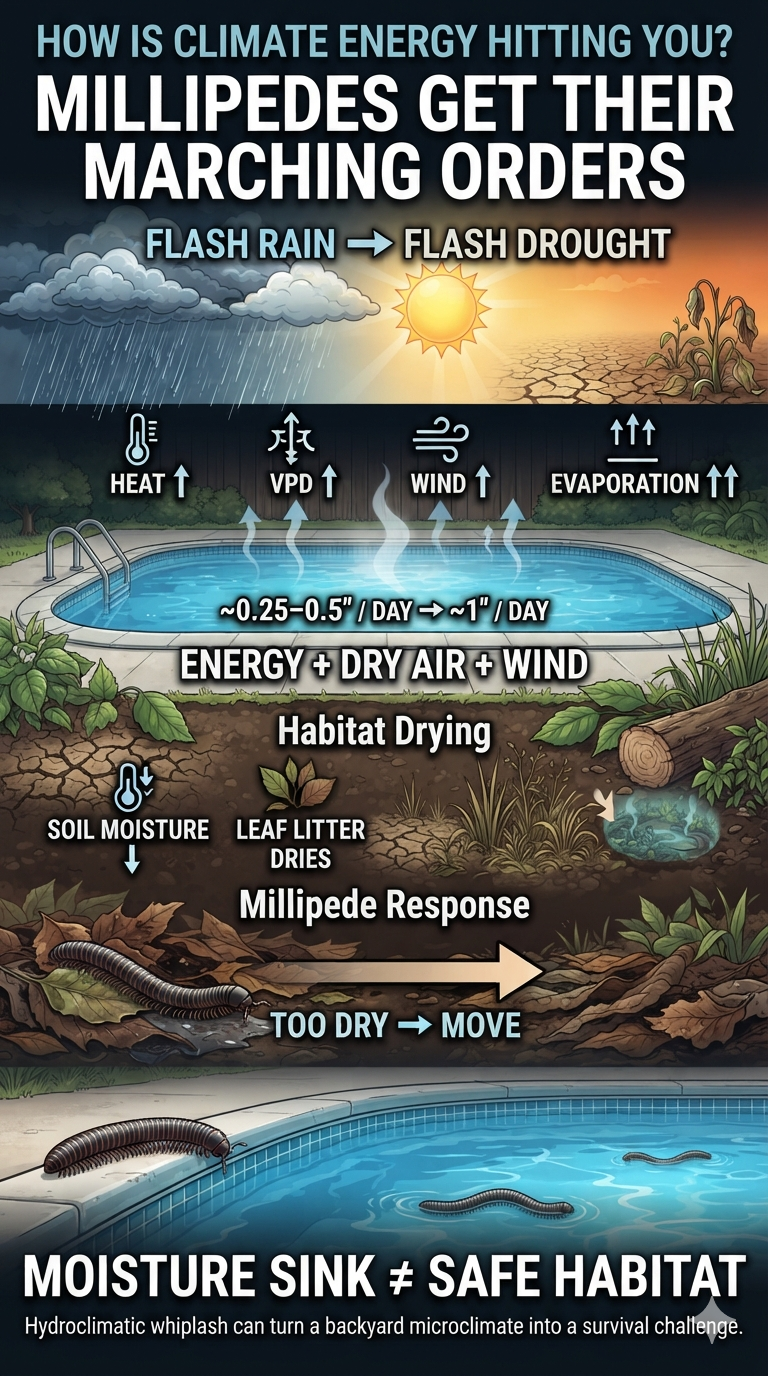
Under ordinary summer conditions, a pool might lose roughly 0.25 to 0.5 inches of water per day, depending on temperature, humidity, wind, solar radiation, pool temperature, and other factors.
During the recent extreme conditions, however, evaporation appeared to approach an inch per day—roughly two to four times a typical baseline.
That isn’t simply a story about hotter temperatures.
It is a story about energy and atmospheric demand for water.
The Clausius-Clapeyron relationship is a fundamental principle of thermodynamics. As temperature rises, the atmosphere’s saturation vapor pressure increases by roughly 7% per °C. A warmer atmosphere can therefore support substantially more water vapor.
But Clausius-Clapeyron alone does not explain a localized three- or four-fold increase in evaporation.
The missing piece is the interaction between temperature and the atmosphere’s ability to remove water from the surface.
The Physics of Extreme Evaporation
For an open water surface, evaporation depends on several interacting variables. A useful framework is the Penman combination equation, which incorporates both the available energy at the surface and aerodynamic drying:
The important point is that evaporation is not controlled by temperature alone.
Three major factors can amplify water loss:
1. Vapor Pressure Deficit
The difference between the saturation vapor pressure at the water surface and the actual vapor pressure of the surrounding air is the vapor pressure deficit (VPD):
When hot, dry air moves over a pool, VPD can become very large.
The water surface is effectively surrounded by air with a strong capacity to accept additional water vapor.
That creates a powerful evaporative gradient.
2. Wind
The aerodynamic term, , represents the influence of wind.
Immediately above a pool is a thin boundary layer of relatively humid air. Wind continually removes that moist layer and replaces it with drier air.
Think of it as nature’s hair dryer.
The stronger the atmospheric mixing, the more efficiently water vapor is transported away from the surface.
3. Solar Radiation
Net radiation, , supplies energy to the system.
Strong, cloudless sunlight transfers energy into the pool and surrounding surfaces. As the water warms, its saturation vapor pressure rises, increasing the potential for evaporation.
The result is not simply:
hotter = more evaporation.
It is:
heat + solar energy + dry air + wind = dramatically increased evaporative demand.
Visualizing the Whiplash Surge
During a normal summer week, these variables remain within a relatively familiar range.
But during hydroclimatic whiplash, they can change rapidly.
The same landscape can therefore move from waterlogged to severely moisture-stressed within days.
That is the physical signature of hydroclimatic whiplash.
The swimming pool becomes an unintended local measuring device for that atmospheric forcing.
The Pool as a Heat Sink
There is another interesting component: the pool’s thermal mass.
Water has a high heat capacity. After cool nights, the pool can retain substantial stored thermal energy. When brutally hot, dry air moves over that relatively warm water, the temperature and vapor-pressure gradients can become especially favorable for evaporation.
The atmosphere is essentially pulling moisture out of the pool while the pool supplies some of the energy required to make that phase change possible.
That is why an isolated observation of “one inch of evaporation” should not automatically be interpreted as a simple temperature effect.
It is the result of an energy-balance and mass-transfer process—and these are precisely the weather conditions we have been experiencing.
And that brings us back to the millipedes.
Evapotranspiration and the Penman Combination Equation
In hydrology and climate science, evapotranspiration (ET) is the standard term for the combined movement of water from the land surface into the atmosphere through soil evaporation and plant transpiration.
The topsoil experiences a process similar to what happens at the surface of a swimming pool. When the atmosphere becomes hot, dry, and windy, the vapor pressure deficit (VPD) increases, strengthening the gradient that drives water from the surface into the atmosphere:
Low humidity → high VPD → wind → extreme evaporation
But the process does not stop at the surface. Transpiration draws water from deeper in the soil through plant roots and transports it upward through the plant, where it exits as water vapor through microscopic pores called stomata.
During periods of extreme heat and atmospheric dryness, this combined evaporative demand can rapidly deplete available soil moisture, increasing water stress on vegetation and accelerating the drying of the entire soil–plant system.
Millipedes are fundamentally creatures of moist microhabitats.
They live in leaf litter, soil, rotting wood, and other environments where humidity remains relatively high. Their survival depends on maintaining water balance in an environment that is usually protected from direct solar heating and rapid atmospheric drying.
When extreme evaporative demand suddenly arrives, that microclimate can collapse.
The same atmospheric conditions that pull an extraordinary amount of water from a swimming pool can also pull moisture from the soil and leaf litter where millipedes live.
1. The Desiccation Trap
Millipedes are vulnerable to water loss because their bodies are not as well protected against desiccation as those of many terrestrial arthropods.
During periods of high VPD, water is lost more rapidly to the surrounding atmosphere.
The drier the air becomes, the stronger the gradient driving water out of the animal.
For a moisture-dependent organism, that can quickly become a physiological crisis.
2. Microclimate Collapse
Millipedes normally exploit the humid boundary layer beneath leaves, moss, vegetation, and decaying organic material. That tiny environment can be dramatically different from the air temperature and humidity measured a few feet above the ground. But extreme evaporation changes that.
As soil and vegetation dry, the humid refuge beneath the vegetation becomes progressively less effective. The millipedes are then faced with a choice:
Stay and desiccate—or move.
So they move. They may retreat deeper into soil, beneath logs, or into other remaining pockets of moisture. But when those refuges become unsuitable, some millipedes emerge and begin searching for a new moist environment.
3. Their Food Supply Dries Out
Millipedes are primarily detritivores. They feed on decaying plant material, leaf litter, fungi, and other organic matter.
That food web also depends on moisture.
When leaf litter becomes severely dried out, the physical and biological processes that make organic material available to decomposers and detritivores can be disrupted.
The result is a double problem:
The habitat is drying out—and the food system is changing with it.
4. The March Begins
This is where the swimming pool becomes relevant. A millipede doesn’t understand what a swimming pool is. It responds to its immediate environment. When its normal habitat becomes dangerously dry, it searches for a more favorable moisture environment.
A swimming pool represents an enormous source of water compared with the surrounding dry landscape.
Unfortunately for the millipede, a pool is a moisture sink but not a safe habitat. Once it reaches the water, the outcome can be fatal.
Millipedes are not strong swimmers. They can become trapped at the water’s edge, fall into the pool, and drown.
What appears to be a bizarre invasion of millipedes may therefore be the final stage of a much larger environmental chain.
Climate Energy Has a Marching Order
The important point isn’t that climate change “created” millipedes or directly ordered them into the swimming pool.
It is that changes in atmospheric energy and moisture transport can reorganize the physical environment in which they live.
Dry period → intense rainfall → saturated soil → reduced pore-space oxygen → earthworm emergence → swimming pool
Same backyard.
Different extreme.
Opposite moisture conditions.
And both can produce the same strange result:
dead creatures at the bottom of the pool.
That is what makes hydroclimatic whiplash so interesting. Climate change isn’t always experienced as a dramatic hurricane, wildfire, or flood. Sometimes it arrives as something much smaller.
Sometimes it is measured in inches of water disappearing from your swimming pool.
And sometimes, if you pay attention, the millipedes get their marching orders.
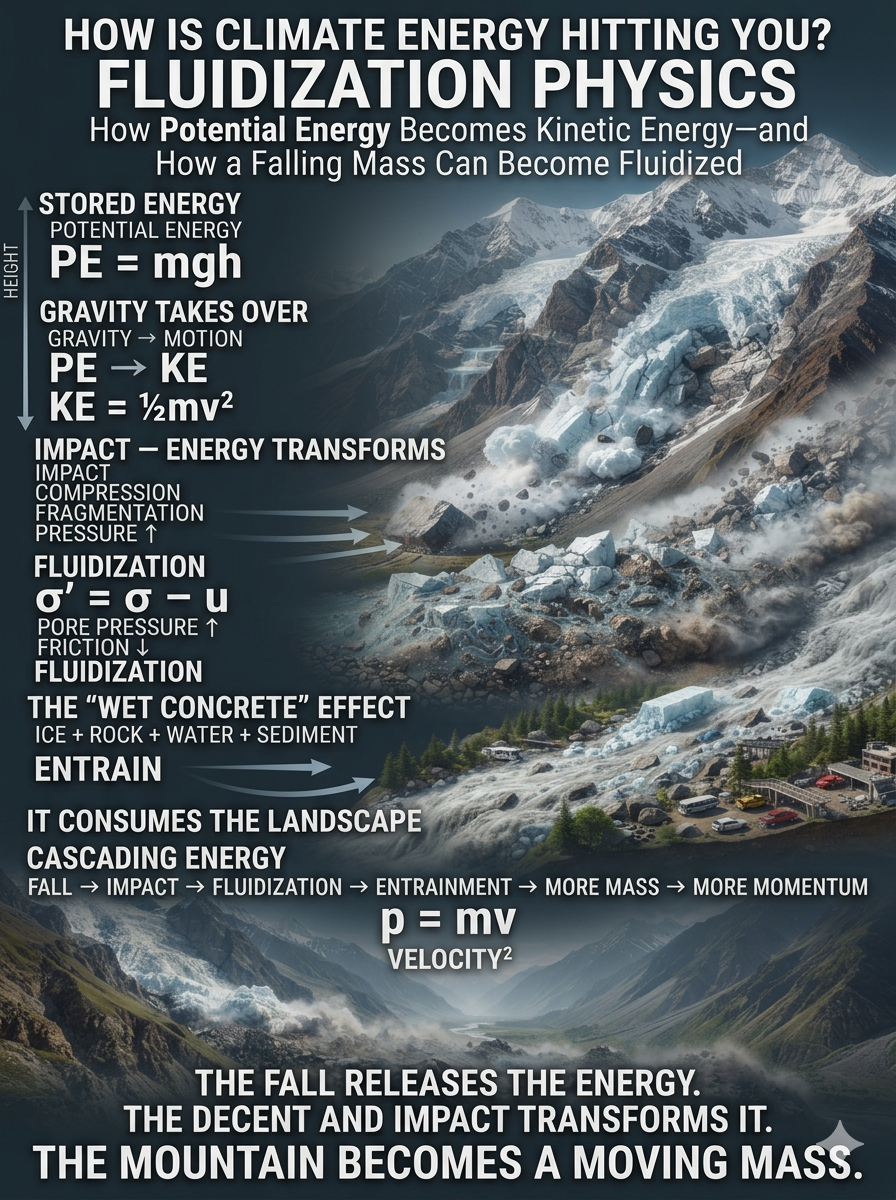
How Potential Energy Becomes Kinetic Energy—and How a Falling Mass Can Become Fluidized
Rocky Rex said, “The ice mass (or composite) came out of a hanging valley that contained a cirque, possibly starting to move as a rotational slump. So there’s a lot of potential energy right at the start of the process.”
That observation gets to the heart of the physics. The collapse itself is a gravitational event. Gravity supplies the immediate energy that drives the mass downward. The climate connection lies in how human-caused warming can alter the physical conditions under which that gravitational energy is released.
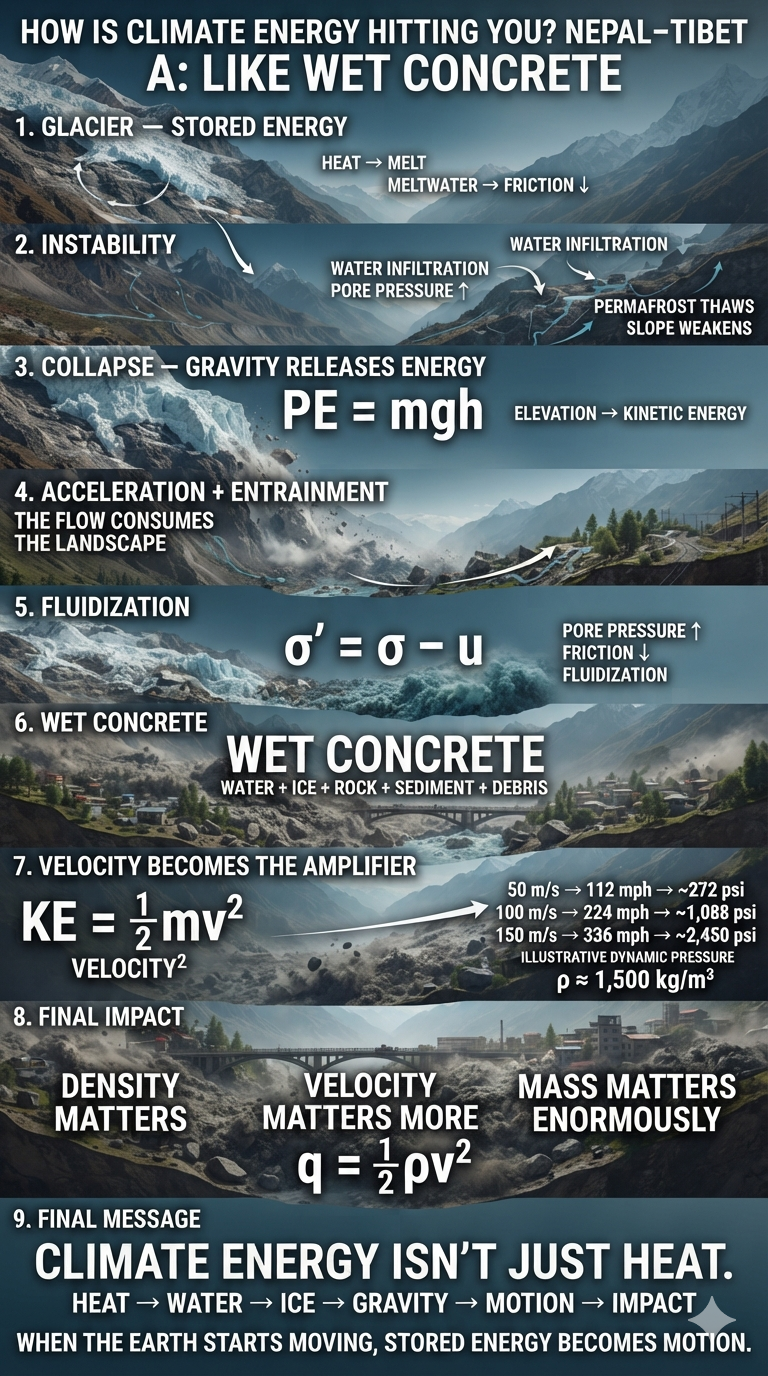
Heat can accelerate glacier melt. Meltwater can penetrate fractures and accumulate beneath ice. Rain and meltwater can increase pore-water pressure. Permafrost thaw can weaken previously frozen ground. Warming can therefore change the mechanical stability of ice, rock, soil, and sediment. Climate change does not need to physically push a mountain downhill. It can alter the conditions that determine when that mountain becomes capable of moving.
Then gravity does the rest.
Once the mass begins moving, another fascinating piece of physics takes over: water can actually make a moving granular system more mobile.
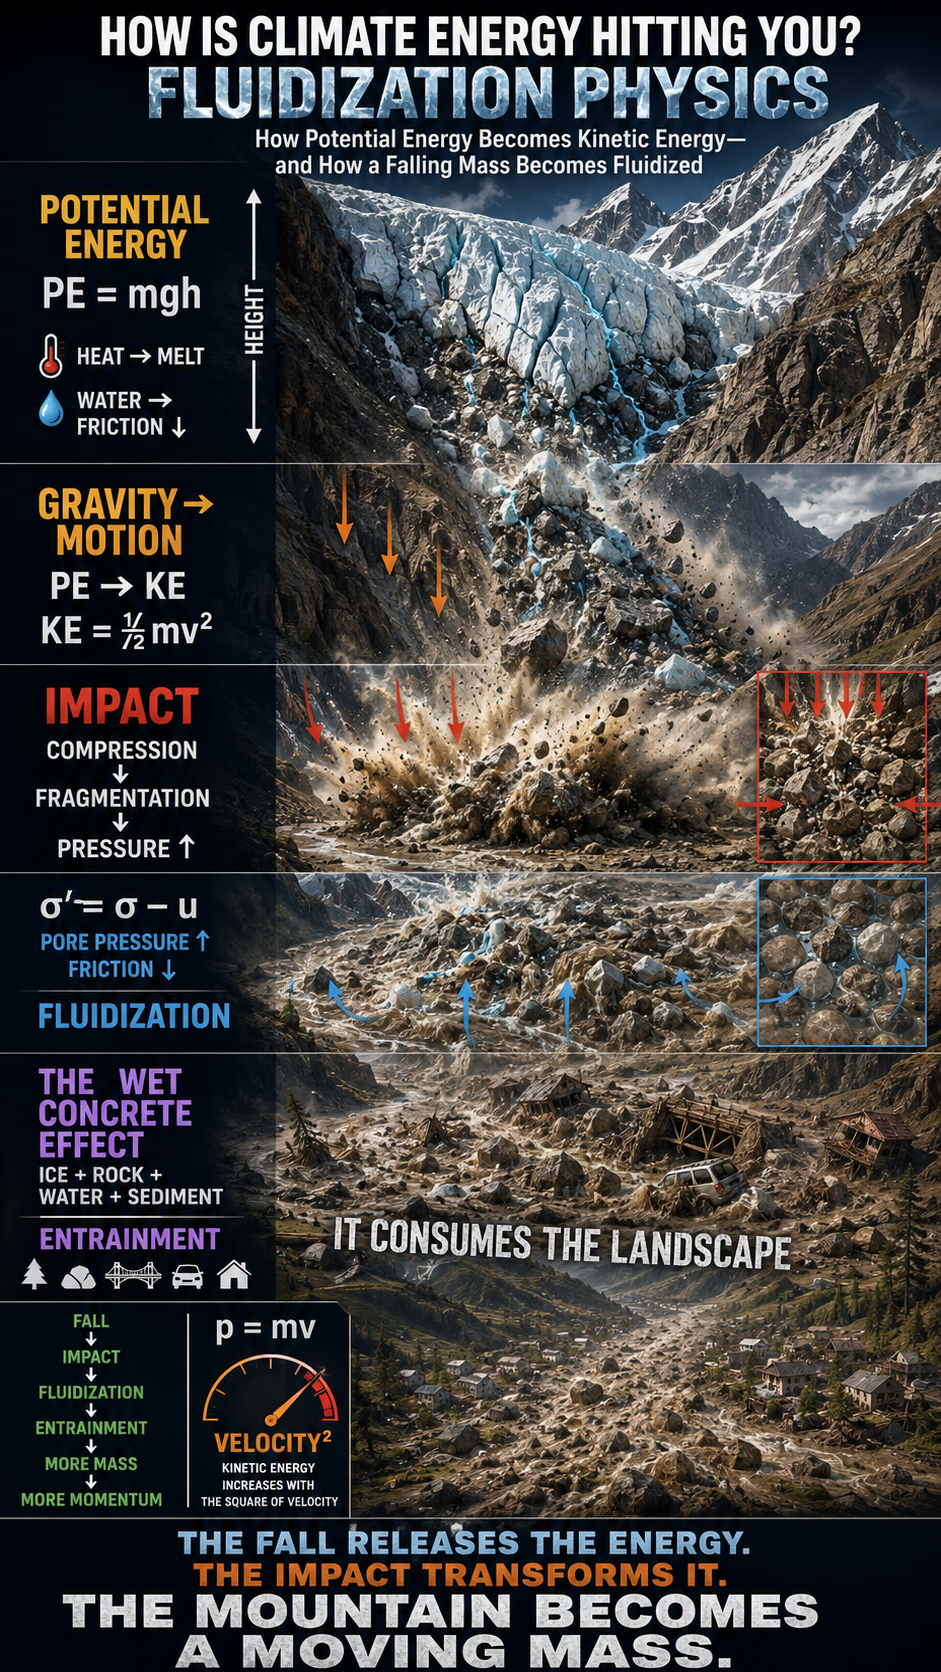
We generally think of water as something that slows things down. But water under pressure between particles can reduce the friction holding those particles together. In simplified form:
σ′ = σ − u
where σ′ is effective stress, σ is total stress, and u is pore-water pressure.
As pore-water pressure rises, effective stress falls. As effective stress falls, frictional resistance can decrease. That can make a slope or debris mass substantially more mobile.
This is one reason a wet, saturated mass can behave so differently from the dry rock, soil, and ice from which it originated. The material does not literally turn into water. Instead, water becomes part of a coupled solid-fluid system in which fluid pressure can support and mobilize solid particles.
Under sufficiently energetic and saturated conditions, a granular mass can become partially fluidized, allowing it to flow and transport enormous quantities of additional material.
That is the “wet concrete” effect.
The distinction is important. We are not talking about a solid block of ice simply sliding down a mountain. We are talking about a material system whose physical properties can change dramatically as it accelerates, fragments, mixes with water, and incorporates sediment and other debris.
And once that transformation begins, the physics becomes even more interesting.
The Fall Is Only the Beginning
The fluidization of the mass on the way down is remarkable physics. But the energy transfer at the bottom may be even more consequential.
The material did not strike the valley floor all at once.
The leading edge arrived first.
It collided with the valley floor and surrounding terrain, fractured, compressed, deformed, and began spreading. Behind it, enormous quantities of ice, rock, water, and sediment were still moving downhill.
That means the impact was not a single collision.
It was a cascading sequence of collisions.
The first material to arrive effectively became an impact surface for the material immediately behind it. The incoming mass continued transferring momentum into material that had already slowed, while the valley floor resisted the movement from below.
The basic relationship is:
p = mv
where p is momentum, m is mass, and v is velocity.
Changing the momentum of an enormous mass requires an enormous force. The rate at which that momentum is transferred matters as well:
F = Δp / Δt
The shorter the time over which momentum is transferred, the greater the instantaneous force.
This is why the impact of a massive debris flow is fundamentally different from simply placing the same amount of material on the ground. A stationary mountain weighs an enormous amount, but its weight is distributed through relatively stable structures. A mountain in motion has momentum. When that momentum is suddenly redirected, compressed, fragmented, or stopped, enormous forces are generated.
Four Hundred Million Tons in Motion
Early scientific estimates put the mass of the initial detachment at approximately 400 million metric tons, or about:
4 × 10¹¹ kg
That estimate was derived from the seismic forces generated by the collapse. The scale is difficult to visualize: roughly the equivalent mass of 1,000 Empire State Buildings moving as part of the collapse.
The estimated vertical elevation difference between the initial failure and the valley floor is approximately 1,200–1,300 meters.
That gives us a way to estimate the gravitational potential energy available to the system:
PE = mgh
Using 400 million metric tons and a 1,200-meter elevation loss:
PE ≈ 4.7 × 10¹⁵ joules
At 1,300 meters:
PE ≈ 5.1 × 10¹⁵ joules
That is approximately 4.7–5.1 petajoules of gravitational potential energy before accounting for the enormous energy losses and transformations that occur during a real collapse.
This does not mean that all of that energy became forward-moving kinetic energy. It could not. The collapse fractured ice and rock, deformed the terrain, generated heat and sound, produced seismic waves, increased pore pressure, and drove erosion and entrainment.
But it establishes the scale of the energy reservoir.
The Theoretical Velocity Scale
We can also ask what velocity that elevation difference represents in an idealized gravitational system.
If gravitational potential energy were converted entirely into kinetic energy:
mgh = ½mv²
which gives:
v = √(2gh)
For a 1,200-meter vertical drop, the theoretical free-fall-equivalent velocity is approximately:
153 m/s ≈ 343 mph
For 1,300 meters:
160 m/s ≈ 357 mph
Those numbers should not be interpreted as measured velocities of the actual debris flow. A landslide is not a frictionless free-fall object. Energy is continually consumed by fragmentation, friction, collisions, deformation, terrain geometry, fluid interaction, erosion, and entrainment.
The calculation instead tells us something more fundamental: the elevation difference represents an enormous gravitational energy source.
The actual flow velocity would depend on how efficiently that energy was converted into motion.
The Impact Becomes a Cascade
Now imagine the leading portion of that enormous mass reaching the valley floor.
It does not simply stop.
Some of its kinetic energy is converted into deformation of the ground. Some fractures rock. Some pulverizes ice. Some accelerates water. Some generates turbulence. Some increases pore-water pressure. Some becomes heat and sound. Some is transferred into the material immediately behind it.
The mass behind the leading edge continues arriving with momentum. The material in front is compressed and displaced. Water and sediment are forced through the granular matrix. Pore pressure rises. Effective stress can fall. Friction can decrease. The material can spread and flow rather than simply pile into a stationary heap.
This creates a remarkable transition.
The impact itself can help create the conditions that allow the material to continue moving.
When the Pile Doesn’t Behave Like a Pile
Ordinarily, we expect a large quantity of rock to pile up when it reaches the bottom of a slope. But a heavily saturated, highly fragmented granular mass can behave very differently.
As the incoming material compresses the material beneath it, water trapped between particles can become pressurized. That pressure can temporarily reduce the effective contact forces between particles.
Again:
σ′ = σ − u
Increase u, and effective stress σ′ decreases.
That can reduce frictional resistance and allow the mass to rearrange and move.
This is why “wet concrete” is such a useful visual description.
The material is still carrying enormous amounts of solid mass, but it can move with characteristics of a fluid.
The Flow Begins Consuming the Landscape
And this is where another critical process—entrainment—takes over.
The moving mass does not simply travel over the landscape.
It consumes the landscape.
As the flow moves downstream, it can erode riverbanks and valley walls, incorporate additional sediment and water, pick up boulders and trees, and destroy and incorporate infrastructure.
Every new piece of material adds mass.
More mass means more momentum at the same velocity:
p = mv
And when the added material is dense rock, it can also substantially change the bulk density and mechanical behavior of the flow.
The flow therefore becomes a changing system.
It starts with one composition at the glacier.
It has another composition halfway down the mountain.
And by the time it reaches the valley, it may contain ice, rock, water, mud, sand, gravel, trees, soil, concrete, vehicles, buildings, and fragments of the valley itself.
The original collapse has become something much larger than the original failure.
Density and Velocity Become the Amplifiers
For a moving flow, one useful way of describing the dynamic pressure scale is:
q = ½ρv²
Here, ρ is the bulk density of the moving mixture and v is its velocity.
Water has a density of approximately:
1,000 kg/m³
A heavily sediment-laden debris mixture might have a bulk density around:
1,500 kg/m³
as an illustrative midpoint.
At the same velocity, the denser mixture therefore has approximately 1.5 times the dynamic-pressure scale of water.
But velocity is even more important because it is squared.
Double the velocity and the dynamic-pressure scale increases by a factor of four.
That is why the combination of mass, density, and velocity is so important.
Water can push.
A dense debris flow can push while simultaneously carrying boulders, trees, ice, vehicles, and structural debris.
The difference is not merely that the water is “stronger.”
The moving material contains vastly more solid mass capable of transferring momentum through direct collision.
A boulder becomes a projectile.
A tree becomes a battering ram.
A vehicle becomes additional moving mass.
A bridge becomes debris that can strike whatever lies downstream.
The flow becomes both the delivery system and the source of additional projectiles.
The Cascading Impact
This is the part of the physics that fascinates me most.
The initial fall converts gravitational potential energy into motion.
The impact converts that motion into crushing, fragmentation, deformation, pressure, turbulence, and heat.
The pressure changes the frictional behavior of the material.
The reduced friction allows continued movement.
The continued movement entrains more material.
The additional material increases the mass of the flow.
The increased mass increases its momentum.
And then that larger moving mass impacts the landscape again.
The cascade becomes:
GRAVITY
↓
ACCELERATION
↓
IMPACT
↓
FRAGMENTATION + COMPRESSION
↓
PORE PRESSURE ↑
↓
EFFECTIVE STRESS ↓
↓
FRICTION ↓
↓
FLUIDIZATION
↓
ENTRAINMENT
↓
MASS ↑
↓
MOMENTUM ↑
↓
MORE IMPACT
This is not perpetual-motion physics. Energy is continually being dissipated. The point is that the energy released by the initial gravitational collapse is being redistributed through many interacting physical processes rather than disappearing at the first impact.
The valley floor becomes part of the energy-transfer system.
The Seismic Energy Is Only One Piece of the Story
The reported seismic signal provides another fascinating comparison.
A magnitude-5.2 seismic event was recorded from the collapse, and early estimates associated the seismic energy with roughly 1,000 tons of TNT equivalent. That corresponds to approximately:
4.2 × 10¹² joules
Compared with the estimated 4.7–5.1 × 10¹⁵ joules of gravitational potential energy associated with a 1,200–1,300 meter elevation loss, the seismic energy represents only a small fraction of the available gravitational energy.
That distinction is essential.
The magnitude-5.2 tremor does not mean that only 1,000 tons of TNT worth of energy existed in the collapse. It describes the portion of energy coupled into seismic waves.
The rest went into the physical destruction and transformation of the system: motion, fragmentation, deformation, erosion, fluidization, turbulence, heat, sound, and downstream transport.
In other words, the earthquake was a signal of the collapse—not a complete measurement of the collapse’s mechanical energy.
From Glacier to Wet Concrete
This is why the event is so interesting from a climate-physics perspective.
The climate connection begins before the mountain moves. Warming can alter glacier mass, meltwater production, permafrost stability, precipitation, soil moisture, and the mechanical conditions within and beneath ice and rock.
But once the failure begins, gravity becomes the immediate energy source.
The falling mass accelerates.
Ice and rock fracture.
Water becomes incorporated.
The impact generates enormous stresses.
Pore pressure rises.
Friction can fall.
The granular material becomes increasingly mobile.
Then the flow begins consuming the landscape.
More sediment.
More water.
More rock.
More trees.
More structures.
More mass.
More momentum.
And the result is no longer simply an ice collapse or a rockslide.
It is a coupled ice-rock-water-sediment system undergoing a rapid mechanical transformation.
A mountain begins as a collection of relatively stable materials.
Gravity sets it in motion.
Energy transforms its structure.
Water changes its friction.
Impact changes its state.
And entrainment turns the landscape itself into additional moving mass.
That is the physics behind the phrase:
Like wet concrete.
It isn’t just a metaphor for something thick and muddy.
It describes a system in which enormous quantities of water and solid material can become mechanically coupled into a dense, mobile mass—one capable of transferring momentum, carrying additional material, and continuing the cascade long after the initial glacier failure has occurred.
The initial fall releases the energy.
The impact transforms it.
Fluidization redistributes it.
Entrainment multiplies the moving mass.
And the resulting flow carries the consequences downstream.
The Climate Physics Behind the Nepal-Tibet Collapse
“Warming of Nepal’s glaciers has been a continuous process over this timescale and is not something that has only occurred recently due to human activity.”
This statement is misleading and, as a description of the modern climate system, demonstrably wrong.
Yes, Himalayan glaciers have always experienced natural fluctuations. Glaciers advance and retreat. Temperatures and precipitation have varied throughout Earth’s history. But that fact does not explain away the rapid warming and cryospheric changes occurring today, nor does it establish that recent warming is natural.
The relevant question is not whether Nepal’s glaciers have ever warmed before. The question is whether the recent warming that is altering the glaciers, permafrost, precipitation, and meltwater system is being driven by human greenhouse-gas emissions. The evidence for the human contribution to modern global warming is overwhelming.
A primary climate-related mechanism relevant to an event like this is the intensification of the water cycle. For every 1°C of warming, the atmosphere can hold approximately 7% more water vapor, increasing the potential for heavier precipitation when that moisture is released. This is a consequence of the Clausius-Clapeyron relationship, not a theory about this particular glacier.
That matters because water is not simply something that falls from the sky and runs downhill. In a glacierized mountain system, water can infiltrate snow and ice, penetrate fractures, reach the glacier bed, enter surrounding sediment and rock, and increase water pressure. Under the right conditions, that can reduce friction and increase the mobility of ice and unstable material.
The area around the collapse has also experienced rainfall and substantial meltwater and basal-water flow. Those observations are important because they provide a plausible physical pathway connecting atmospheric warming and precipitation changes to the mechanical stability of the glacier and surrounding terrain. However, demonstrating that this particular collapse was caused by human climate change requires event-specific observations and attribution analysis; the physics establishes the mechanism, not by itself the precise contribution of each factor.
Warming also contributes to glacier mass loss and can thaw permafrost and permanently or seasonally frozen ground that helps stabilize steep mountain terrain. These processes can weaken the physical structure of the landscape while increasing the amount of liquid water moving through it.
So the connection to human activity isn’t simply, “It got warmer, therefore the glacier collapsed.” The physics is much more interesting—and much more complicated.
Human greenhouse-gas emissions have increased atmospheric and surface temperatures. That warming affects the cryosphere and hydrological cycle. More heat can increase ice melt. A warmer atmosphere can carry more moisture. Precipitation can deliver additional water to an already destabilized system. Meltwater can infiltrate ice and rock, increase water pressure, and alter friction. Thawing frozen ground can reduce slope stability.
Those changes can help load the system toward failure.
The collapse itself is a gravitational event. Gravity supplies the immediate energy that drives the mass downward. The climate connection lies in how human-caused warming can alter the physical conditions under which that gravitational energy is released.
And once the mass begins moving, another fascinating piece of physics takes over: water can actually make a moving granular system more mobile.
We generally think of water as something that slows things down. But water under pressure between particles can reduce the friction holding those particles together.
In simplified form:
σ′ = σ − u
where σ′ is effective stress, σ is total stress, and u is pore-water pressure.
As pore-water pressure rises, effective stress falls. As effective stress falls, frictional resistance can decrease. That can make a slope or debris mass substantially more mobile.
This is one reason a wet, saturated mass can behave so differently from the dry rock, soil, and ice from which it originated. The material does not literally turn into water. Instead, water becomes part of a coupled solid-fluid system in which fluid pressure can support and mobilize solid particles.
Under sufficiently energetic and saturated conditions, a granular mass can become partially fluidized, allowing it to flow and transport enormous quantities of additional material.
That is the “wet concrete” effect.
And it provides an important way to understand the collapse: climate change does not need to physically push the mountain downhill. It can alter the water, ice, temperature, and ground conditions that help determine when a mountain becomes capable of moving.
Heat melts ice. Meltwater changes friction. Water infiltrates soil. Pore pressure rises. Permafrost thaws. Slopes weaken. Glaciers destabilize. Gravity converts elevation into kinetic energy. Moving water entrains sediment. Sediment increases density. Increasing density increases the potential force of the flow. Velocity increases kinetic energy according to v². And then the landscape itself becomes part of the moving mass.
The Physics of the Langtang Lirung Glacier Collapse
The sequence is more accurately understood as a progression from glacier failure to gravitational acceleration, fragmentation, collision and deformation, water and sediment entrainment, increasing pore-water pressure, reduced effective friction, partial fluidization, and ultimately high-mobility debris-flow propagation.
There was a video of what appeared to be a large boulder rolling along the top of the entrained material, sometimes seeming to bob up and down as the flow moved beneath it. At first, I thought I was simply watching rock being carried by a flood. But the more I watched, the more complicated the physics appeared to be.
The bulk of the larger rock and ice appears to have come through first, driven by the initial collapse, gravity, and the rapidly moving water and debris. In doing so, it essentially carved and scoured a channel through the valley. Then came something very different: an enormous mass of mud, sediment, ice, rock, vegetation, and structural debris—apparently reaching several stories in depth—that overwhelmed and buried villages.
As for whether what we are seeing is rock or ice, it was probably a combination of both. One report described the material as being like “wet concrete,” which is actually a remarkably useful way to visualize what was happening. It captures something that ordinary words like “flood” or “mudslide” don’t fully convey. This wasn’t simply water carrying a little mud. It was a dense, multiphase mixture of water, sediment, rock, ice, vegetation, and everything else it encountered, moving together as a highly energetic mass.
The Bridge Experiment Nobody Intended to Conduct
I also saw video of a bridge collapse that really demonstrated the power of the flow. What amazed me was what initially looked almost like “buoyancy.” The entrainment was so dense and forceful that the bridge appeared to be lifted onto the surface of the moving material, carried downstream, and then used almost like another projectile when it encountered a second bridge. The second bridge appeared to do something similar.
Both structures were ultimately carried downstream, taking out virtually anything and everything in their path. Of course, this isn’t true buoyancy in the simple sense of a bridge floating in water. The physics is more complicated. A dense debris flow can exert enormous upward, lateral, and drag forces on an object. A structure can become partially supported, displaced, rotated, or entrained by the moving mass beneath and around it. Once a structure becomes part of the flow, it is no longer simply an obstacle. It becomes debris—and that debris becomes part of the destructive machinery of the flow.
That is the remarkable thing about these events. Water, sediment, rock, ice, trees, buildings, bridges, and pieces of the riverbank can become mechanically coupled into one enormous moving system. The density increases. The mass increases. The momentum increases. And the destruction compounds.
The Physics Begins With Gravity
The most important number in understanding this event may not be the one-kilometer distance over which the material traveled. It may be the approximately 1,200–1,300 meters of elevation that the collapsing mass lost between the glacier and the valley floor.
The lower section of the unnamed glacier was reportedly located at approximately 5,200 meters—about 17,000 feet—on the northern slopes of the Mount Langtang Lirung massif. The Lhende Khola valley floor lies roughly 3,900–4,000 meters above sea level. That means the system had approximately 1,200–1,300 meters of vertical gravitational head.
That is an enormous amount of stored gravitational energy.
The gravitational potential energy of a mass is:
PE = mgh
where m is mass, g is gravitational acceleration, and h is the vertical elevation difference.
For every kilogram of material, a 1,200–1,300 meter elevation loss represents approximately 11,800–12,800 joules of gravitational potential energy. If all of that energy could somehow be converted perfectly into kinetic energy, the corresponding free-fall-equivalent velocity would be:
v = √(2gh)
For a 1,200-meter drop, that produces approximately 153 m/s, or 343 mph. For a 1,300-meter drop, it produces approximately 160 m/s, or 357 mph.
Those numbers are startling, but they need to be understood correctly. They do not mean that the debris actually struck the valley floor at 343–357 mph. They represent an idealized upper-bound velocity scale—the speed a mass would acquire if gravitational potential energy were converted perfectly into kinetic energy without energy losses.
A real glacier collapse is nothing like free fall. Energy is consumed by fracturing ice and rock, deformation, friction, collisions, turbulence, air resistance, terrain geometry, erosion, entrainment, and the conversion of organized gravitational motion into chaotic motion within the debris mass. The actual velocity would therefore have been substantially lower and would have varied throughout the event.
But the calculation is still important because it tells us how much energy gravity made available to the system.
When Ice, Rock, Water, and Debris Become One Moving System
The original material at the top was probably heterogeneous. There could have been ice, snow, rock, sediment, water, and other material mixed together. As the mass accelerated, it was subjected to enormous stresses. Ice fractured. Rock fractured. Sediment was stripped from the landscape. Water was incorporated into the moving material. Trees and vegetation were uprooted. Structures and riverbank material were entrained.
Every collision changed the composition of the flow.
This is where the term “entrainment” becomes extremely important. The moving mass doesn’t simply travel over the landscape. It consumes the landscape. It picks up additional sediment, rock, water, vegetation, soil, and structures along the way. That increases the mass of the flow while simultaneously changing its physical properties.
Once the material becomes heavily saturated, another process becomes critically important: pore-water pressure.
Water Can Reduce Friction
This is one of the strangest aspects of the physics. We generally think of water as something that slows things down. But water under pressure between particles can reduce the friction holding those particles together.
In simplified form:
σ′ = σ − u
where σ′ is effective stress, σ is total stress, and u is pore-water pressure.
As pore-water pressure rises, effective stress falls. As effective stress falls, frictional resistance can decrease. That can make a slope or debris mass dramatically more mobile.
This is one reason why a wet, saturated mass can behave very differently from the dry rock, soil, and ice from which it originated. The material doesn’t literally turn into water. Instead, the water becomes part of a coupled solid-fluid system in which fluid pressure helps support and mobilize the solid particles. Under sufficiently energetic conditions, a granular mass can become partially liquefied or fluidized.
That is the “wet concrete” effect.
Another Lubrication Effect: Meltwater Beneath the Ice
There is also the possibility of basal lubrication beneath moving ice. Meltwater accumulating beneath a glacier can reduce basal friction and permit basal sliding, sometimes dramatically increasing the mobility of the ice.
That makes footage showing substantial water emerging from beneath the glacier particularly interesting. If meltwater was present beneath the ice, it could have contributed to the initial mechanical instability. If water was also available downstream, it could subsequently become incorporated into the collapsing ice-rock mass.
This creates the possibility of a coupled sequence: meltwater can reduce basal friction and increase glacier movement; movement can contribute to collapse; collapse releases gravitational potential energy; acceleration causes fragmentation and entrainment; and increasing water content and pore pressure can subsequently reduce internal friction and promote fluidization.
This is not one process. It is several physical processes interacting with one another.
The Ground Itself Can Become Part of the Flow
There is another important factor. Thawing permafrost and destabilized soil and peat can weaken the material that normally helps hold mountain slopes together. Add unusually warm conditions and significant precipitation preceding the event, and you potentially have several destabilizing mechanisms operating simultaneously: meltwater infiltration, increasing water pressure, reduced basal friction, thawing ground, weakened sediment and rock, and gravity acting on a huge mass of ice and rock.
That is why I am hesitant to characterize an event like this simply as an “ice collapse” or a “rockslide.” It appears more useful to think of it as a coupled ice-rock-water system in which one failure mechanism can trigger another.
What Happened to the Ice?
The ice-water mixture near the top of the fall may have been predominantly ice. But after a 1,200–1,300 meter descent, followed by rapid fragmentation, collision, deformation, mixing, and entrainment, the material at the bottom would have been physically very different from the material at the top.
That doesn’t mean all of the ice necessarily melted during the descent. There is not enough information to make that claim. But the ice could have been extensively fractured and broken apart, while meltwater and pre-existing water became mixed with rock, sediment, and debris.
The composition of the moving mass could therefore have changed rapidly as it descended. By the time it reached the valley floor, the system could contain a complex mixture of water, ice, fine sediment, sand, gravel, large rocks, trees, soil, and structural debris.
The result can look almost like a giant mass of wet concrete.
And that visual description isn’t merely poetic. It reflects the fact that the material can have a density much greater than water while simultaneously behaving as a highly mobile fluid-solid mixture.
An Estimate of the Force of the Flow: The Damage and the Impact
The simplest starting point for thinking about the destructive pressure of a moving mass is dynamic pressure:
q = ½ρv²
The density of the individual components varies enormously. Water has a density of approximately 1,000 kg/m³; ice about 917 kg/m³; wood roughly 400–700 kg/m³; wet sediment roughly 1,500–2,000 kg/m³; concrete and masonry roughly 2,200–2,400 kg/m³; and rock approximately 2,500–3,000 kg/m³.
But the flow is not one of these materials. It is a mixture.
For a water-rich ice/water/debris flow containing substantial sediment and rock, a reasonable illustrative bulk-density range might be approximately 1,200–2,000 kg/m³. For calculations, approximately 1,500 kg/m³ is a useful illustrative midpoint.
That is about 50 percent denser than water.
And density matters because:
q ∝ ρv²
Velocity is squared. That is the critical point.
If velocity doubles, dynamic pressure increases by approximately four times. The same principle applies to kinetic energy:
KE = ½mv²
If velocity doubles, kinetic energy also increases by a factor of four.
This is why velocity is such a powerful amplifier of destructive energy.
Using the illustrative bulk density of 1,500 kg/m³, a flow moving at 50 m/s—about 112 mph—would have a dynamic pressure of approximately 1.9 MPa, or roughly 272 psi. At 100 m/s, about 224 mph, the calculated dynamic pressure rises to approximately 7.5 MPa, or roughly 1,088 psi. At 150 m/s, about 336 mph, it reaches approximately 16.9 MPa, or roughly 2,450 psi.
At the same velocity, a 1,500 kg/m³ debris mixture has 1.5 times the dynamic pressure, momentum density, and kinetic energy density of water. But its destructive potential can be substantially greater because the flow also carries solid mass—boulders, trees, ice, vehicles, structures and sediment—that can strike, crush and penetrate objects rather than simply flow around them.
The underlying relationship: density matters, velocity matters even more, and mass matters enormously.
The Energy Doesn’t Disappear When the Flow Hits
When the moving mass reaches the valley floor, the kinetic energy has to go somewhere. It cannot simply vanish. It is transformed into crushing, fracturing, deformation, heating, melting, turbulence, particle collisions, pore-water pressure, erosion, lateral spreading, and the acceleration of additional material.
And that is where the destruction can become self-reinforcing.
A moving rock strikes the ground and fractures. The fragments become part of the flow. The flow picks up more sediment. Water pressure rises. The material becomes more mobile. More material is entrained. More mass is now moving.
Structures are struck. Structures break apart. Their components become additional debris. The flow becomes both the delivery mechanism and the source of new projectiles.
This is why the damage can propagate far beyond the location of the original glacier failure.
The Three-Story-Deep Problem
When you see villages buried beneath what appears to be an enormous layer of mud, it can look almost as though the ground itself has turned into solidifying concrete or quicksand.
That visual impression makes sense. A deep, water-saturated debris flow can behave nothing like ordinary soil. It can be dense enough to support and transport very large objects while simultaneously being fluid enough to flow around buildings, trees, vehicles, bridges, and terrain.
The surface can look deceptively solid. But underneath, the material may still be moving.
That creates an extraordinarily dangerous environment for rescuers. The footage of rescue teams moving carefully across the surface—sometimes crawling on their bellies—is a powerful illustration of this physical reality. The surface is not necessarily solid ground. It may be the upper surface of a dense, unstable, water-saturated debris mass.
A person standing on it is not necessarily standing on stable earth.
They may be standing on the moving aftermath of a mountain.
Climate Energy Is Not Just Heat
This is where the event gives me a completely different perspective on climate change physics.
When we talk about climate change, we often talk about temperature. But temperature is only one part of the energy story.
Climate energy can move through the Earth system as water, ice, air, sediment, and rock.
Heat melts ice. Meltwater changes friction. Water infiltrates soil. Pore pressure rises. Permafrost thaws. Slopes weaken. Glaciers destabilize. Gravity converts elevation into kinetic energy. Moving water entrains sediment. Sediment increases density. Increasing density increases the potential force of the flow. Velocity increases kinetic energy according to v². And then the landscape itself becomes part of the moving mass.
That is the larger lesson.
The climate system doesn’t have to “create” the energy of a landslide. Gravity already provides the energy. Climate change can alter the conditions that determine when, where, and how that gravitational energy is released.
A warmer atmosphere can increase the amount of water available to the system. Melt can add water. Rain can add water. Thawing ground can remove structural stability. Water pressure can reduce friction. And once a mountain begins moving, gravity takes over.
That is what I mean by:
How Is Climate Energy Hitting You?
Sometimes it arrives as heat.
Sometimes as water.
Sometimes as ice.
Sometimes as a flood.
And sometimes, after passing through enough interconnected physical processes, it arrives as something that looks like wet concrete moving down a mountain.
That is climate energy in motion.
Public Access Version
How Is Climate Energy Hitting You Nepal-Tibet? A: Like Wet Concrete
My homework assignment for tonight was born from curiosity about the Nepal-Tibet glacial collapse.
What was in the mixture? How did it change as it moved? Did the enormous amount of energy involved cause it to fluidize?
The answer appears to be yes.
What began as a mixture of ice, rock, water, and sediment transformed into an extremely dense, rapidly moving mass—something remarkably like wet concrete.
This is where “entrainment” becomes critical.
The moving mass doesn’t simply travel over the landscape.
It consumes the landscape.
It picks up sediment, rock, water, vegetation, soil, trees, and structures along the way. That increases the mass of the flow while simultaneously changing its physical properties.
Water increases pore pressure. Pore pressure reduces friction. Reduced friction increases mobility. Increased mobility produces more entrainment.
It becomes a feedback loop: more water, more mobility, more mass, more destructive energy.
And that is what grabbed my attention.
Climate energy isn’t just heat.
Heat melts ice. Water changes friction. Gravity converts elevation into kinetic energy. And once the Earth starts moving, the landscape itself can become part of the moving mass.