bookmark_borderLooming Deadlines for Coastal Resilience: Rising Seas, Disruptive Tides, and Risks

Looming Deadlines for Coastal Resilience: Rising Seas, Disruptive Tides, and Risks to Coastal Infrastructure

The report “Looming Deadlines for Coastal Resilience: Rising Seas, Disruptive Tides, and Risks to Coastal Infrastructure” highlights the critical challenges and timelines faced by coastal communities in addressing the impacts of climate change. Key points include:

  1. Rising Sea Levels: Coastal regions are increasingly vulnerable to higher sea levels, which expand floodplains and deepen floodwaters. This intensifies the frequency and severity of coastal flood events.
  2. Infrastructure at Risk: By 2080, major increases in the number of residents and buildings exposed to extreme coastal flooding are projected. For instance, the number of homes exposed to major flooding is expected to rise from 360,000 to 943,000, and annual flood damages could surge from $0.4 billion to $5.1 billion.
  3. Critical Infrastructure: The number of miles of roadways prone to chronic coastal flooding could grow from 500 to nearly 2,800 miles, drastically affecting transportation and emergency response capabilities.
  4. Environmental Impact: Significant loss of tidal wetlands and dunes is anticipated, with nearly 89% of existing tidal wetlands and 38% of dunes expected to be permanently inundated by 2080.
  5. Resilience Strategies: The report emphasizes the need for comprehensive and adaptive strategies to manage and mitigate these risks, including improved coastal planning, investment in resilient infrastructure, and community engagement.
  6. Financial and Policy Support: To support resilience efforts, mechanisms like the Community Flood Preparedness Fund (CFPF) have been established to provide funding and resources for projects aimed at enhancing coastal resilience, particularly prioritizing low-income communities.

The report underscores the urgent need for action and substantial investment to protect coastal regions from the accelerating impacts of climate change.

For more detailed information, you can access the full report here​ (VA Dept of Conservation)​.


Resources

Flood Insurance Brouse and Mukherjee (1995-present)

Insurance Cost and Availability Brouse (2024)

Create a Climate-Resilient Environment in and Around Your Home Brouse (2024)

Managed Retreat: Relocating Due to Climate Change Extreme Weather Events Brouse (2023)

Stormwater Runoff Management for Your House Brouse (2024)

Atmospheric Rivers Mukherjee and Brouse (2022-2023)

Violent Rain and the Substrate Brouse and Laden (2024)

Real Estate Underwater: A Florida Climate Change Case Study Daniel Brouse (2023)

Climate Change Impacts on Flood Risks and Real Estate Values Sidd Mukherjee and Daniel Brouse (2023)
Real Estate and Climate Change: Stranded on an Island Daniel Brouse (2023)

Climate Change: What Can I Do?

Human Induced Climate Change

bookmark_borderClimate Change and Homeowners’ Insurance

by Daniel Brouse

A significant factor contributing to both increased costs and decreased availability of homeowners insurance is climate change. The surge in insurance costs is primarily driven by the unprecedented number of climate-related disasters. States like California, Louisiana, and Florida now heavily rely on government aid to manage the financial burdens associated with residential property insurance.

In 2023, the United States faced 28 separate weather and climate disasters, each costing at least 1 billion dollars, marking it as the year with the highest number of billion-dollar disasters on record. Single extreme weather events are also becoming more costly. Hurricane Ida alone caused an estimated $75 billion in damages, making it the costliest disaster of 2021. Insurers paid out a staggering $99 billion in claims related to natural disasters in 2022, leading to a substantial 21 percent increase in premiums from May 2022 to May 2023.

The rising premiums aren’t just a matter of cost; it’s also becoming increasingly difficult to find coverage, especially in disaster-prone areas. Major insurers are reconsidering where they underwrite policies, with some, like State Farm General Insurance Company, halting the acceptance of new applications for property insurance due to rapidly growing catastrophe exposure.

Government officials have acknowledged the link between the availability of homeowners insurance and climate change. Ohio Senator Sherrod Brown and US Treasury Secretary Janet Yellen have both highlighted the decline in insurance affordability and availability due to more frequent and severe natural disasters.

Even regions traditionally less prone to disasters are experiencing insurance challenges. The reinsurance market, influenced by events worldwide, impacts rates offered by insurers, subsequently increasing costs for homeowners.

In states like Louisiana, hurricanes such as Laura and Ida have severely impacted the insurance market, reminiscent of the aftermath of Hurricane Katrina. Flood insurance, overseen by FEMA, is facing significant challenges, with premiums expected to double for many policyholders under FEMA’s new rating system.

FEMA is actively seeking recommendations to modify flood risk assessment procedures to better reflect the evolving climate challenges. Their efforts aim to equip communities with better tools to handle the increasing risks associated with climate change.

Insurance Cost and Availability

Climate change is profoundly impacting homeowners’ and flood insurance costs and availability in several ways:

  1. Increased Frequency and Severity of Natural Disasters: Climate change is leading to more frequent and severe weather events such as hurricanes, floods, wildfires, and storms. These events result in higher insurance payouts due to increased property damage, leading insurance companies to raise premiums to cover their costs.
  2. Rising Sea Levels: As sea levels rise due to climate change, coastal areas become more prone to flooding and storm surges. This increased risk of flood damage prompts insurance companies to adjust their pricing models, often resulting in higher premiums for properties in flood-prone zones.
  3. Changing Risk Assessment: Insurers are reassessing risk models to account for the changing climate conditions. Areas once considered low-risk may now be reclassified as high-risk due to increased vulnerability to weather-related events. As a result, homeowners in these areas may face higher insurance premiums or even difficulty obtaining coverage.
  4. Reduced Availability of Coverage: In regions heavily impacted by climate change-induced disasters, insurance companies may reduce or withdraw coverage altogether. This can leave homeowners in high-risk areas struggling to find affordable insurance options, particularly for flood insurance.
  5. Government Intervention: Government-backed flood insurance programs, such as the National Flood Insurance Program (NFIP) in the United States, face financial strain due to increased claims resulting from climate-related disasters. This may lead to reforms in insurance programs, such as adjustments to premium rates or eligibility criteria, impacting homeowners’ access to affordable coverage.

Overall, climate change is exacerbating the risks and costs associated with homeowners’ and flood insurance, posing significant challenges for individuals and communities vulnerable to its effects.

How is All Real Estate at Risk From Climate Change?

Flood Insurance

bookmark_borderClimate Change, Inflation, and You

Currently, a major contributor to inflation is the surge in homeowners’ insurance costs, propelled by the unprecedented number of climate disasters in 2023. California, Louisiana, and Florida are now dependent on government assistance to manage the financial burden of residential property insurance.

Flood insurance will become expensive and difficult to obtain.

NOAA: A historic year of U.S. billion-dollar weather and climate disasters

In 2023, the U.S. experienced 28 separate weather and climate disasters costing at least 1 billion dollars. That number puts 2023 into first place for the highest number of billion-dollar disasters in a calendar year and included:

  • 1 winter storm/cold wave event (across the northeast U.S. in early-February).
  • 1 wildfire event (firestorm destroying town of Lahaina on Maui Island of Hawaii).
  • 1 drought and heat wave event (focused across the central and southern U.S.).
  • 4 flooding events (in California, Florida, and across the eastern and northeastern U.S.).
  • 2 tornado outbreaks (across the central and eastern U.S.).
  • 2 tropical cyclones (Idalia in Florida and Typhoon Mawar in Guam).
  • 17 severe weather/hail events (across many parts of the country).

2023 was also deadly, causing at least 492 direct or indirect fatalities — the 8th most disaster-related fatalities for the contiguous U.S. since 1980.

* Our climate model employs chaos theory to comprehensively consider human impacts and projects a potential global average temperature increase of 9 degrees Celsius above pre-industrial levels.

What Can I Do?
There are numerous actions you can take to contribute to saving the planet. Each person bears the responsibility to minimize pollution, discontinue the use of fossil fuels, reduce consumption, and foster a culture of love and care. Be a butterfly and affect the world. The Butterfly Effect illustrates that a small change in one area can lead to significant alterations in conditions anywhere on the globe. Hence, the frequently heard statement that a butterfly in China can cause a hurricane in the Atlantic.

Here is a list of additional actions you can take.

How is All Real Estate at Risk From Climate Change?

bookmark_borderHow is All Real Estate at Risk From Climate Change?

By Daniel Brouse and Sidd Mukherjee

Climate change poses risks to real estate in the United States in various ways, and these risks can affect property values, insurance costs, and overall property resilience. Here are some ways in which all US real estate is at risk from climate change:

  1. Sea Level Rise and Coastal Properties:
    • Coastal properties are particularly vulnerable to sea level rise, storm surges, and coastal erosion. As sea levels continue to rise due to global warming, properties near coastlines may experience increased flooding and damage from more frequent and severe storms. Storm surges in Florida are an example.
  2. Extreme Weather Events:
    • Climate change is contributing to an increase in the frequency and intensity of extreme weather events, such as hurricanes, wildfires, floods, and droughts. Properties in regions prone to these events are at risk of damage, destruction, and increased insurance costs.
  3. Temperature Extremes:
    • Rising temperatures can lead to more frequent and prolonged heatwaves, affecting property infrastructure, energy demand, and potentially decreasing property values in areas with extreme heat.
  4. Changes in Precipitation Patterns:
    • Changes in precipitation patterns, including increased violent rainfall or prolonged droughts, can impact properties by causing flooding, landslides, or water scarcity. These changes may affect property values and increase maintenance costs.
  5. Wildfires:
    • Increased temperatures and changing precipitation patterns contribute to the risk of wildfires. Properties in wildfire-prone areas face threats to both their physical structures and the surrounding environment.
  6. Homeowners and Flood Insurance Costs:
    • Flood insurance will become expensive and difficult to obtain. Climate-related risks can lead to higher insurance premiums and deductibles, particularly in high-risk areas. As the frequency and severity of climate-related events increase, insurance companies may reassess risk models and adjust pricing accordingly.
  7. Infrastructure Vulnerability:
    • Climate change can impact infrastructure such as roads, bridges, and utilities. Properties relying on vulnerable infrastructure may face challenges related to accessibility, reliability, and potential increases in repair and maintenance costs.
  8. Health Risks:
    • Humans will experience greater loss and damage to life and quality of life from air pollution, decreasing supply of potable water, extreme weather events, and disease. The greatest short term climate change risk to human health is deadly humid heat (wet-bulb temperature). Climate change can affect human health, and properties in areas prone to heatwaves, air pollution, or vector-borne diseases may face increased health risks. This could influence property values and community desirability.Almost all survivors of climate-related disasters suffer from mental distress. Of those who have not experienced climate disasters, more than two-thirds of U.S. adults (68%) have reported climate change anxiety.
  9. Regulatory Changes:
    • Governments may implement stricter building codes, zoning regulations, and disclosure requirements related to climate-related risks. Non-compliance could affect property values and lead to increased costs for property owners. Loss and damage litigation against oil companies and governments will change world economics.
  10. Shifts in Property Demand:

It’s important to note that the degree of risk varies by region and property type. Some areas may experience more immediate and severe impacts, while others may be more resilient. Assessing and mitigating these risks require a comprehensive understanding of local climate vulnerabilities and the implementation of strategies to enhance property resilience. Policymakers, real estate professionals, and property owners are increasingly recognizing the importance of addressing climate risks to ensure the long-term sustainability and value of real estate assets. Thus, our recommendation to evacuate Florida now (i.e. Managed Retreat).

Create a Climate-Resilient Environment in and Around Your Home Brouse (2024)

Managed Retreat: Relocating Due to Climate Change Extreme Weather Events Brouse (2023)

Stormwater Runoff Management for Your House Brouse (2024)

Tree Extinction Due to Human Induced Environmental Stress Mukherjee and Brouse (2005-present)

Soil Degradation and Desertification Brouse (2024)

Atmospheric Rivers Mukherjee and Brouse (2022-2023)

Violent Rain and the Substrate Brouse and Laden (2024)

The Long-term Breathing Experiment Brouse (2023)

Health Impacts of Air Pollution Brouse (2023)

Plymouth Meeting, Pennsylvania and the Substrate Daniel Brouse (2023)

Real Estate Underwater: A Florida Climate Change Case Study Daniel Brouse (2023)

Climate Change Impacts on Flood Risks and Real Estate Values Sidd Mukherjee and Daniel Brouse (2023)

Real Estate and Climate Change: Stranded on an Island Daniel Brouse (2023)

Tipping Cascades, Social-Ecological Systems, and the Hottest Year in History Brouse (2024)

All About Flood Insurance Brouse and Mukherjee (1995-present)

The Age of Loss and Damage Brouse (2023)

bookmark_borderClimate Change and Chaos Theory

By Daniel Brouse
February 5, 2024

Global warming is caused by an increase in thermal energy. Atmospheric circulation together with ocean circulation is how thermal energy is redistributed throughout the world. Chaos theory offers insights into the complex, nonlinear dynamics of climate systems role in the redistribution of thermal energy. The Earth’s climate is a highly complex and dynamic system, influenced by various factors such as ocean currents, atmospheric circulation, and feedback loops.

Circulation systems of air and/or water include:
* doldrums, trade winds, horse latitudes, prevailing westerlies, polar front zone, and polar easterlies
* each hemisphere has three cells — Hadley cell, Ferrel cell and Polar cell in which air circulates through the entire depth of the troposphere
* usually each hemispheres has two jet streams — a subtropical jet stream and a polar-front jet stream
* waves, tides, currents, downwelling, upwelling move water
* there are over 24 currents — Benguela Current, California Current, Falkland Current, Labrador Current, Brazil Current, Florida Current, Gulf Stream, West Australian Current, Canary Current, Kuroshio Current, North Pacific Current, Somali Current, Antarctic Circumpolar Current, Antarctica Current, Antilles Current, Mozambique Current, North Atlantic Drift, Norwegian Current, Oyashio Current, West Wind Drift, Agulhas Current, South Equatorial Current, Humboldt or Peruvian Current, Monsoon Current
* five major ocean-wide gyres —- the North Atlantic, South Atlantic, North Pacific, South Pacific, and Indian Ocean
* thermohaline (temperature and salinity) circulation systems — Gulf Stream, Atlantic Meridional Overturning circulation (AMOC), Pacific Meridional Overturning Circulation (PMOC)
* ocean-atmosphere oscillations — La Nina / El Niño-Southern Oscillation (ENSO), Antarctic Oscillation (AAO), Arctic Oscillation (AO), Atlantic Multidecadal Oscillation (AMO),
Indian Ocean Dipole (IOD), Madden-Julian Oscillation (MJO), North Atlantic Oscillation (NAO), North Pacific Gyre Oscillation (NPGO), North Pacific Oscillation (NPO), Pacific Decadal Oscillation (PDO), Pacific-North American (PNA) Pattern

How does chaos theory explain thermal energy redistributed throughout the world?

  1. Nonlinear Dynamics:
    • Chaos theory emphasizes the nonlinear dynamics of complex systems, meaning that small changes in initial conditions can lead to disproportionately large and unpredictable outcomes. In the context of climate, this nonlinearity is evident in how the redistribution of thermal energy is influenced by factors like ocean currents and atmospheric circulation, which can exhibit chaotic behavior.
  2. Sensitive Dependence on Initial Conditions:
    • Chaos theory also highlights the concept of sensitive dependence on initial conditions, commonly known as the butterfly effect. In climate systems, small variations in initial conditions, such as temperature or atmospheric pressure, can lead to significant changes in the distribution of thermal energy over time.
  3. Complex Feedback Loops:
    • Climate systems involve intricate feedback loops, where changes in one component can influence others. These feedback loops contribute to the complexity and unpredictability of thermal energy redistribution. Chaos theory helps us understand how these feedback mechanisms can amplify or dampen the effects of perturbations in the system.
  4. Emergent Patterns:
    • Chaos theory recognizes the emergence of complex patterns from seemingly chaotic systems. In climate science, emergent patterns may include large-scale phenomena like El Niño or the Madden-Julian Oscillation, which play roles in redistributing thermal energy on a global scale.
  5. Climate Variability and Change:
    • Chaos theory is particularly relevant in studying climate variability and change. While long-term trends such as global warming are discernible, the inherent chaos in the climate system introduces variability and uncertainty, making it challenging to precisely predict how thermal energy will be redistributed over shorter timescales.
  6. Atmospheric Rivers and Droughts:
    • Atmospheric rivers are concentrated bands of moisture in the atmosphere, and their behavior is influenced by various atmospheric factors. Chaos theory comes into play when trying to predict the exact paths and intensities of atmospheric rivers, especially as small changes in initial conditions can lead to vastly different outcomes over time. Droughts result from complex interactions between atmospheric conditions, precipitation patterns, land use, and water management. Chaos theory highlights the sensitivity of drought conditions to initial conditions and the potential for nonlinear responses, making it difficult to precisely predict the onset, duration, and severity of drought events.

Complex Feedback Loops:

Complex feedback loops in climate science refer to interactions between different components of the Earth’s climate system that can amplify or dampen the effects of initial changes, leading to non-linear and often unpredictable outcomes. These feedback loops play a crucial role in shaping the behavior of the climate system and can influence various climate phenomena, including temperature changes, ice melt, and precipitation patterns.

Tipping points are Critical Milestones that directly impact the rate of acceleration in climate change by multiplying the number and intensity of feedback loops. Identifying and understanding these tipping points is crucial for climate science and policymaking. Crossing multiple tipping points could lead to a domino effect, resulting in a much more rapid and severe climate change than currently projected.

  1. Ice-Albedo Feedback:
    • As the Earth warms, ice and snow melt, reducing the surface area covered by highly reflective materials (high albedo). This leads to a decrease in the Earth’s overall reflectivity, or albedo, as darker surfaces (like open water or bare ground) absorb more solar radiation. The increased absorption of sunlight further warms the surface, accelerating ice melt in a self-reinforcing loop.
  2. Water Vapor Feedback:
    • Warmer temperatures can lead to increased evaporation of water from oceans and other bodies of water. Since water vapor is a greenhouse gas, higher atmospheric water vapor concentrations can enhance the greenhouse effect, trapping more heat and further raising temperatures. This positive feedback loop can contribute to the amplification of global warming.
  3. Carbon Cycle Feedback:
    • The carbon cycle involves the exchange of carbon dioxide (CO2) between the atmosphere, oceans, and terrestrial ecosystems. As the climate warms, it can influence processes like the release of carbon from thawing permafrost or changes in vegetation. The additional release of carbon dioxide can amplify the greenhouse effect, leading to further warming and affecting the carbon cycle in a feedback loop.
  4. Ocean Circulation Feedback:
    • Changes in temperature and salinity affect ocean circulation patterns. Alterations in ocean circulation can, in turn, influence heat distribution across the globe. For example, a slowdown in the Atlantic Meridional Overturning Circulation (AMOC) could impact regional climate patterns and further affect ocean circulation in a complex feedback loop.
  5. Vegetation-Climate Feedback:
    • Climate changes can affect vegetation patterns, altering the amount of sunlight absorbed and the release of water vapor through transpiration. Changes in vegetation cover can influence local and regional climates, creating feedback loops that may further impact ecosystems and climate patterns.
  6. Cloud Feedback:
    • Changes in temperature and atmospheric composition can affect cloud cover and properties. While clouds can both reflect sunlight and trap heat, the net effect depends on factors like cloud altitude and type. Changes in cloud cover and properties can influence the Earth’s radiation balance, creating feedback loops that can either amplify or dampen climate changes.

Chaos theory provides a framework for understanding the inherent complexity, sensitivity, and unpredictability of climate systems, including the redistribution of thermal energy. The interconnectedness of various factors and the nonlinear interactions within the Earth’s climate contribute to the intricate patterns observed in thermal energy distribution on a global scale. Climate models use principles from chaos theory to simulate these dynamic interactions.

The Earth is a climate system. Many subsystems make up our climate. Perhaps the most important factor impacting our climate is us. The biggest influence on climate change is the increase in greenhouse gas concentrations in the Earth’s atmosphere, primarily driven by human activities. The largest drivers of human induced climate change include: burning of fossil fuels, deforestation and land use, industrial processes, agriculture, waste management, and use of fluorinated gases.

Human induced climate change is an exponential component of an unordered system (chaos theory).Chaos theory plays a role in understanding the dynamics and potential unpredictability of social-ecological systems’ impact on climate change. Social-ecological systems encompass the interconnectedness of human societies and the ecosystems they are part of, and their behavior is influenced by a myriad of factors, including human activities, policies, resource use, and environmental changes. Chaos theory contributes insights into the complexity, sensitivity to initial conditions, and potential nonlinearities within these systems.

Here are several aspects in which chaos theory can be relevant to forecasting the impact of social-ecological systems on climate change:

  1. Nonlinear Interactions:
    • Social-ecological systems involve nonlinear interactions between human activities and environmental responses. Small changes in policies, resource management, or societal behaviors can lead to disproportionately large and unpredictable outcomes in terms of climate change impacts.
  2. Sensitivity to Initial Conditions:
    • The sensitivity of social-ecological systems to initial conditions highlights the importance of understanding how small changes or decisions can lead to significant and sometimes unexpected consequences over time. This sensitivity is crucial when forecasting the trajectory of climate change impacts resulting from human activities.
  3. Feedback Loops:
    • Feedback loops within social-ecological systems can amplify or dampen the effects of interventions or changes. For example, policies to reduce greenhouse gas emissions may lead to unforeseen economic or social consequences, creating feedback loops that influence climate change impacts.
  4. Emergent Properties:
    • Chaos theory recognizes emergent properties that arise from the interactions within complex systems. In the context of social-ecological systems, emergent properties may include new social norms, economic trends, or environmental patterns that affect and potentially amplify or mitigate the impacts of climate change.
  5. Thresholds and Tipping Points:
    • Social-ecological systems can exhibit thresholds and tipping points, where small changes gradually accumulate until a critical point is reached, leading to abrupt and sometimes irreversible changes. Chaos theory helps to understand the potential for sudden shifts in behavior within these systems.
  6. Adaptive Capacity:
    • Chaos theory encourages consideration of the adaptive capacity of social-ecological systems. The ability to adapt to changing conditions, learn from experiences, and adjust strategies is essential for forecasting and managing the impacts of climate change within these systems.
  7. Uncertainty and Systemic Risks:
    • Chaos theory underscores the inherent uncertainty in complex systems. Social-ecological systems are subject to systemic risks, where interconnected factors can amplify vulnerabilities. Understanding and managing these uncertainties are crucial for forecasting and responding to climate change impacts.

Incorporating chaos theory into forecasting models for social-ecological systems helps researchers and policymakers recognize the limitations of linear thinking and deterministic approaches. Embracing complexity and uncertainty can lead to more robust and adaptive strategies for addressing the multifaceted challenges posed by climate change within the context of human societies and ecosystems.

Our model attempts to adequately account for humans and forecasts an increase of 9 degrees Celsius above pre-industrial levels.

Toppled Tipping Points: The Domino Effect Brouse and Mukherjee (2023)Tipping Cascades, Social-Ecological Systems, and the Hottest Year in History Brouse (2024)
The Reign of Violent Rain Brouse and Mukherjee (2023)
The Age of Loss and Damage Brouse (2023)
Climate Change Impacts on Flood Risks and Real Estate Values Sidd Mukherjee and Daniel Brouse (2023)

bookmark_borderClimate Change, the Jet Stream, and East Coast Atmospheric Rivers

by Daniel Brouse

How is climate change impacting the jet stream and atmospheric rivers on the East Coast of the USA?

The interactions between various factors, including ocean currents, sea surface temperatures, and atmospheric circulation, contribute to the overall climate patterns experienced on the East Coast.

Climate change can influence the jet stream and atmospheric rivers, impacting weather patterns on the East Coast of the USA. Here are some key ways in which these changes may occur:

Jet Stream:

    1. Amplification and Slowing:
      • Climate change can lead to the amplification of atmospheric patterns, including the jet stream. This can result in larger north-south swings, which may contribute to more persistent weather conditions. Additionally, a warming Arctic relative to the mid-latitudes may slow down the jet stream.
    2. Stalled Weather Patterns:
      • A slower, more meandering jet stream can lead to the persistence of weather patterns, causing prolonged periods of extreme conditions such as heatwaves, cold spells, or heavy rainfall.
    3. Shifts in Track:
      • Climate change may alter the typical track of the jet stream, influencing where it tends to position itself. These shifts can impact regional weather patterns, including precipitation and temperature distributions.
    4. Increased Amplification:
      • As the Earth’s poles warm faster than the mid-latitudes, the temperature difference between the Arctic and lower latitudes decreases. This reduction in temperature gradient may lead to a more meandering and slower jet stream with larger north-south waves, a phenomenon known as “jet stream amplification.”
    5. Wavier Jet Stream:
      • The reduced temperature contrast between the Arctic and mid-latitudes can make the jet stream more susceptible to large, slow-moving waves. This wavier pattern can result in more persistent weather conditions, including prolonged periods of heatwaves, cold spells, droughts, or heavy rainfall.
    6. Increased Blocking Patterns:
      • A wavier and slower jet stream can lead to the formation of blocking patterns, where high or low-pressure systems persist in a particular location for an extended period. Blocking patterns can contribute to prolonged and extreme weather events.
    7. Slower Movement:
      • Some studies suggest that the jet stream is slowing down as a result of climate change. A slower jet stream can cause weather systems to move more slowly across the landscape, potentially intensifying the impacts of extreme events such as storms, heatwaves, or heavy rainfall.
    8. Changes in Zonal Flow:
      • The jet stream typically flows from west to east in a relatively straight line, a pattern known as zonal flow. Climate change may lead to more frequent disruptions of this zonal flow, causing the jet stream to meander and creating conditions for more extreme weather events.
    9. Impacts on Weather Extremes:
      • Changes in the jet stream can influence the occurrence and characteristics of weather extremes, including heatwaves, cold snaps, and intense storms. These changes can have significant implications for local and regional climate patterns.

    Atmospheric Rivers:

    1. Increased Moisture Content:
      • Warmer temperatures associated with climate change can enhance evaporation, increasing the moisture content of the atmosphere. This, in turn, can contribute to the development of more intense atmospheric rivers, which are channels of concentrated moisture in the atmosphere.
    2. Changes in Intensity and Frequency:
      • Climate change may lead to alterations in the intensity and frequency of atmospheric rivers. There is evidence suggesting that these phenomena could become more common and more potent, leading to heavier rainfall events and an increased risk of flooding.
    3. Altered Trajectories:
      • Changes in the jet stream’s position and behavior can influence the trajectories of atmospheric rivers. Variations in the jet stream can result in altered paths for these moisture-laden systems, affecting the regions that experience heavy rainfall and potential flooding.
    4. Extreme Weather Events:
      • Atmospheric rivers are often associated with extreme weather events, including heavy rainfall and flooding. Changes in the characteristics of atmospheric rivers due to climate change can contribute to an increased likelihood of severe weather events on the East Coast.

East Coast Atmospheric Rivers and AMOC (Atlantic Meridional Overturning Circulation) Brouse (2024)

Extreme Rainfall–surge Hazard Risk Basics and Atmospheric Rivers Brouse (2022)

West Coast Atmospheric Rivers Brouse (2023)

East Coast Atmospheric Rivers Brouse (2023)

Greenland Atmospheric Rivers Mukherjee (2023)

Owning a Shore Property and Flood Insurance

ALSO SEE:
The Reign of Violent Rain Brouse and Mukherjee (2023)
The Age of Loss and Damage Brouse (2023)
Climate Change Impacts on Flood Risks and Real Estate Values Sidd Mukherjee and Daniel Brouse (2023)

bookmark_borderAtmospheric Rivers and Coastal Erosion

Atmospheric rivers are long, narrow bands of concentrated moisture in the atmosphere that transport large amounts of water vapor. When these atmospheric rivers make landfall, they can bring heavy rainfall over an extended period, leading to increased runoff and potentially contributing to coastal erosion through several mechanisms:

  1. Intense Rainfall: Atmospheric rivers can bring intense and prolonged rainfall, leading to increased runoff from rivers and streams into the coastal areas. This influx of water can contribute to soil erosion and sediment transport, impacting coastal ecosystems.
  2. Flooding: The heavy rainfall associated with atmospheric rivers can cause inland flooding, leading to an increased discharge of water into coastal regions. This excess water can erode coastal land, especially in areas with vulnerable soils.
  3. Storm Surges: In some cases, atmospheric rivers may coincide with storm systems, leading to storm surges along the coast. Storm surges, combined with high winds and heavy rainfall, can intensify erosion along the shoreline.

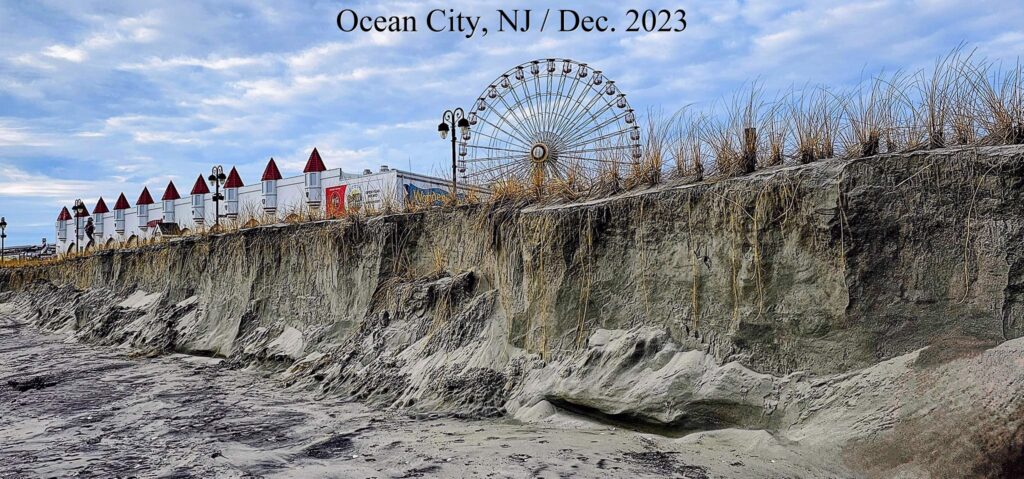
The image shows the Ocean City, New Jersey, shore after an atmospheric river coincided with storm surge.

beach erosion in Ocean City, NJ / December 2023

It’s essential to note that the impact of atmospheric rivers on coastal erosion can vary depending on local topography, land use, and other factors. Coastal erosion is a complex process influenced by a combination of natural and anthropogenic factors, including sea level rise, human activities, and changes in weather patterns.

Owning a Shore Property and Flood Insurance

Extreme Rainfall–surge Hazard Risk Basics and Atmospheric Rivers Brouse (2022)

West Coast Atmospheric Rivers Brouse (2023)

East Coast Atmospheric Rivers Brouse (2023)

Greenland Atmospheric Rivers Mukherjee (2023)

ALSO SEE:
The Reign of Violent Rain Brouse and Mukherjee (2023)
The Age of Loss and Damage Brouse (2023)
Climate Change Impacts on Flood Risks and Real Estate Values Sidd Mukherjee and Daniel Brouse (2023)

bookmark_borderViolent Rain and the Substrate

Daniel Brouse asked:
As the sea levels rise, how far “inland” might we see salinization of fresh water? Is it possible saltwater could infiltrate the Great Lakes?

  • Lake Superior has an elevation of 600 feet above (current) sea level and a depth of 1,332 feet.
  • Lake Ontario is 243 feet above sea level with a depth of 802 feet.
The Great Lakes
The Great Lakes

Greg Laden:
Would not reach the Great lakes, but with a little erosion, the Hudson, Lake Champlain, and the St Lawrence could become contiguous, so New England becomes an Island.

Daniel Brouse:
Thanks! I am particularly interested in the Kennebecasis River (a tributary of the Saint John River in southern New Brunswick, Canada.) Your answer is what I was looking for. Do you have any thoughts on this process… in particular, the changing topography caused by extreme rain events? You can kind-of imagine Eastern and Western North America as giant beaches with ever increasing atmospheric waves splashing down on us. The Gulf Coast will be hit from both sides. We to see increasing intensity and/or frequency in a wide variety of violent rain events including: downpours, flooding, hurricanes, cyclones, monsoons, coastal flooding, storm surges, lightning and wildfires, hail, extreme wind, and concurrent extremes. The reign of violent rain has already begun. More hillsides and shorelines are collapsing. Atmospheric rivers are dramatically increasing flash flooding in the Northeastern USA. Worldwide, stormwater systems are becoming overwhelmed. Ironically, the streets of Abu Dhabi and Dubai, UAE, flooded days before the COP28 Climate Conference. Nowhere is safe from violent rain, not even in the desert preparing for a UN meeting on the climate crisis. As a result of increasing violent rain, new drainage culverts are forming. Eventually, the culverts will transform into recurring streams, carving new canyons, creating new landscapes and islands. Increased wildfires and landslides will transform topography. At the same time as the violent rain makes its way to the sea, the sea is rising to meet the violent rain. What do you think will happen to the floodplains in North America?

Greg Laden:
I have many thoughts on this, and this has been part of my research and study for a very long time, having done coastal archaeology in North America, etc. The basic question is what is the substrate? Sea level rise of 1 meter in Maine means the sea goes up to the top line that is currently 1 meter above the sea (we are ignoring tides) and that’s it for thousands of years. That is because Maine is made out of granite. Sea level rise of 1 meter along Cape Cod, which is glacial till, means that the sea will erode horizontally many many meters. In fact, Cape Cod is a dead-peninsula walking, even given pre-AGW sea level rise. It will all wash away eventually, except any rocky bits of bedrock that might be there (but they aren’t there AFIK) So, given that, yes, storms come in to play. The rate of erosion of Cap Cod, to continue with that example, accelerated in about 1979, due to increased severe coastal storm. What happens to a given floodplain will depend totally on local conditions. Many of our floodplains are not that often flooded, especially in glacial zones where they are filled up, and lower reaches of the giant rivers, and there is a lot of infrastructure in place that will initially control things.

Daniel Brouse:
You might be interested in King of Prussia and Plymouth Meeting, PA. The train derailment in Plymouth Meeting (July 17, 2023) was caused by extreme rainfall and flash flooding that resulted in sinkholes developing in the carbonate rock under the railroad tracks. In July and December of 2023, extreme rainfall resulted in sinkholes being exposed in the carbonate rock under Route 202 in King of Prussia, PA. I guess this is part of the local conditions that vary widely from location to location?

ALSO SEE: Plymouth Meeting, Pennsylvania and the Creation of the Climate Crisis / Daniel Brouse (2023)

The Reign of Violent Rain

Greenland and the Collapse of the East Antarctic Ice Sheet

Sea Level Rise: Then and Now

Climate Change: Rate of Acceleration

Flood Insurance

The Human Induced Climate Change Experiment

bookmark_borderGravity, Sea Level Rise and Surge

by Daniel Brouse and Sidd Mukherjess

In general, the coasts that are seeing the largest storm surges are the same areas that are experiencing the fastest rate of sea level rise. The sea level does not rise at the same rate for most coastlines. Some of the conditions that determine the sea level at any given location include: water temperature (thermal expansion), circulation, ocean floor contour, ice melt, ocean dynamics, and Earth’s uneven gravity field.

Idalia Storm Surge 2023

The Shape of Things to Come
For the foreseeable future, storm surges will offer a good forecast of future sea level rise. Hurricane Idalia’s storm surge (pictured / 2023), brought a 10-15 storm surge to the northern coast of Florida. In 2022, Hurricane Ida brought a 14-20 foot storm surge to the southern coast of Florida. Ida also made landfall in Southeastern USA. Plaquemines Parish on the east bank of the Mississippi River had an estimated storm surge of at least 14 feet. Grand Isle, Louisiana, which was located just east of the landfall, was struck by 10.2 feet and rendered uninhabitable after the storm.

We know these areas of the United States will see sea levels rise at least 10-15 feet because it has already happened. Although it was only for hours, you wouldn’t want to live there during those hours. Not to mention, the frequency of these extreme weather events is rising exponentially. Thus, our recommendation to evacuate Florida now (i.e. Managed Retreat.) The billions of dollars spent to rebuild after Hurricane Ida will all be for naught. Allowing building will needlessly endanger property and lives. Parts of the world have already seen storm surges of 40 feet. I expect most North American coastlines will see sea levels rise, if only temporarily, by 20-40 feet this century. Within a generation, these areas could be submerged most of the time.

Don’t Be Fooled by Relative Variations
The level of the oceans is rising; however, some climate change deniers may try to claim that sea level is receding. Yes, in some instances certain areas will see a decline in the relative sea level. As ice melt accelerates, gravity and glacial isostatic adjustment will have a greater impact on where the sea level rises the most. Greenland is a good example. Greenland has one of the largest land ice sheets. You might think the sea would rise the fastest closest to the melt. “Greenland is like a bowl with large cracks in its sides.” The giant ice mass has sunk the ground, as well as, added a huge mass on top of it. Much of Greenland’s ice melt is just kind-of hanging out in the bowl. Two things are happening to change that:
1) As the ice mass melts, it exerts less gravitational pull on the surrounding water and the water gets pulled toward the equator.
2) At the same time, the Earth is rebounding under the bowl as the mass moves away. Much will depend on the extent and speed of the rebound. Though we don’t know how fast the rebound will happen, NASA has a satellite program gathering better data by measuring the gravitational pull on the satellite (GRACE Tellus Gravity Recovery & Climate Experiment).

At the same time that Greenland is “rising”, many cities are sinking. Alexandria, Amsterdam, Bangkok, Charleston, Miami, New Orleans, New York, Chicago, and Norfolk are all “caving in.” Houston is the 10th-fastest sinking city in the world, and the U.S. city sinking the fastest.

Sidd added, “As the ice melts off Greenland, sea level will rise around Antarctica and drop around Greenland, and as the ice melts in Antarctica, sea will rise around Greenland and drop around Antarctica. In general, sea levels fall where the ice is melting and rise on the other side of the world. There is a small effect on earth rotation and polar direction, but not enough to worry about.”

Measuring Sea Level Rise
So, one of the biggest questions in the future is how do you measure sea level rise? From where the land was pre-industrial, where the land is today, or where the land is tomorrow? In any event, the Earth crossed tipping points which make extreme sea level rise inevitable and irreversible. Planners should plan on it.

Sidd reiterated, “That 270 feet of sea level rise will take a long time. I would be more careful about the violent rain than the ice melt.”

Greenland and the Collapse of the East Antarctic Ice Sheet

Sea Level Rise: Then and Now

Climate Change: Rate of Acceleration

Flood Insurance

The Human Induced Climate Change Experiment

bookmark_borderClimate Change: Atmospheric Rivers

Extreme Rainfall–surge Hazard Risk Basics and Atmospheric Rivers Brouse (2022)

West Coast Atmospheric Rivers Brouse (2023)

East Coast Atmospheric Rivers Brouse (2023)

Greenland Atmospheric Rivers Mukherjee (2023)

ALSO SEE:

Real Estate and Flood Insurance Brouse and Mukherjee (1999 to present)
The Reign of Violent Rain Brouse and Mukherjee (2023)
The Age of Loss and Damage Brouse (2023)
Climate Change Impacts on Flood Risks and Real Estate Values Sidd Mukherjee and Daniel Brouse (2023)