“FEMA confirmed to the Miami Herald that it is looking into switching to risk-based pricing in 2020, which would end the subsidies most coastal communities enjoy on their flood insurance premiums and show the true dollar cost of living in areas repeatedly pounded by hurricanes and drenched with floods — like South Florida.
“That means insurance is about to become very expensive, and it kind of sounds the bell that these are high-risk areas,” said Wayne Pathman, a Miami-based land use attorney and chair of the city’s Sea Level Rise Committee.
Premiums through the National Flood Insurance Policy are already rising an average of eight percent this year; the first wave of pricier policies started in April. That brings the average annual price (including surcharges) for a policy holder to $1,062.
It’s all part of a strategy to make the NFIP financially stable. The program is $20 billion in debt (and that’s after the government forgave $16 billion of that debt last year) because it pays out much more each year than it takes in.”
In a report published by NOAA, the 2017 nation‐wide average annual frequency of high tide flooding hit an all‐time record.
If high tide flooding in 2018 follows historical patterns, flooding will be most common during the winter (Dec‐Feb) along the West Coast and the northern section of Northeast Atlantic Coast in response to winter storms and more‐predictable monthly highest astronomical tides (predicted tides). Along the Gulf and along much of the Atlantic Coasts, flood patterns are less predictable and occur usually in response to weather effects.
Flooding is, however, most common during the fall (Sep‐Nov) when the mean sea level cycle peaks, and more often during monthly highest predicted tides in some Southeast Atlantic locations. Breaking of annual flood records is to be expected next year and for decades to come as sea levels rise, and likely at an accelerated rate (Sweet et al., 2017b).
When high tide flood frequencies along the entire U.S. coastline are averaged (Figure 3b), the 2017 national average of 6 days . . . is record breaking. Rising ocean levels along the U.S. coastline (Figure 3b, blue line) of about 2 mm/year since 1920 are driving (along with local land subsidence) a rapid increase in U.S. high tide flood frequencies. The U.S. average high tide flood frequency is now 50% greater since 2000 and 100% greater than it was 30 years ago.
total precip goin up (mainly over ocean)
but areas of precip shrinking (also mainly over ocean)
== smaller and more intense storms over ocean
(in case i didn’t spell it out: watch out coastline and islands)
open access paper at http://iopscience.iop.org/article/10.1088/1748-9326/aab375/pdf
“Perhaps you think youâ??re safe because the flood map shows your home is on high ground. But you still need infrastructure â?? things like roads, power plants, water treatment facilities, airports and drinking-water wellfields. So while your house may be high and dry, good luck getting to the grocery store, the doctorâ??s office or out of town.” http://www.miamiherald.com/opinion/editorials/article210451219.html
Climate change is causing extreme weather events. In addition, climate change is causing the sea level to rise.
In an article for Phys.org, anthropologist David Casagrande asks, “When people’s homes are damaged by flooding year after year and they are offered a buyout, why don’t they leave?”
“In some cases, houses on Smith Island in the Chesapeake Bay have been in families for thirteen generations. They’re not going anywhere.”
Casagrande employs cognitive dissonance theory to identify the rationales that residents employ to “avoid having to make really difficult decisions”—such as leaving.
“On Smith Island, for example, many people blame the U.S. Army Corps of Engineers for not doing a better job of preventing erosion. There is an erosion problem, but that is not the only challenge.”
“the height of what constitutes a 50-year flood event has risen by more than 10 centimeters per decade in some places”
“A rule of thumb holds that the frequency of events can be extrapolated up to four times as far into the future as the observational record reaches backward. A few decades of data won’t be sufficient to inform forecasts for a 10,000-year flood event, as is required for some communities and for sensitive infrastructure such as nuclear power plants.”
“[Re: Boston] what was a 100-year event in the 1820s is now more like an 8-year event”
“the coasts of the contiguous United States will fare differently. In eastern cities such as New York City and Charleston, South Carolina, it is the nuisance flooding that will become more frequent. By contrast, western cities such as Seattle in Washington, and San Diego in California, should expect more-frequent flooding from extreme events.”
“While many states have affirmed their commitment to strong building codes, in others there is a concerning lack of progress in the adoption and enforcement of updated residential building code systems. Because residential building codes represent a minimum life-safety standard for occupancy, the findings suggest that many homes remain at risk from severe hurricane events.”
Below are the 2018 state scores, based on a 100-point scale, where 100 is the best available score:
If you purchase real estate in a flood plain and obtain a mortgage, you will be required to purchase flood insurance.
Roy Wright oversees the Federal Emergency Management Agency’s (FEMA) National Flood Insurance Program. In a presentation to the Insurance-& Risk-Linked Securities Conference, Wright said to forget about checking the flood plain maps and check your drivers license. “If it says Florida, you need flood insurance.” FEMA is examining properties on coasts and in flood plains that have been repeatedly rebuilt “that we probably shouldn’t be providing coverage on.”
The national flood insurance program is now $20 billion in debt, largely because of Irma and other catastrophic storms like Harvey. Wright, during a break in the insurance conference, sat down with the Miami Herald to outline a plan to stabilize a troubled federal program vital to Florida’s real estate industry. It includes ambitious goals to double enrollment over the next five years amid a major makeover that will include more aggressive purchases of re-insurance and catastrophe bonds.
By law, only homes with federally-backed mortgages in high-risk zones are required to have insurance.
The National Flood Insurance Program provides nearly three times the number of policies in Florida as any other state.
National Flood Insurance Program
In the lead-up to Irma, an Associated Press analysis found that the number of Florida homes covered in high-risk areas had dropped by 15 percent in the previous five years. Fewer than half in hazard zones were protected from flood damage.
Wright blamed the problem partly on flood maps that, like hurricane tracking maps, can mislead homeowners on actual risks.
“We really gotta help people move beyond and quit focusing just on the lines,” he said. “Because nature, the day it rains, pays no attention to the lines.”
By contrast, when Harvey slammed the Texas coast, the national flood program insured 70 percent of the homes in moderate flood zones in Harris County. After the storm passed, 60 percent of the claims came from those moderate zones, proof that storms don’t always follow the contours of a flood map, Wright said.
“That’s true in areas of Florida as well,” he said.
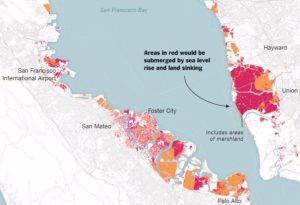
The report indicates that the sinking land (called land subsidence) will increase the reach and damage of flooding in the Bay Area. The impact will be more dramatic than predicted in the forecasts for 2100.
“It’s a very well-known problem, but we really don’t know how fast it’s going to be in the second half of the 21st century. This is a projection,” Dr. Shirzaei said.
San Fransisco Bay Circa 2100
Abstract
by Manoochehr Shirzaei and Roland Bürgmann
The current global projections of future sea level rise are the basis for developing inundation hazard maps. However, contributions from spatially variable coastal subsidence have generally not been considered in these projections. We use synthetic aperture radar interferometric measurements and global navigation satellite system data to show subsidence rates of less than 2 mm/year along most of the coastal areas along San Francisco Bay. However, rates exceed 10 mm/year in some areas underlain by compacting artificial landfill and Holocene mud deposits. The maps estimating 100-year inundation hazards solely based on the projection of sea level rise from various emission scenarios underestimate the area at risk of flooding by 3.7 to 90.9%, compared with revised maps that account for the contribution of local land subsidence. Given ongoing land subsidence, we project that an area of 125 to 429 km2 will be vulnerable to inundation, as opposed to 51 to 413 km2 considering sea level rise alone.
The flood risks across the whole USA are seriously underestimated
The following paper covers all flood risk, not just the coasts, but inland and all the causes including sea level rise as well as flooding rivers and large precipitation events outside watersheds.
“Estimates of present and future flood risk in the conterminous United States”
Oliver E J Wing , Paul D Bates, Andrew M Smith, Christopher C Sampson, Kris A Johnson, Joseph Fargione and Philip Morefield
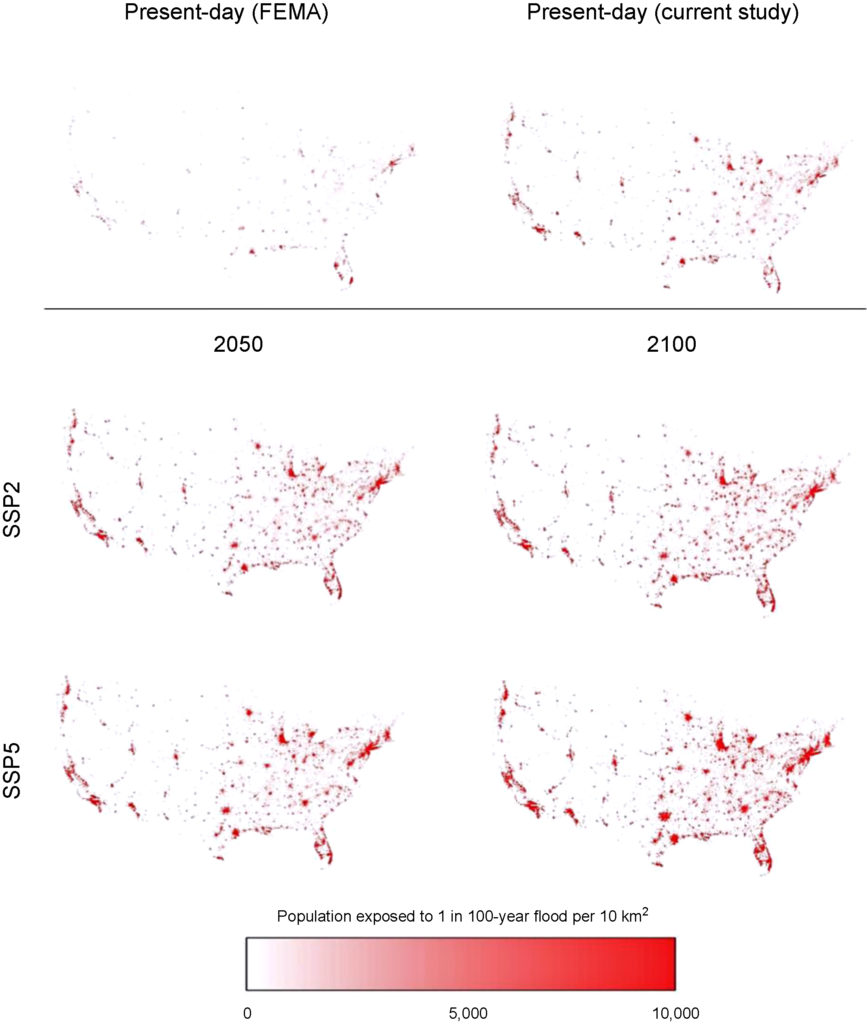
Wing et al. analyze flood risk in the US lower 48. Apparently 41 million are at risk rather than 13 million in current FEMA estimates.
WARNING: this paper specifically does not cover sea levels rise and increased precipitation.
“Our data show that the total US population exposed to serious flooding is 2.6–3.1 times higher than previous estimates, and that nearly 41 million Americans live within the 1% annual exceedance probability floodplain (compared to only 13 million when calculated using FEMA flood maps)”
“The analysis shows that 40.8 million people (13.3% of the population) are currently exposed to a 1 in 100 year (1% annual exceedance probability) fluvial or pluvial flood in the CONUS, which translates to a GDP exposure of $2.9 trillion (15.3% of total GDP)”
“This analysis indicates that previous estimates capture roughly one-third of the exposure identified in our 1 in 100 year floodplain.”
“It doesn’t take into account sea level rise and heavier rainfall expected to come along with climate change, so it likely underestimates the exposure, the authors warned.”
“Disaster on the Horizon: The Price Effect of Sea Level Rise”
Asaf Bernstein, Matthew Gustafson, and Ryan Lewis.
Sea level rise coming home, the market is paying attention (Halleluia! who woulda thunk it. The real estate market, especially on the coasts is a wretched hive of villainy))
The first sentence of the abstract is “Homes exposed to sea level rise (SLR) sell at a 7% discount relative to observably equivalent unexposed properties equidistant from the beach.”
More:
“This effect is primarily driven by properties unlikely to be inundated for over half a century, suggesting that it is driven by investors pricing long horizon concerns about SLR costs.”
” … the SLR exposure discount has increased substantially over the past decade, coinciding with both increased awareness and more pessimistic prognoses about the extent and speed of rising oceans. In particular, we document increased transaction volume and lower prices for sophisticated buyers following the significant revisions of the IPCC’s 2013 release, which increased SLR projects and awareness.”
” … properties that will experience ocean encroachment after 1 foot of global average sea level rise trading at a 22%, 2-3 feet at a 17% discount, 4-5 feet at a 9% discount and 6 feet at a 6% discount. [4] Using the long run discount rate provided by Giglio et al. (2014) and assuming complete loss at the onset of inundation, we estimate that markets expect 1 foot of sea level rise within 35 years, 2-3 feet within 45 years, 4-5 feet after 65 years, and 6 feet in 80 years. These results are consistent with the medium to high projections provided in Parris et al. (2012) and utilized by the NOAA in their 2012 report.
” … exposed non-owner occupied properties trade at a 10% to 11% discount, relative to comparable non-exposed properties. ”
” … expectations regarding future SLR have steadily increased over the course of our sample period … At the beginning of our sample in 2007 we find no significant difference between the prices of exposed and unexposed properties. By the end of our sample in 2016, exposed non-owner occupied properties are priced approximately 13.5% below comparable unexposed properties.”
” … we find evidence that the discount applied to non-owner occupied properties increased from 8.1% to 14.0% following the IPCC release.
” … consistent with the idea that as information about SLR risks comes to light, exposed properties should be more likely to transact, we find that the annual probability of turnover is approximately 0.2 percentage points higher for exposed properties between 2011 and 2016 (relative to a base transaction rate of approximately 11% for all properties). This is entirely driven by the period following the IPCC report where we see a 0.8 percentage point increase in the annual probability of an exposed property transacting.”
I see a remake of the “The Big Short” coming up. A good title might be “Underwater.”
Homeowners living in flood plain have learned the hard way that climate change has effected their ability to get a mortgage. As the sea level rises and extreme weather events intensify, homeowners have found their insurance rates increasing or their total inability to obtain insurance coverage. Without insurance it is very, very hard to get a mortgage.
Moody’s credit ratings are now going to have a similar impact on municipalities. “What we want people to realize is: If you’re exposed, we know that. We’re going to ask questions about what you’re doing to mitigate that exposure,” Lenny Jones, a managing director at Moody’s, said in an interview. “That’s taken into your credit ratings.”
Bloomberg news agency reports:
In its report, Moody’s lists six indicators it uses “to assess the exposure and overall susceptibility of U.S. states to the physical effects of climate change.” They include the share of economic activity that comes from coastal areas, hurricane and extreme-weather damage as a share of the economy, and the share of homes in a flood plain.
Based on those overall risks, Texas, Florida, Georgia and Mississippi are among the states most at risk from climate change. Moody’s didn’t identify which cities or municipalities were most exposed.
“If I was a city official, I’d be asking a whole lot of questions about what vulnerabilities their community has, and how each new proposed development adds to that vulnerability,” said Rob Moore, a senior policy analyst at the Natural Resources Defense Council. “Because at some point, your creditors certainly will.”