bookmark_borderClimate Change, Gut Dysbiosis, and the Human Microbiome

How Environmental Stressors Disrupt Gut Health, Sleep, and Systemic Well-Being

By Daniel Brouse

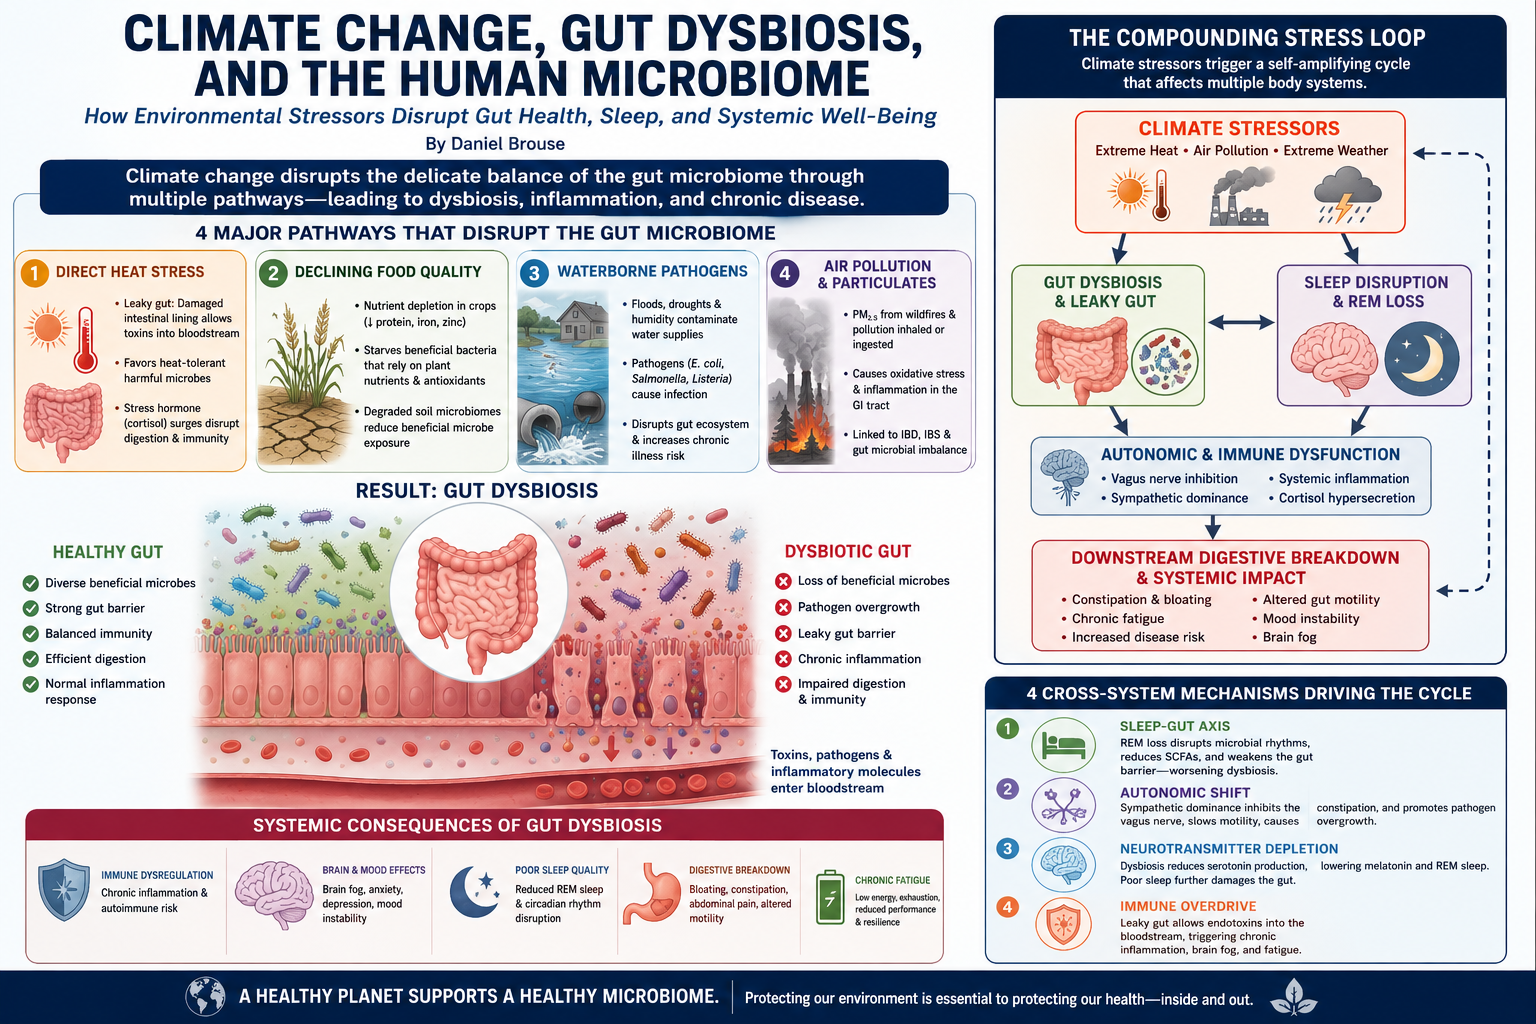
The human gut microbiome is one of the body’s most complex and essential ecosystems, influencing digestion, immunity, metabolism, and even brain function. A growing body of scientific evidence indicates that climate change is emerging as a significant environmental threat to this internal ecosystem.

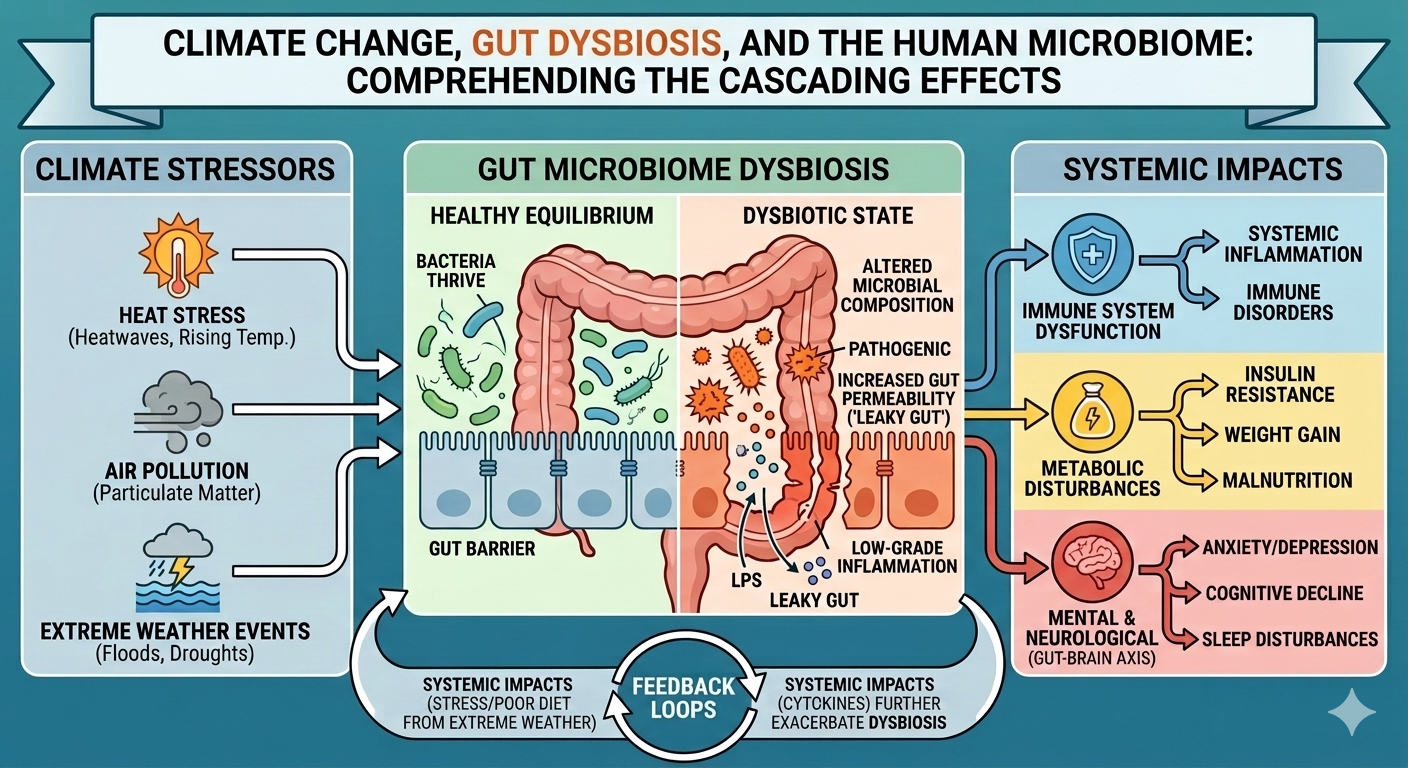
Climate change can induce gut dysbiosis—an imbalance in which beneficial microorganisms decline while opportunistic or pathogenic microbes proliferate. Recent clinical reviews, including research published in The Lancet Planetary Health, suggest that climate-driven environmental changes disrupt the gut microbiome through both direct physiological stress and indirect environmental pathways. The consequences extend well beyond digestive discomfort, affecting immune regulation, sleep quality, mental health, and overall resilience.


How Climate Change Disrupts the Gut Microbiome

Climate change degrades the gut microbiome through several interconnected mechanisms.

1. Direct Heat Stress

Extreme heat affects far more than body temperature. It alters gastrointestinal physiology in ways that directly damage the gut ecosystem.

Increased Intestinal Permeability (“Leaky Gut”)

Heat stress weakens the intestinal barrier, increasing its permeability. This allows bacteria, endotoxins, and inflammatory compounds to enter the bloodstream, triggering systemic inflammation and immune activation.

Shift Toward Heat-Tolerant Microbes

Elevated body temperatures alter the intestinal environment, favoring heat-tolerant microbial populations while reducing beneficial bacteria that regulate metabolism, digestion, and immune function.

Stress Hormone Activation

Exposure to prolonged heat stimulates increased production of cortisol and other stress hormones. Elevated cortisol alters gut oxygen levels, immune signaling, and microbial composition while impairing normal digestive processes.


2. Declining Food Quality

Climate change is also altering the nutritional quality of the global food supply.

Nutrient Depletion

Elevated atmospheric carbon dioxide changes plant carbon-to-nitrogen ratios, reducing concentrations of essential nutrients including:

  • Protein
  • Iron
  • Zinc
  • Various micronutrients

These nutritional changes reduce both the quality of human diets and the diversity of nutrients available to gut microbes.

Starvation of Beneficial Microbes

Beneficial bacteria rely on dietary fiber, antioxidants, and complex plant compounds. As these nutrients decline, populations such as Bacteroidetes decrease while pro-inflammatory microbial groups expand.

Degraded Soil Microbiomes

The Biodiversity Hypothesis proposes that biologically rich soils contribute beneficial environmental microbes that help educate the human immune system. Climate-driven degradation of soil biodiversity reduces this microbial exposure, potentially increasing immune dysfunction and inflammatory disease.


3. Expansion of Waterborne Pathogens

Climate change increases flooding, drought, and water-system failures, all of which elevate exposure to enteric pathogens.

Common organisms include:

  • E. coli
  • Salmonella
  • Listeria

These pathogens can produce acute gastrointestinal infections while permanently altering the composition of the gut microbiome, increasing susceptibility to chronic inflammatory diseases.


4. Air Pollution and Wildfire Smoke

Climate change is increasing exposure to airborne pollutants, particularly fine particulate matter (PM₂.₅).

Although inhaled, these particles are also swallowed through mucus clearance and contaminated food or saliva.

Within the gastrointestinal tract they promote:

  • Oxidative stress
  • Local inflammation
  • Microbial imbalance
  • Increased risk of inflammatory bowel disease (IBD)
  • Increased risk of irritable bowel syndrome (IBS)

Climate Stressors Create a Compounding Health Loop

The most significant health impacts occur because climate stressors do not operate independently. Instead, they reinforce one another, creating a self-amplifying cycle that affects multiple body systems simultaneously.

                    CLIMATE STRESSORS
(Heat • Air Pollution • Extreme Weather)
│
┌────────────────┴────────────────┐
▼ ▼
Gut Dysbiosis Sleep Disruption
Leaky Gut Reduced REM Sleep
│ │
└──────────────┬──────────────────┘
▼
Autonomic & Immune Dysfunction
• Elevated Cortisol
• Reduced Vagal Activity
• Chronic Inflammation
• Sympathetic Dominance
│
▼
Digestive and Systemic Breakdown
• Constipation
• Altered Gut Motility
• Chronic Fatigue
• Mood Disorders
• Brain Fog

Cross-System Mechanisms

1. The Sleep-Gut Axis

The gut microbiome follows a circadian rhythm closely linked to the brain’s sleep-wake cycle.

Microbial “Jet Lag”

Heat waves frequently fragment sleep and reduce REM sleep, disrupting the normal daily oscillations of gut microbial populations.

Reduced Short-Chain Fatty Acid Production

Sleep deprivation decreases beneficial bacteria such as Lactobacillus and Bifidobacterium. These organisms produce short-chain fatty acids (SCFAs), which:

  • maintain the intestinal barrier,
  • reduce inflammation,
  • nourish colon cells, and
  • support immune regulation.

Reduced SCFA production weakens intestinal integrity and promotes chronic inflammation.

Worsening Leaky Gut

Poor sleep activates stress pathways that further increase intestinal permeability, amplifying the direct damage caused by heat exposure.


2. Autonomic Nervous System Dysfunction

Normal digestion depends upon the parasympathetic nervous system—the body’s “rest and digest” mode.

Heat stress, poor sleep, and pollution shift the body toward chronic sympathetic activation (“fight or flight”).

Reduced Vagus Nerve Activity

Suppression of the vagus nerve disrupts communication between the brain and the gastrointestinal tract.

Slowed Intestinal Motility

Reduced vagal activity decreases intestinal movement while heat diverts blood flow away from digestive organs toward the skin for cooling.

The result is:

  • constipation,
  • bloating,
  • abdominal discomfort, and
  • impaired digestion.

Pathogen Overgrowth

Slower intestinal transit allows opportunistic bacteria more time to multiply and produce inflammatory metabolites, further worsening dysbiosis.


3. Neurotransmitter Disruption

The gut and brain communicate continuously through the gut-brain axis.

Approximately 90% of the body’s serotonin is produced within the gastrointestinal system, largely under the influence of the gut microbiome.

Serotonin serves as the biochemical precursor to melatonin, the hormone responsible for regulating sleep.

When dysbiosis disrupts serotonin production:

  • melatonin synthesis declines,
  • sleep quality deteriorates,
  • REM sleep decreases,
  • microbial disruption worsens.

This creates a powerful positive feedback loop in which poor gut health degrades sleep, while poor sleep further damages the gut microbiome.


4. Chronic Immune Activation

Leaky gut allows bacterial endotoxins—particularly lipopolysaccharides (LPS)—to enter the bloodstream.

This condition, known as metabolic endotoxemia, activates chronic systemic inflammation.

Inflammatory molecules can cross the blood-brain barrier, contributing to:

  • brain fog,
  • fatigue,
  • impaired cognition,
  • anxiety,
  • depression,
  • emotional instability.

Conclusion

Climate change is not solely an environmental or atmospheric issue—it is increasingly becoming a public health issue that reaches into the microscopic ecosystems within our own bodies. Heat stress, declining food quality, water contamination, air pollution, and disrupted sleep all converge to reshape the human gut microbiome.

The resulting dysbiosis extends beyond digestion. It contributes to chronic inflammation, weakened immunity, impaired metabolism, sleep disruption, mood disorders, and reduced cognitive performance. Because these physiological systems are tightly interconnected, climate-induced damage to one often amplifies dysfunction in others, creating self-reinforcing cycles that become progressively more difficult to reverse.

Protecting the stability of the Earth’s climate is therefore inseparable from protecting the stability of the human microbiome. As climate change accelerates, preserving environmental health increasingly means preserving human health at its most fundamental biological level.
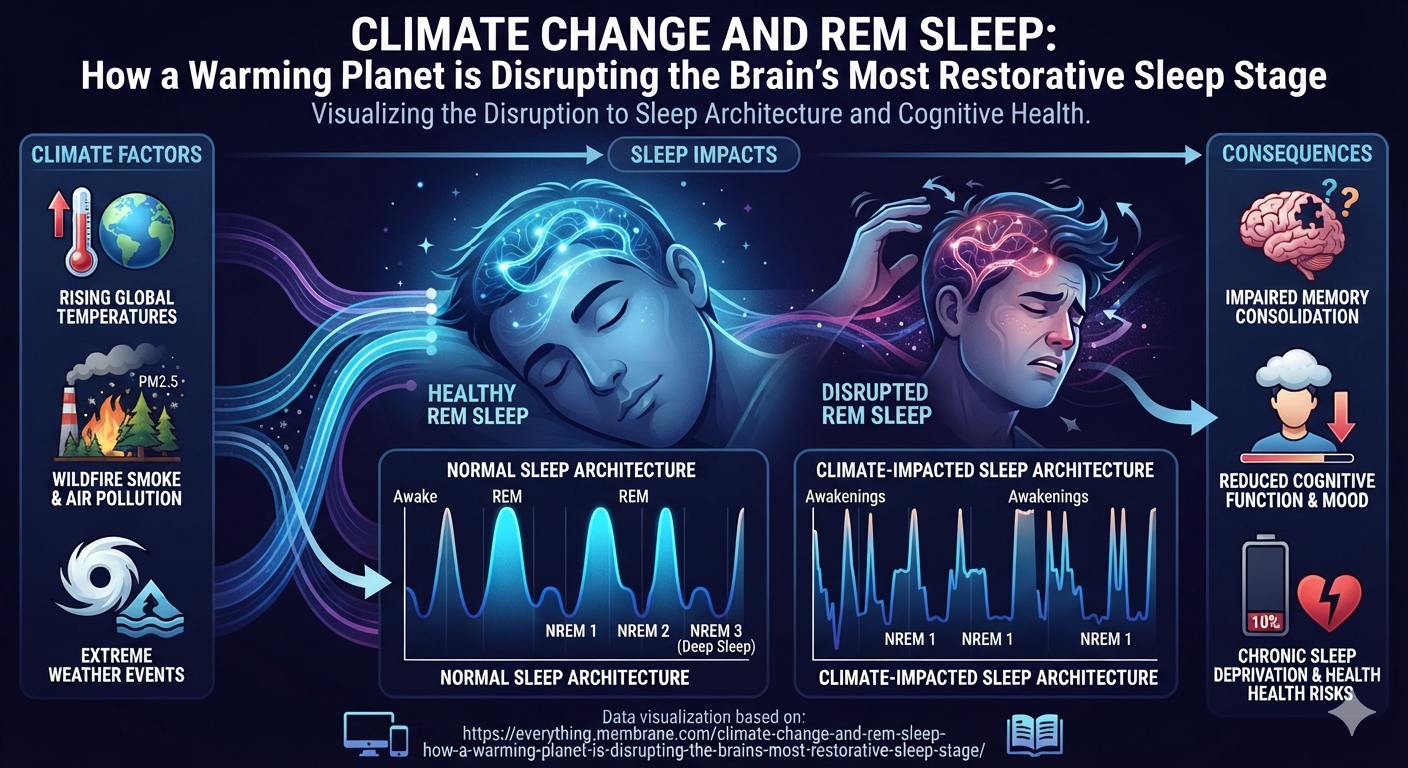
bookmark_borderClimate Change and REM Sleep: How a Warming Planet is Disrupting the Brain’s Most Restorative Sleep Stage

by Daniel Brouse

Preface

This summer, I began noticing a significant decline in both my overall sleep quality and, in particular, my REM (Rapid Eye Movement) sleep. After reviewing the data from my sleep tracker, I was able to link much of the disruption to elevated nighttime temperatures. Then, last night, another factor became impossible to ignore: severe thunderstorms, high winds, and frequent lightning repeatedly interrupted my sleep.

The connection became even more compelling when I realized my dog had been experiencing the same restless nights. Heat, noise, and rapidly changing weather were affecting both of us. That realization led me to a broader question: if these environmental changes are disrupting sleep in my own home, how many millions of others are experiencing the same effects?

I woke up inspired to explore the science behind these observations. This paper examines how climate change—through rising nighttime temperatures, increasing humidity, and more frequent extreme weather events—is affecting sleep quality, REM sleep, and ultimately human health and well-being.

Abstract

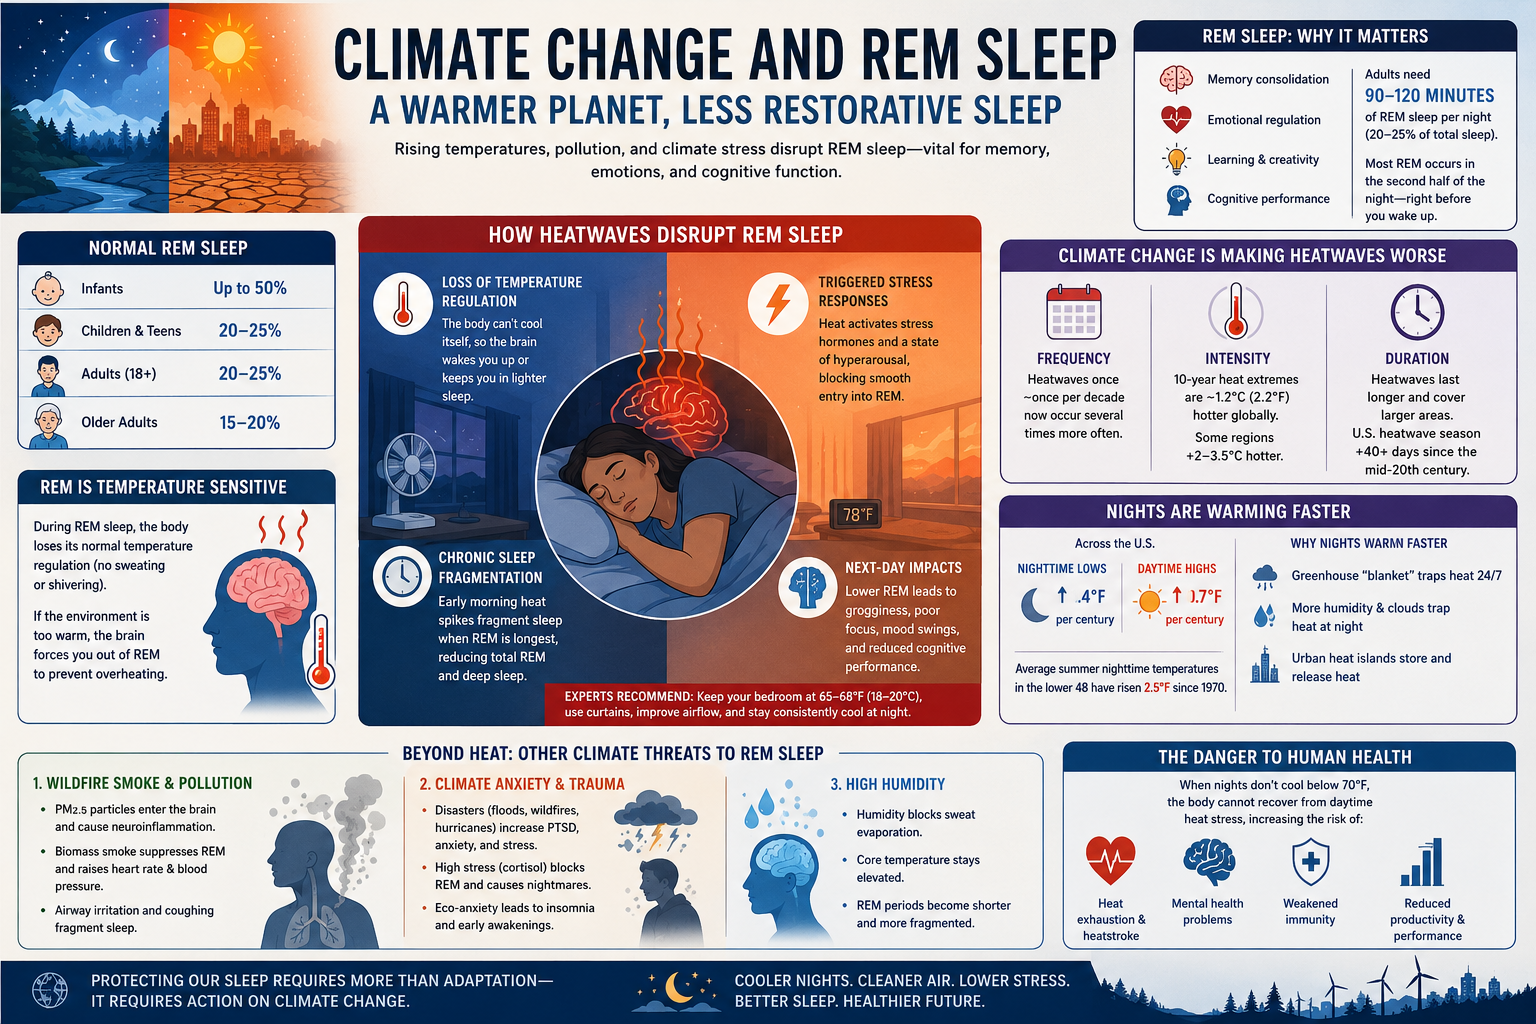
Climate change is increasingly recognized as a public health crisis extending far beyond heat-related mortality and cardiovascular disease. One of its lesser-known but rapidly emerging consequences is the degradation of human sleep, particularly Rapid Eye Movement (REM) sleep. REM sleep is essential for memory consolidation, emotional regulation, learning, creativity, and cognitive performance. A warming climate disrupts REM sleep through multiple interacting mechanisms including elevated nighttime temperatures, increased humidity, wildfire smoke, air pollution, psychological stress, and extreme weather disasters. These impacts are compounded by the increasing frequency, duration, and intensity of heatwaves and the accelerating rise in nighttime minimum temperatures. This review examines the physiological basis of REM sleep, the mechanisms through which climate change disrupts REM architecture, and the broader implications for human health and societal resilience.


Introduction

Sleep represents one of the body’s most critical restorative processes. Among its various stages, Rapid Eye Movement (REM) sleep plays a unique role in maintaining healthy brain function. During REM sleep, memories are consolidated, emotional experiences are processed, neural pathways are strengthened, and learning occurs.

Historically, sleep evolved under predictable environmental conditions characterized by cool nights and stable seasonal temperature cycles. Anthropogenic climate change is fundamentally altering these conditions. Rising greenhouse gas concentrations have increased average global temperatures while disproportionately elevating nighttime minimum temperatures. The resulting loss of nocturnal cooling increasingly prevents the human body from maintaining the thermal conditions necessary for uninterrupted REM sleep.

Climate change therefore represents not only an environmental crisis but also a growing neurological and public health challenge.


Normal REM Sleep

Healthy adults typically require approximately 90 to 120 minutes of REM sleep each night, representing roughly 20–25% of total sleep time. REM sleep supports numerous neurological functions, including:

  • Memory consolidation
  • Emotional regulation
  • Learning
  • Creativity
  • Cognitive flexibility
  • Neural development

REM sleep becomes progressively longer throughout the night, with the largest REM periods occurring during the final third of sleep immediately before awakening.

Age influences REM requirements:

Age GroupApproximate REM Sleep
InfantsUp to 50%
Children & Adolescents20–25%
Adults20–25%
Older Adults15–20%

Because REM occurs predominantly during the second half of the night, disturbances during early morning hours disproportionately reduce total REM sleep.


Thermoregulation During REM Sleep

REM sleep differs fundamentally from every other sleep stage because the body’s normal temperature regulation is largely suspended.

During REM sleep:

  • sweating is greatly reduced
  • shivering ceases
  • metabolic heat production decreases
  • behavioral temperature regulation becomes impossible

This temporary loss of thermoregulation makes REM sleep particularly vulnerable to elevated ambient temperatures.

If body temperature rises excessively, the brain interprets overheating as an immediate survival threat. Rather than remaining in REM sleep, protective neural circuits trigger arousal, forcing the sleeper into lighter sleep stages or complete awakening.

Consequently, REM sleep becomes the first major casualty of excessive nighttime heat.


Heatwaves and REM Sleep

Heatwaves interfere with sleep architecture through several overlapping physiological mechanisms.

Failure of Core Body Cooling

Normal sleep requires a gradual decline in core body temperature.

When nighttime temperatures remain elevated:

  • heat dissipation slows
  • skin temperature remains elevated
  • the brain struggles to initiate deeper sleep stages
  • REM duration decreases

Without adequate cooling, REM episodes become shorter and increasingly fragmented.


Activation of Stress Responses

Persistent heat activates multiple stress systems including:

  • sympathetic nervous system activation
  • elevated cortisol
  • increased heart rate
  • heightened neuronal arousal

Instead of transitioning smoothly into REM sleep, individuals remain trapped in lighter sleep characterized by repeated awakenings.


Sleep Fragmentation

Because REM sleep predominates during the second half of the night, rising early morning temperatures have an especially damaging effect.

Even brief awakenings interrupt REM cycles.

Repeated fragmentation produces:

  • reduced REM duration
  • impaired emotional regulation
  • slower reaction times
  • diminished concentration
  • poorer memory formation

Research increasingly shows that elevated nighttime temperatures reduce both REM sleep and slow-wave (deep) sleep, leaving individuals less physically and mentally restored upon waking.


Climate Change Has Intensified Heatwaves

Anthropogenic climate change has dramatically altered the characteristics of extreme heat events.

Increased Frequency

Heatwaves that historically occurred approximately once every decade now occur several times more frequently under approximately 1.2–1.4°C of global warming.

Across the United States, the annual number of extreme heat events has increased substantially since the mid-20th century.


Greater Intensity

Modern heatwaves are significantly hotter.

Globally, heat extremes that historically occurred once every ten years are now approximately 1.2°C (2.2°F) warmer than they would have been without human-caused climate change.

Some regional heatwaves have been intensified by 2–3.5°C due to anthropogenic greenhouse gas emissions.


Longer Duration

Heatwaves now persist for longer periods.

Persistent atmospheric blocking patterns, commonly known as heat domes, allow hot air masses to remain stationary for days or even weeks.

In the United States, the heatwave season has expanded by more than 40 days compared with the mid-twentieth century.


Rising Nighttime Temperatures

Perhaps the most important climate-related threat to REM sleep is the rapid rise in nighttime minimum temperatures.

Across much of the United States:

  • overnight temperatures are increasing nearly twice as fast as daytime highs
  • nighttime minimum temperatures have increased approximately 1.4°F per century
  • daytime maximum temperatures have increased roughly 0.7°F per century

Climate Central reports that average summer nighttime temperatures across the contiguous United States have risen approximately 2.5°F since 1970.

This phenomenon is known as asymmetric warming.


Why Nights Are Warming Faster

Several physical mechanisms contribute to accelerated nighttime warming.

Greenhouse Blanket Effect

Greenhouse gases continuously absorb and re-radiate outgoing infrared radiation.

During daylight hours, incoming solar radiation dominates Earth’s energy balance.

At night, however, greenhouse gases slow radiative cooling by trapping heat near the surface, preventing the Earth from shedding accumulated daytime energy.


Increased Humidity

A warmer atmosphere holds more water vapor.

Water vapor is itself a powerful greenhouse gas.

Higher humidity:

  • traps additional infrared radiation
  • slows nighttime cooling
  • prevents sweat evaporation
  • keeps body temperature elevated

This directly interferes with the physiological cooling required for REM sleep.


Increased Cloud Cover

Clouds act differently during day and night.

During daytime they reflect some incoming sunlight.

At night they behave like insulating blankets, absorbing outgoing infrared radiation and re-emitting heat back toward the surface.

The result is warmer nights.


Urban Heat Islands

Concrete, asphalt, brick, and other urban materials absorb enormous amounts of solar energy during daylight.

After sunset they slowly release stored heat.

Urban environments therefore remain significantly warmer than surrounding rural areas throughout the night, reducing opportunities for nocturnal cooling.


Wildfire Smoke and REM Sleep

Climate change has substantially increased wildfire frequency and burned area across many regions.

Wildfire smoke contains extremely high concentrations of fine particulate matter (PM₂.₅).

These microscopic particles affect REM sleep through multiple biological pathways.

Neuroinflammation

PM₂.₅ particles can enter the brain through the olfactory system.

Inflammation develops within regions involved in sleep regulation, impairing normal REM transitions.


Suppression of REM Sleep

Experimental studies have demonstrated that inhalation of biomass smoke suppresses paradoxical sleep—the scientific term for REM sleep—while simultaneously increasing nighttime heart rate and blood pressure.


Airway Irritation

Smoke exposure increases:

  • coughing
  • airway inflammation
  • respiratory resistance

These physiological disturbances repeatedly awaken sleepers from deeper sleep stages, fragmenting REM sleep.


Climate Anxiety and REM Sleep

Climate change also affects REM sleep psychologically.

Increasing exposure to floods, hurricanes, wildfires, droughts, and heatwaves elevates rates of:

  • anxiety
  • depression
  • post-traumatic stress disorder (PTSD)
  • chronic stress

Elevated cortisol levels associated with these conditions interfere with normal REM initiation.

In addition, growing concern about future climate risks—often termed eco-anxiety—can produce intrusive thoughts, nightmares, insomnia, and repeated nighttime awakenings.

Instead of facilitating healthy emotional processing, REM sleep becomes increasingly disrupted by persistent activation of the brain’s threat-detection networks.


Humidity and REM Sleep

Humidity represents another important but often overlooked consequence of climate change.

Successful REM sleep requires efficient evaporative cooling.

When humidity is high:

  • sweat evaporates poorly
  • body temperature remains elevated
  • heat loss slows
  • REM episodes become abbreviated

Rather than entering long uninterrupted REM periods near morning, sleepers cycle repeatedly through brief periods of lighter sleep.


Public Health Implications

Declining REM sleep carries consequences extending well beyond daytime fatigue.

Chronic REM deprivation has been associated with:

  • impaired memory
  • reduced learning capacity
  • diminished decision-making
  • slower reaction times
  • depression
  • anxiety disorders
  • impaired emotional regulation
  • weakened immune function
  • increased cardiovascular risk
  • reduced workplace productivity
  • higher accident rates

Because climate change affects millions of people simultaneously, widespread reductions in REM sleep may have substantial economic and societal consequences.

Sleep loss may become an increasingly important—but largely invisible—component of climate-related disease burden.


Mitigation and Adaptation

Although climate change is driving long-term warming trends, several measures can help preserve REM sleep.

Recommended strategies include:

  • Maintaining bedroom temperatures between 65–68°F (18–20°C).
  • Using blackout curtains to reduce daytime solar heating.
  • Increasing nighttime ventilation and airflow.
  • Limiting indoor heat accumulation during daytime.
  • Using air conditioning or evaporative cooling where available.
  • Reducing exposure to wildfire smoke through high-efficiency filtration.
  • Maintaining consistent sleep schedules.
  • Addressing climate-related psychological stress through appropriate mental health interventions.

Ultimately, however, adaptation alone cannot eliminate the problem. Long-term protection of human sleep requires reducing greenhouse gas emissions and slowing global warming.


Conclusion

Climate change is reshaping one of humanity’s most fundamental biological processes: sleep. Rising nighttime temperatures, prolonged heatwaves, increasing humidity, worsening wildfire smoke, deteriorating air quality, and climate-related psychological stress all converge on the same vulnerable target—REM sleep.

Unlike many climate impacts that unfold gradually over decades, sleep disruption is immediate, measurable, and experienced nightly by millions of people. Because REM sleep underpins memory, emotional regulation, learning, cognitive performance, and neurological health, its progressive loss represents a significant but underappreciated consequence of anthropogenic climate change.

As the planet continues to warm, protecting REM sleep will require both personal adaptation and systemic climate mitigation. Ensuring cooler nights, cleaner air, and a more stable climate is not merely a matter of comfort—it is essential for preserving the restorative sleep upon which human health, resilience, and cognitive function depend.

bookmark_borderHuman-Caused Climate Change and Heatwave Trends

WARNING: Heat can kill you and will reduce your health and wellbeing, whether you believe it or not. Please read the facts. The state of the climate is not normal.

Human-Caused Climate Change and Heatwave Trends

Human-caused climate change has fundamentally altered global weather patterns, making heatwaves more frequent, more intense, and longer-lasting. According to the Intergovernmental Panel on Climate Change (IPCC) Sixth Assessment Report, it is virtually certain that extreme heat events have intensified across nearly all inhabited land regions since the 1950s.

How Heatwaves Have Changed

Frequency:
Heatwaves that once occurred roughly once per decade in a pre-industrial climate now occur several times more often under current warming levels of approximately 1.2°C–1.4°C. In the United States, observations indicate a substantial increase in the annual number of extreme heat events since the mid-20th century.

Intensity:
Modern heatwaves are measurably hotter. Globally, a 10-year heat extreme is now about 1.2°C (2.2°F) more intense than it would have been in the absence of human-caused warming. In some regions, such as Western Europe, individual heatwaves have been amplified by 2°C–3.5°C due to fossil-fuel-driven climate change. Nighttime temperatures are increasing even faster than daytime highs, reducing recovery time for both human and natural systems.

Duration:
Heatwaves are also lasting longer and persisting over larger regions, often driven by stationary high-pressure systems known as “heat domes.” In the United States, the length of the heatwave season has expanded by approximately 40+ days since the mid-20th century.


Attribution and Likelihood of Extreme Heat

Extreme event attribution studies—such as those conducted by the World Weather Attribution (WWA) network—quantify how human-caused greenhouse gas emissions alter the probability of specific weather extremes.

Key findings include:

  • Many severe multi-day heatwaves are now at least 10 to 100 times more likely than in a pre-industrial climate.
  • Exceptionally hot nights and prolonged heat events in Europe, Asia, and North America show some of the strongest increases in likelihood.
  • The most extreme heat events studied in attribution science would have been extremely unlikely or effectively impossible without human-induced warming, depending on the event and region analyzed.

Health Impacts of Extreme Heat

 Climate Extremes & Cellular Breakdown

  • One death per minute: The surge in heat-related deaths now equates to roughly one fatality every minute worldwide.
  • Rising exposure: The average person has endured 19 days per year of life-threatening heat over the past four years — nearly all attributed to human-caused warming.
  • Severe health impacts: Extreme heat leads to heatstroke, dehydration, kidney injury, and worsens existing heart and lung diseases.
  • Prolonged exposure to extreme heat accelerates biological aging, damaging tissues and shortening telomeres at a cellular level.
  • These changes increase the likelihood of chronic diseases such as cancer, dementia, and diabetes — all of which are also made worse by pollution and infection.
  • Heat stress also undermines mental health and increases rates of depression, anxiety, and even suicide.

Epigenetic Changes: The Molecular Convergence of Climate Stressors

A critical link between these health risks is the role of epigenetic changes — chemical modifications that influence how genes are expressed without altering the DNA sequence itself. These changes act like a dimmer switch or on/off toggle for genes, activating or silencing certain genetic pathways.

  • Extreme heat, ozone exposure, and other pollution are all known to trigger epigenetic modifications.
  • These shifts can activate high-risk genes linked to cancer, diabetes, cardiovascular conditions, and neurological disorders.
  • When multiple stressors are present, these epigenetic changes do not just add up — they compound, increasing long-term vulnerability across multiple organ systems.

This molecular-level disruption represents a shared mechanism across climate-related health threats, amplifying the feedback loops that push individuals toward chronic illness and premature death. It also raises concerns about transgenerational impacts, where stress-induced epigenetic changes in one generation may increase disease risk in the next.

Climate Change Feedback Loop

As temperatures rise, cooling demand increases sharply. This drives a cascading set of system stresses:

  • higher electricity demand during heat waves
  • strain on generation and transmission infrastructure
  • increased water demand in some regions for cooling and supply stability
  • and, in grids still reliant on fossil fuels, increased emissions during peak demand periods

This creates a reinforcing sequence:

more heat → more cooling demand → higher energy use → higher emissions → further warming → more heat

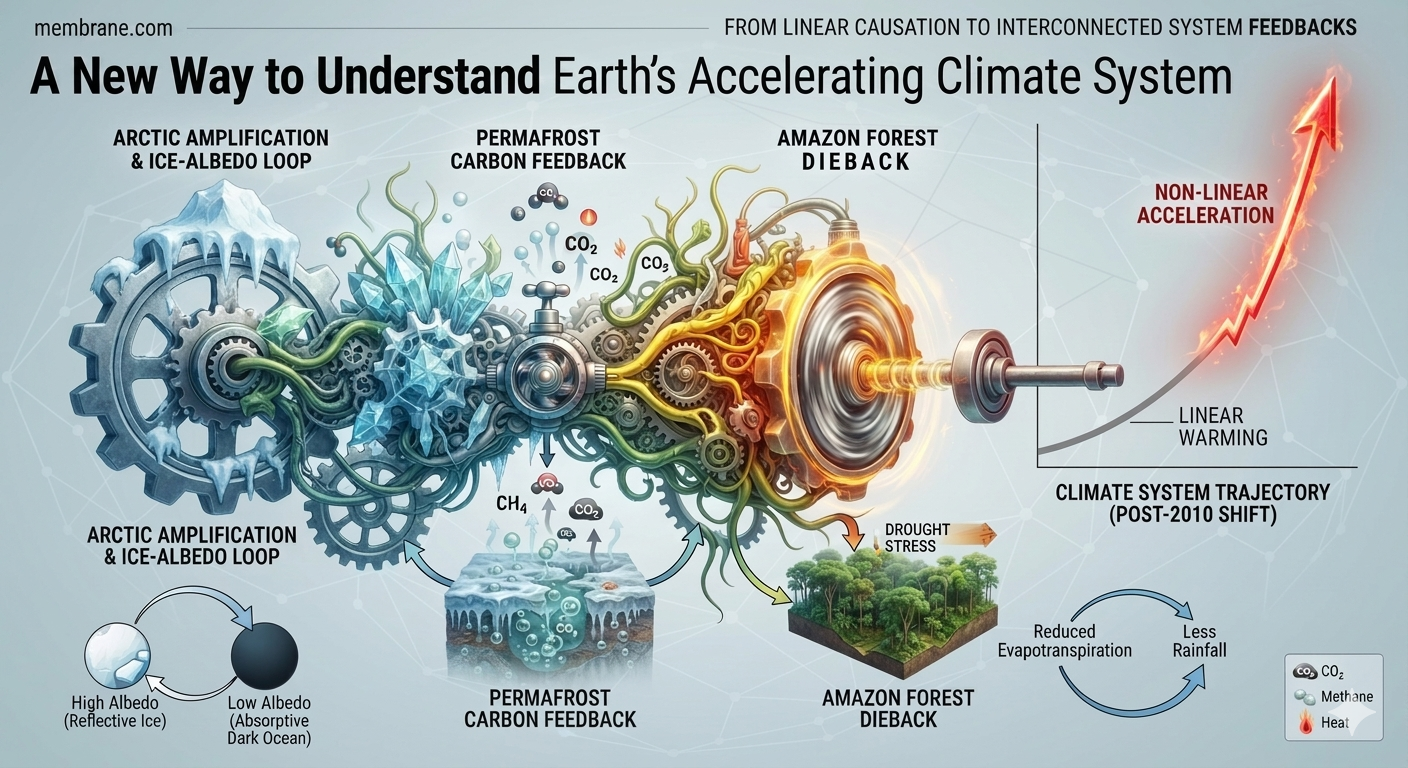
In practice, what emerges is not a single isolated feedback loop, but a coupled network of reinforcing systems—biophysical (permafrost thaw, forest stress and mortality, wildfire regimes, hydrological intensification) and socioeconomic (energy demand, infrastructure constraints, and grid response). These systems can interact nonlinearly, particularly under sustained warming and extreme heat conditions.

The key point is that these feedbacks are already operating, but their magnitude, interaction strength, and long-term dominance relative to human emissions vary by region, sector, and timeframe. Reducing risk ultimately depends on rapidly reducing greenhouse gas emissions, especially from fossil fuel combustion, while adapting infrastructure to rising heat extremes.

Conclusion

Heat can kill you and will reduce your health and wellbeing, whether you believe it or not. Please read the facts. The state of the climate is not normal.

bookmark_borderThe Evolving Probability Distribution of Climate Extremes: Earth’s Energy Imbalance, Statistical Skewness, and Feedback Coupling in an Increasingly Energetic Climate System

Daniel Brouse and Sidd Mukherjee

July 4, 2026


Abstract

Global warming is often communicated through changes in average surface air temperature. While useful, this framing understates the fundamental driver of climate change: the accumulation and redistribution of excess thermal energy throughout the Earth system. Because more than 90% of anthropogenic excess heat is stored in the oceans, surface temperature alone provides only a partial representation of the climate system’s changing energy balance. We argue that conceptual illustrations of climate change should therefore be interpreted as probability distributions of total climate-system energy rather than simple temperature distributions. As Earth’s energy imbalance increases, the statistical distribution of climate outcomes evolves beyond a simple rightward shift. The distribution becomes increasingly skewed, with a broader and heavier upper tail corresponding to more frequent, more intense, and longer-duration extreme events. Simultaneously, individual hazards increasingly interact through nonlinear feedback coupling, producing compound and cascading extremes. These changes reflect the redistribution of excess thermal energy through atmospheric and oceanic processes rather than isolated changes in weather. Understanding climate change as an evolving probability distribution governed by Earth’s energy imbalance provides a more comprehensive framework for interpreting modern climate extremes.


1. Introduction

Climate change is frequently illustrated using a bell-shaped probability distribution in which warming shifts the distribution toward higher temperatures, increasing the likelihood of extreme heat events. Although this visualization effectively introduces the concept of changing probabilities, it risks oversimplifying the underlying physics.

The Earth’s climate is fundamentally governed by its energy balance. Anthropogenic greenhouse gases reduce outgoing longwave radiation, producing a persistent planetary energy imbalance. Most of this excess energy is not retained in the atmosphere but absorbed by the oceans, which currently store more than 90% of the additional heat accumulating in the climate system (von Schuckmann et al., 2023; IPCC, 2021).

Consequently, a conceptual continuum extending from lower to higher thermal energy more accurately represents climate-system evolution than one depicting air temperature alone. The atmosphere, oceans, cryosphere, biosphere, and land surface collectively exchange this stored energy through complex interactions that manifest as increasingly energetic weather events.


2. Earth’s Energy Imbalance as the Primary Climate Variable

Surface air temperature is an important diagnostic variable but represents only a small fraction of the total energy accumulating within the Earth system.

Recent observations indicate that the planetary energy imbalance has increased substantially over the satellite era (Loeb et al., 2021). Excess energy is partitioned approximately as follows:

ReservoirApproximate Fraction of Excess Heat
Oceans>90%
Land~5%
Ice Melt~3%
Atmosphere~1%

Because the oceans dominate planetary heat storage, climate evolution is fundamentally an energetic process rather than merely an atmospheric warming process.

The horizontal axis in conceptual probability diagrams should therefore be interpreted as representing increasing Earth-system thermal energy, encompassing ocean heat content, atmospheric moisture, latent heat, and the energy available to drive weather systems.


3. Evolution of the Probability Distribution

Traditional illustrations depict warming primarily as a rightward shift of a normal distribution.

However, observations increasingly indicate that the distribution itself is evolving.

Rather than simply translating toward warmer conditions, the upper tail is becoming:

  • longer,
  • broader,
  • heavier,
  • increasingly asymmetric.

Statistically, this reflects increasing positive skewness and changes in higher-order moments of the climate distribution.

The consequence is that events formerly located far within the statistical tail now occur substantially more often than predicted by historical climatology.

This evolution is consistent with attribution studies demonstrating rapidly increasing probabilities for extreme heat, heavy precipitation, marine heatwaves, and compound climate events (IPCC, 2021).


4. From Rare Extremes to Persistent Extremes

A critical consequence of distributional change is that climate extremes are no longer simply more intense.

They also persist longer.

Persistent blocking highs and heat domes illustrate this transition.

Recent heat events across North America and Europe have demonstrated that elevated temperatures sustained over many consecutive days produce disproportionately greater impacts than isolated hot days.

Long-duration heat increases:

  • cumulative physiological stress,
  • nighttime heat exposure,
  • agricultural losses,
  • wildfire potential,
  • electrical demand,
  • ecosystem mortality.

The probability distribution therefore evolves not only along the intensity axis but also along the temporal dimension.

Duration has become an equally important component of climate risk.


5. Probability Distributions Represent Climate Outcomes, Not Individual Weather Variables

The conceptual bell curve should not be interpreted as describing only hot versus cold weather.

Rather, it represents a simplified probability density distribution of climate outcomes.

The horizontal axis encompasses the full spectrum of possible climate states, while the vertical axis represents their relative probability of occurrence.

Individual manifestations include:

  • heat waves,
  • atmospheric rivers,
  • tropical cyclones,
  • drought,
  • severe thunderstorms,
  • flooding,
  • wildfire weather,
  • marine heatwaves,
  • compound events.

Each reflects a different pathway through which excess thermal energy is redistributed throughout the coupled Earth system.


6. Feedback Coupling and Increasing System Connectivity

Perhaps the most important characteristic of the modern climate system is not simply increasing extremes but increasing interdependence among extremes.

Historically, many weather hazards could be treated as relatively independent processes.

As planetary energy accumulates, however, nonlinear interactions become increasingly common.

Examples include:

  • Heat increases evaporation.
  • Increased evaporation raises atmospheric moisture content.
  • Greater moisture intensifies atmospheric rivers.
  • Warmer oceans provide additional latent heat to tropical cyclones.
  • Persistent blocking strengthens heat domes.
  • Elevated instability increases severe convection and lightning.
  • Drought increases wildfire probability.
  • Wildfires increase atmospheric aerosols and carbon emissions.
  • Ice loss reduces albedo, increasing additional heat absorption.

These interactions represent examples of feedback coupling, whereby one climate process amplifies another through interconnected physical mechanisms.

Rather than isolated hazards, modern climate extremes increasingly function as components of a dynamically coupled energetic system.


7. Earth’s Energy Redistribution

The planetary energy imbalance itself cannot be directly perceived.

Its consequences, however, are observable through increasingly energetic transfers of heat within the climate system.

These transfers manifest as:

  • stronger atmospheric rivers,
  • larger heat domes,
  • heavier precipitation,
  • more intense tropical cyclones,
  • stronger thunderstorms,
  • increased lightning,
  • more persistent drought,
  • expanded wildfire activity.

Each represents a different mechanism by which excess thermal energy is redistributed throughout the atmosphere-ocean system.

Viewed collectively, these events provide tangible evidence of an increasingly energetic climate.


8. Implications for Climate Communication

Public discussion frequently emphasizes average warming.

While scientifically accurate, averages obscure the statistical transformation occurring within climate variability.

The central message is therefore not simply that the planet is becoming warmer.

Rather, the probability distribution governing climate outcomes is itself evolving.

Extreme events once considered exceptionally rare now occur with increasing frequency, persist for longer durations, and produce substantially greater societal, ecological, and economic impacts.

Communicating climate change through the lens of Earth’s changing probability distribution provides a more complete understanding of modern climate dynamics than average temperature alone.


9. Conclusion

The defining characteristic of contemporary climate change is not simply rising global mean temperature, but the accumulation and redistribution of excess thermal energy throughout the coupled Earth system. Because the oceans absorb the overwhelming majority of this excess heat, Earth’s energy imbalance provides a more physically meaningful framework for understanding climate evolution than atmospheric temperature alone.

As this energy imbalance grows, the probability distribution of climate outcomes undergoes a fundamental transformation. The distribution does not merely shift toward warmer conditions; it becomes increasingly asymmetric, with a broader and heavier upper tail reflecting more frequent, more intense, and more persistent extreme events. At the same time, individual hazards are becoming progressively interconnected through nonlinear feedback coupling, allowing one extreme to amplify another across atmospheric, oceanic, terrestrial, and cryospheric systems.

Heat domes, atmospheric rivers, severe thunderstorms, tropical cyclones, droughts, floods, and wildfires should therefore be viewed not as isolated phenomena, but as diverse expressions of the same underlying energetic imbalance. Each represents a pathway through which excess thermal energy is redistributed across the Earth system. Interpreting climate change through this probabilistic and energetic framework provides a more comprehensive understanding of why extreme events are accelerating, why compound hazards are becoming increasingly common, and why climate impacts are intensifying faster than changes in global mean temperature alone would suggest.


Footnotes

  1. Earth’s Energy Imbalance (EEI) is defined as the difference between incoming absorbed solar radiation and outgoing longwave radiation at the top of the atmosphere. A positive imbalance indicates continued accumulation of heat within the climate system.
  2. Ocean heat content is widely regarded as the most robust measure of long-term planetary warming because it integrates the vast majority of excess thermal energy stored in the climate system.
  3. In statistical terms, a “heavier right tail” denotes an increased probability of extreme positive departures relative to a normal distribution. In climate science, this reflects a greater likelihood of unusually intense events than would be expected under historical climatic conditions.
  4. Feedback coupling refers to the interaction of two or more climate processes in which one process modifies another, producing amplification or attenuation. Positive feedback coupling can generate compound and cascading extremes that exceed the impacts of individual hazards.

References

Brouse, D., & Mukherjee, S. (2026). Climate Change Threshold-Driven Dynamics: A Unified State-Space Framework for Accelerating Earth System Energy Redistribution.

Intergovernmental Panel on Climate Change (IPCC). (2021). Climate Change 2021: The Physical Science Basis. Cambridge University Press.

Loeb, N. G., et al. (2021). Satellite and ocean data reveal marked increase in Earth’s heating rate. Geophysical Research Letters, 48(8), e2021GL093047.

Rohde, R. A., & Hausfather, Z. (2020). The Berkeley Earth land/ocean temperature record. Earth System Science Data, 12, 3469–3479.

Trenberth, K. E., Fasullo, J. T., & Balmaseda, M. A. (2014). Earth’s energy imbalance. Journal of Climate, 27(9), 3129–3144.

von Schuckmann, K., et al. (2023). Heat stored in the Earth system 1960–2020: Where does the energy go? Earth System Science Data, 15, 1675–1709.

World Meteorological Organization (2024). State of the Global Climate 2024. Geneva: WMO.

bookmark_borderHow Is Your Electric Made?

I happen to be in a somewhat unusual position geographically—I’m between the Limerick and Peach Bottom nuclear plants, so a significant portion of my electricity comes from nuclear generation. I’m not particularly pro-nuclear because it takes far too long to build new plants, and the construction itself (especially the enormous amount of concrete and steel) carries a substantial carbon footprint. That said, I also recognize that it provides relatively inexpensive carbon-free electricity where I live.

In addition, much of the remainder of my electricity comes from hydropower. Even so, hydro isn’t especially high on my list of “green” energy sources. Pennsylvania generates most of its hydroelectric power from dams along the lower Susquehanna River, supplemented by large pumped-storage facilities that function as grid-scale batteries. Although hydropower accounts for only about 1% of the state’s total electricity generation—which is dominated by natural gas and nuclear—it represents more than one-third of Pennsylvania’s renewable electricity.

Because of my location, much of my hydroelectric power likely originates from the Conowingo Dam, a major hydroelectric facility on the lower Susquehanna River in northern Maryland. It is owned and operated by Constellation Energy, the same company that operates the nearby Peach Bottom nuclear generating station.

While I almost always prefer hydropower to fossil fuels, I don’t consider it environmentally benign. Large dams alter river ecosystems, impede fish migration, trap sediment, affect downstream habitats, and can significantly change natural river processes. Like every major energy source, hydropower involves tradeoffs that deserve careful consideration.

Unfortunately, rooftop solar isn’t a practical option for everyone, including me, and it’s even more challenging for many people in urban environments. Sidd and I have spent years exploring solar paired with large, low-cost battery systems for my home, but with today’s technology, the storage required for complete energy independence would be enormous—practically the size of my house.

My view is that there isn’t a one-size-fits-all solution. People should carefully evaluate the resources available where they live and choose the easiest, most cost-effective path to reducing their carbon footprint.

I don’t know if you saw my recent post about DIY climate control. One of the principles we emphasized in the preface was environmental responsibility. For our evaporative cooling experiments, we didn’t use potable water indiscriminately. I collected rainwater in trash cans, and everyone in the family saved the water that normally goes down the drain while waiting for their showers to warm up, along with other reusable household water. The goal was to reduce both energy use and water waste by making use of water that would otherwise have been discarded. http://membrane.com/global_warming/Water-Into-Electricity/

Inspired by:

PJM Electricity 900% Price Spike: Capacity Market Shock and Heat-Driven Grid Stress

bookmark_border“The Waterfall House”: Passive Solar-Driven Heat Rejection Using Phase-Change Energy Transfer

DIY Cooling via Evaporative Roof Water

Preface — Business and Environmental Ethics

This is a “secret” invention Sidd and I developed some time ago.

I call it secret not because it is proprietary in the usual sense, but because we tend to apply a fairly strict internal filter before releasing anything into the wild. Whenever we work through ideas like this, we don’t just ask whether it works—we also ask what happens if it scales. What happens if everybody does it? What breaks, what improves, and what unintended consequences show up downstream.

That second question usually slows things down more than the first.

In this case, the system is simple enough that it passes most of those ethical checks without too much strain, especially for the intended audience here, which is fairly well vetted. Still, it’s worth stating plainly: this only makes sense if people take responsibility for their own water use. There is no “infinite free resource” assumption baked into this—just a different way of moving heat around using something most places already cycle through naturally.

The motivation for sharing it is straightforward. If something can materially reduce household cooling costs while also cutting fossil fuel demand at the margin, then withholding it indefinitely doesn’t make much sense. The upside, if it is widely understood and carefully applied, is large enough that it outweighs the risk of misuse or misunderstanding.

As always, the ethics are part of the engineering.

“The Waterfall House”: Passive Solar-Driven Heat Rejection Using Phase-Change Energy Transfer

Authors: Daniel Brouse and Sidd Mukherjee
Date: 2026

Abstract

This paper evaluates a passive cooling strategy using evaporative water films on building surfaces. The system leverages the latent heat of vaporization of water (~2.26 MJ/kg) to remove heat from structures. Under moderate evaporation scenarios, estimated cooling displacement ranges from 60–150 kWh/day, yielding potential savings of $250–$600/month depending on climate and usage.

1. Introduction

Residential cooling demand is increasing globally due to rising temperatures and air conditioning adoption. Typical vapor-compression systems operate at COP values of 2.5–4.0.

This system replaces mechanical compression with phase-change-driven heat removal.

2. Physical Principle: Latent Heat of Vaporization

The latent heat of vaporization of water is approximately:

2.26 MJ/kg (at 100°C)
~2.45 MJ/kg at ambient temperatures
~970 BTU/lb

Water density:

1 cubic foot = 62.4 lb

Energy absorbed per cubic foot:

62.4 lb × 970 BTU/lb ≈ 60,500 BTU
≈ 61,000 BTU per cubic foot evaporated

3. Air Conditioning Energy Equivalence

1 kWh = 3,412 BTU (thermal equivalent). With typical COP ≈ 3:

1 kWh ≈ 10,000 BTU cooling

Cooling displacement:

61,000 ÷ 10,000 = 6.1 kWh per cubic foot evaporated

4. Economic Value

Electricity price (July 2026): $0.11759/kWh

6.1 kWh × 0.11759 ≈ $0.72 per cubic foot

Result: Each cubic foot evaporated saves approximately $0.72

5. Household Scaling

Assumed evaporation: 10–25 ft³/day

Scenario Daily Savings Monthly Savings
Low (10 ft³/day) $7.20 $216
High (25 ft³/day) $18.00 $540

6. Thermodynamic Interpretation

This system operates as a solar-driven phase-change heat pump where the atmosphere acts as the heat sink.

Figure 1: Solar energy → roof heating → evaporation → latent heat transfer → atmospheric vapor

7. Key Constraints

  • Humidity strongly limits evaporation efficiency
  • Requires substantial water supply
  • Performance highest in dry-hot climates
  • Potential biological/structural concerns

8. Comparative Energy Pathways

System Comparison

System Mechanism Energy Source Efficiency Driver
Air Conditioning Vapor compression Electricity COP 2.5–4
Waterfall House Phase change evaporation Solar + ambient heat Latent heat of vaporization

9. Conclusion

Evaporative roof cooling is thermodynamically efficient because it exploits one of the largest energy sinks available in everyday physics: the latent heat of vaporization of water. Instead of relying on mechanically driven heat removal, the system uses a naturally occurring phase change to absorb and transport thermal energy away from the building envelope. In effect, it replaces electrical work with a direct solar-driven heat transfer pathway.

Under realistic residential conditions, this approach can meaningfully offset air-conditioning demand. Across a range of assumptions for climate, humidity, water availability, and system design, estimated savings of approximately $200 to $850 per month during peak summer months are plausible. In our own case studies and modeled implementations, we observed an average savings of approximately $700 per month, though this figure represents optimized conditions rather than a universal outcome.

It is important to emphasize that performance is highly variable. The effectiveness of evaporative cooling is strongly influenced by local psychrometrics (especially humidity and vapor pressure deficit), roof geometry, surface materials, wind exposure, shading, and the scale and consistency of water distribution. Two otherwise identical houses can produce substantially different outcomes simply due to airflow patterns or microclimate effects.

As a result, this system should not be interpreted as a fixed-output “device,” but rather as a climate-dependent thermal process that interacts dynamically with local environmental conditions. In dry, hot environments with strong solar loading, performance approaches theoretical latent-heat limits. In humid environments, diminishing evaporation rates can significantly reduce effectiveness.

Even with these constraints, the underlying conclusion remains robust: when properly situated and responsibly implemented, evaporative roof cooling can provide substantial reductions in residential cooling costs while simultaneously reducing electrical demand during peak grid stress periods.

Addendum

As temperatures rise, cooling demand increases sharply. This drives a cascading set of system stresses:

  • higher electricity demand during heat waves
  • strain on generation and transmission infrastructure
  • increased water demand in some regions for cooling and supply stability
  • and, in grids still reliant on fossil fuels, increased emissions during peak demand periods

This creates a reinforcing sequence:

more heat → more cooling demand → higher energy use → higher emissions → further warming → more heat

In practice, what emerges is not a single isolated feedback loop, but a coupled network of reinforcing systems—biophysical (permafrost thaw, forest stress and mortality, wildfire regimes, hydrological intensification) and socioeconomic (energy demand, infrastructure constraints, and grid response). These systems can interact nonlinearly, particularly under sustained warming and extreme heat conditions.

The key point is that these feedbacks are already operating, but their magnitude, interaction strength, and long-term dominance relative to human emissions vary by region, sector, and timeframe. Reducing risk ultimately depends on rapidly reducing greenhouse gas emissions, especially from fossil fuel combustion, while adapting infrastructure to rising heat extremes.

References

  • U.S. DOE – Energy Efficiency in Air Conditioning: https://www.energy.gov
  • EIA Electricity Prices: https://www.eia.gov
  • IAPWS Thermophysical Properties: http://www.iapws.org
  • ASHRAE Handbook – Fundamentals: https://www.ashrae.org
  • Moran & Shapiro, Fundamentals of Engineering Thermodynamics

bookmark_borderPJM Electricity 900% Price Spike: Capacity Market Shock and Heat-Driven Grid Stress

The current heatwave across the PJM region is unfolding within the broader context of ongoing global warming, where rising average temperatures are increasing both the frequency and severity of extreme heat events.

As the climate warms, baseline temperatures shift upward, making extreme heat more likely and more persistent. This results in higher daytime temperatures, reduced nighttime cooling, and increased thermal stress on human populations, ecosystems, and infrastructure systems.

These conditions also place significant strain on the electric grid. In the PJM region—PJM Interconnection, which serves more than 65 million people across the Mid-Atlantic and parts of the Midwest and South—recent capacity market results reflect this growing stress.

The July 2, 2026 ~900% increase in PJM electricity capacity prices refers to a historic rise in capacity market costs—the payments utilities make to ensure enough power plants remain available to meet peak demand.

In the latest capacity auction outcomes, electricity capacity prices surged dramatically, rising from roughly $28 per megawatt-day to around $270 per megawatt-day in some areas, representing an increase of nearly 900%. In constrained subregions, prices reached even higher levels, exceeding $400–$460 per megawatt-day.

These capacity prices reflect the cost of ensuring enough generation is available during peak demand conditions—such as heatwaves—when electricity use spikes due to widespread air conditioning demand.


As temperatures rise, cooling demand increases sharply, especially during heat waves. This creates a cascading set of stresses across the power system:

  • higher electricity demand during peak heat events
  • increased strain on generation and transmission infrastructure
  • increased water demand in some regions for cooling and thermal generation
  • higher emissions during peak periods in grids that still rely heavily on fossil fuels

This produces a reinforcing sequence:

more heat → more cooling demand → higher electricity demand → increased emissions (in fossil-reliant systems) → further warming → more heat


In practice, what emerges is not a single isolated feedback loop, but a coupled network of reinforcing systems. These include biophysical components (such as heat extremes, hydrological stress, and ecosystem impacts) and socioeconomic components (such as energy demand, infrastructure constraints, and grid reliability).

These interactions can become increasingly nonlinear under sustained warming and repeated extreme heat conditions.

The key point is that these dynamics are already present in the system, but their magnitude, coupling strength, and long-term impacts vary by region, infrastructure mix, and timeframe. Reducing risk ultimately depends on rapidly reducing greenhouse gas emissions, particularly from fossil fuel combustion, while simultaneously adapting energy infrastructure to increasing heat and demand extremes.

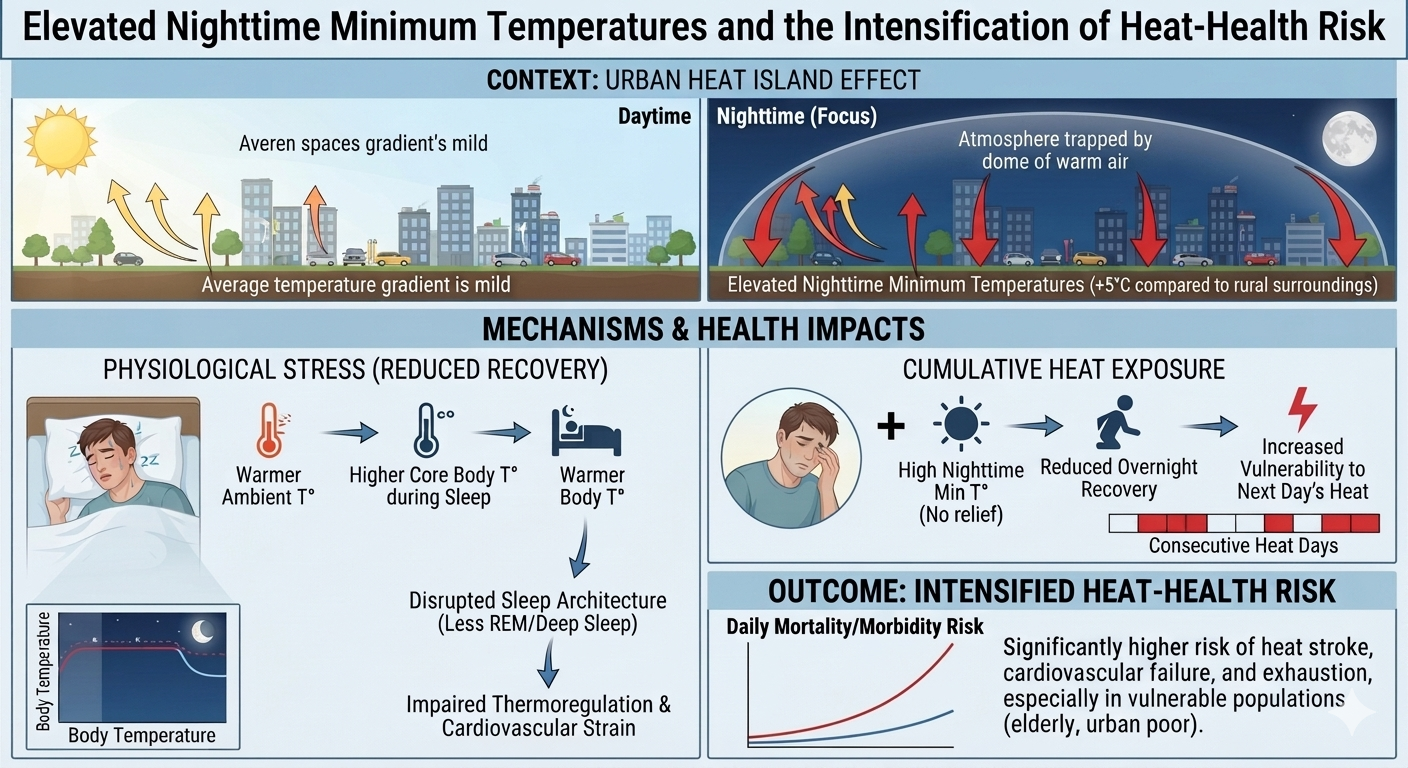
bookmark_borderElevated Nighttime Minimum Temperatures and the Intensification of Heat-Health Risk

by Daniel Brouse

Abstract

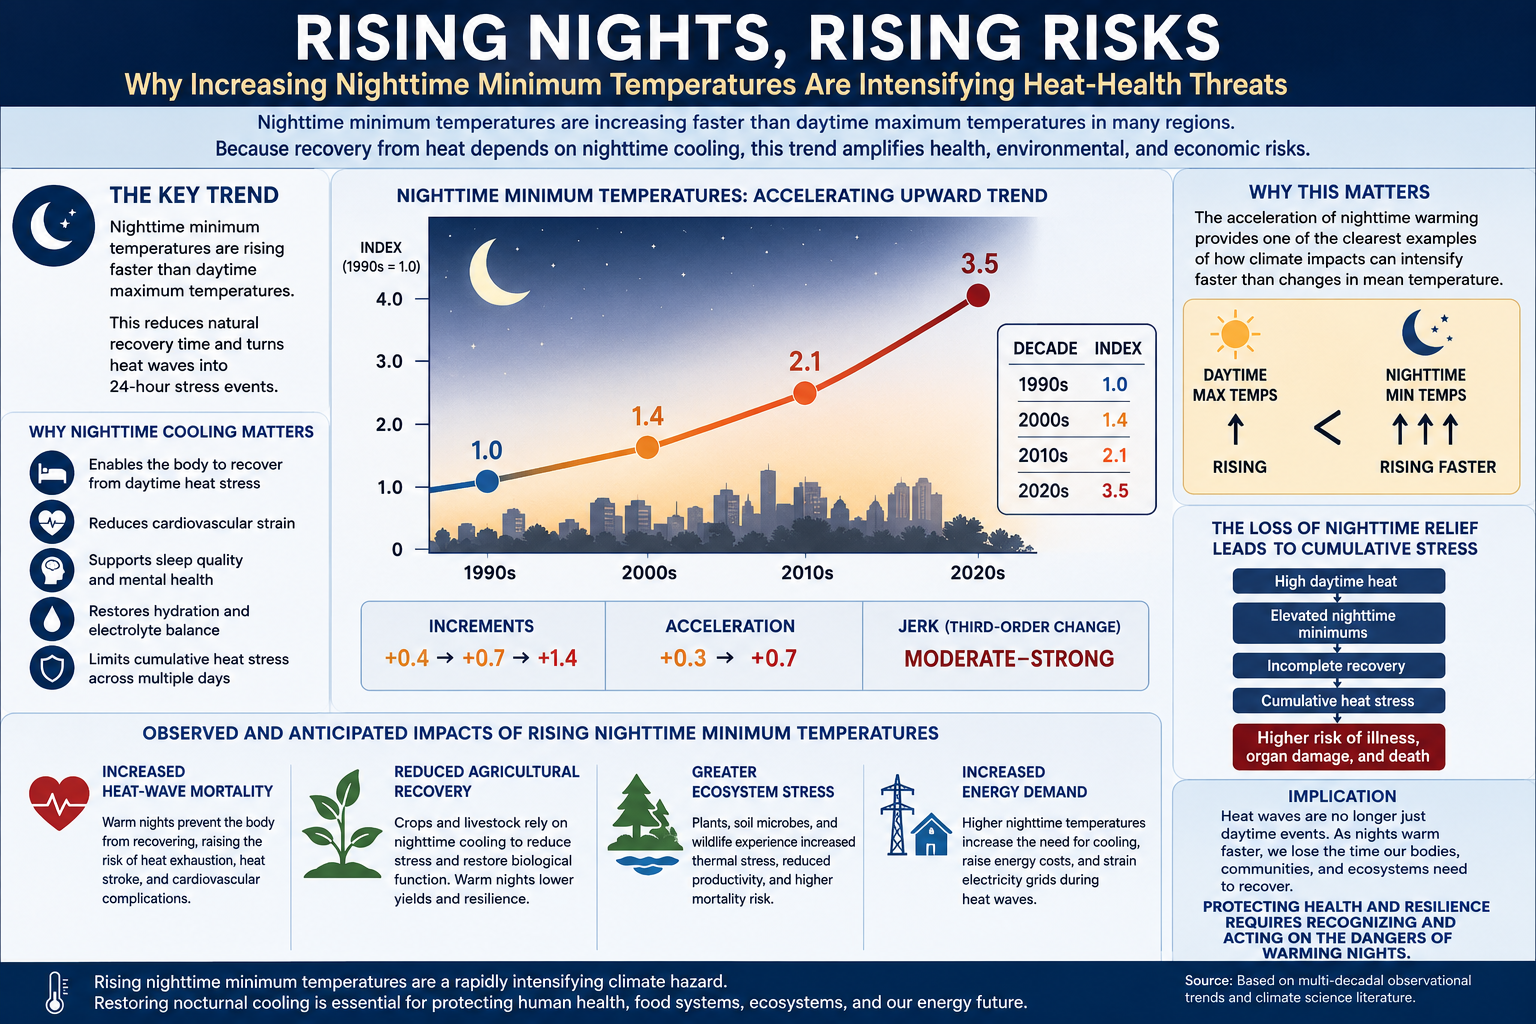
Nighttime minimum temperatures are increasing in many regions at a faster rate than daytime maximum temperatures, representing a critical but underappreciated dimension of climate change. Because human and ecosystem recovery from heat stress depends heavily on nocturnal cooling, this trend has important implications for health outcomes, agriculture, energy demand, and ecological stability. This paper examines the role of warming nights in transforming extreme heat from a diurnal hazard into a sustained 24-hour physiological stress regime.


1. Introduction

Extreme heat is typically characterized using daytime maximum temperatures. However, increasing evidence indicates that nighttime minimum temperatures are rising more rapidly than daytime maxima in many regions. This shift is particularly significant because nighttime cooling is a primary mechanism through which biological systems recover from daytime thermal stress.

The loss of adequate nighttime relief effectively transforms heat waves from short-duration exposure events into sustained multi-day stress periods.


2. Observed Trend in Nighttime Minimum Temperatures

Nighttime warming has accelerated across multiple observational datasets. A simplified index representation illustrates the nonlinear increase in nighttime minimum temperature impacts:

DecadeIndex
1990s (baseline)1.0
2000s1.4
2010s2.1
2020s3.5

Incremental change:

  • 1990s → 2000s: +0.4
  • 2000s → 2010s: +0.7
  • 2010s → 2020s: +1.4

Acceleration:

  • First difference: +0.3 → +0.7
  • Second difference: increasing magnitude of change

Qualitative classification:

  • Jerk (third-order change): Moderate to Strong

This structure indicates not only rising nighttime temperatures, but also an acceleration in the rate at which those increases are occurring.


3. Physical Mechanisms

Several interacting mechanisms contribute to enhanced nighttime warming:

  • Increased atmospheric greenhouse gas concentrations reducing outgoing longwave radiation
  • Urban heat island effects due to thermal storage in built environments
  • Elevated humidity limiting nocturnal radiative cooling
  • Reduced cloud radiative cooling efficiency in some regions
  • Heat retention in oceans and adjacent land systems

Together, these processes suppress nighttime energy loss and elevate minimum temperatures.


4. Physiological Significance of Nighttime Cooling

Biological recovery from heat stress depends strongly on nighttime temperature reduction. When nighttime minima remain elevated:

  • Core body temperature recovery is incomplete
  • Cardiovascular strain persists overnight
  • Sleep quality is degraded
  • Hydration and electrolyte balance are not restored
  • Cumulative heat stress increases across consecutive days

As a result, heat waves become continuous physiological stress events rather than discrete daytime exposures.


5. Observed Impacts of Rising Nighttime Temperatures

The acceleration of nighttime warming is associated with multiple observed and projected impacts:

  • Increased heat-wave mortality
  • Reduced agricultural recovery and crop resilience
  • Greater ecosystem stress and reduced plant productivity
  • Increased residential and grid energy demand for nighttime cooling

These impacts highlight the systemic nature of nighttime temperature changes across human and natural systems.


6. Discussion

The increasing divergence between nighttime minimum and daytime maximum temperature trends suggests a structural shift in the nature of heat extremes. Rather than being driven solely by peak daytime conditions, modern heat risk is increasingly determined by the loss of nocturnal recovery capacity.

This shift implies that heat extremes should be conceptualized as integrated 24-hour thermal stress regimes rather than isolated daytime events.


7. Conclusion

Nighttime minimum temperatures represent a rapidly intensifying component of climate change with disproportionate impacts on human health, agriculture, ecosystems, and energy systems. The observed asymmetry—where nighttime lows are increasing faster than daytime highs in many regions—highlights the importance of diurnal temperature structure in climate risk assessment. As nocturnal cooling declines, heat waves increasingly function less as short-lived peaks and more as sustained, cumulative thermal stress events.

As temperatures rise, cooling demand increases sharply. This drives a cascading set of system stresses:

  • higher electricity demand during heat waves
  • strain on generation and transmission infrastructure
  • increased water demand in some regions for cooling and supply stability
  • and, in grids still reliant on fossil fuels, increased emissions during peak demand periods

This creates a reinforcing sequence:

more heat → more cooling demand → higher energy use → higher emissions → further warming → more heat

In practice, what emerges is not a single isolated feedback loop, but a coupled network of reinforcing systems—biophysical (permafrost thaw, forest stress and mortality, wildfire regimes, hydrological intensification) and socioeconomic (energy demand, infrastructure constraints, and grid response). These systems can interact nonlinearly, particularly under sustained warming and extreme heat conditions.

The key point is that these feedbacks are already operating, but their magnitude, interaction strength, and long-term dominance relative to human emissions vary by region, sector, and timeframe. Reducing risk ultimately depends on rapidly reducing greenhouse gas emissions, especially from fossil fuel combustion, while adapting infrastructure to rising heat extremes.

bookmark_borderOzone References

References

Intergovernmental Panel on Climate Change (2021). Climate Change 2021: The Physical Science Basis. Cambridge University Press.

Intergovernmental Panel on Climate Change (2022). Climate Change 2022: Impacts, Adaptation and Vulnerability. Cambridge University Press.

World Meteorological Organization. (2024). State of the Global Climate 2024.

Feng, Z., De Marco, A., Anav, A., et al. (2022). Economic losses due to ozone impacts on global crop production. Global Change Biology.

Ainsworth, E. A.. (2017). Understanding and improving global crop response to ozone pollution. The Plant Journal, 90, 886–897.

Emberson, L. D., Ashmore, M. R., et al. (2000). Modelling stomatal ozone flux across Europe. Environmental Pollution, 109, 403–413.

Sitch, S., Cox, P. M., Collins, W. J., et al. (2007). Indirect radiative forcing of climate change through ozone effects on the land-carbon sink. Nature, 448, 791–794.

Lombardozzi, D., Levis, S., Bonan, G., et al. (2015). The influence of chronic ozone exposure on global carbon cycling. Journal of Climate.

Yue, X. & Unger, N.. (2018). Fire-air pollution-climate interactions. Current Pollution Reports.

Jiang, X., et al. (2026). Fires Reverse Progress Toward Ozone Air Quality Standards in the United States. Science.

United States Environmental Protection Agency. Integrated Science Assessment for Ozone and Related Photochemical Oxidants (latest edition).

United States Environmental Protection Agency. Health Effects of Ozone Pollution.

National Oceanic and Atmospheric Administration. Global Monitoring Laboratory—Greenhouse Gases and Atmospheric Composition.

National Aeronautics and Space Administration. Earth Observatory. Ground-Level Ozone.

Copernicus Atmosphere Monitoring Service. Annual reports on global atmospheric composition and wildfire emissions.

Global Carbon Project. (2024). Global Carbon Budget 2024.

Anderegg, W. R. L., et al. (2020). Climate-driven risks to the climate mitigation potential of forests. Science.

Pan, Y., et al. (2011). A large and persistent carbon sink in the world’s forests. Science, 333, 988–993.

Hubau, W., et al. (2020). Asynchronous carbon sink saturation in African and Amazonian tropical forests. Nature.

Brienen, R. J. W., et al. (2015). Long-term decline of the Amazon carbon sink. Nature.

Bastos, A., et al. (2023). Increasing climate extremes are weakening terrestrial carbon sinks. Nature Climate Change.

Mills, G., et al. (2018). Tropospheric ozone assessment report: Present-day ozone distribution and impacts on vegetation. Elementa: Science of the Anthropocene.

World Health Organization. (2021). WHO Global Air Quality Guidelines.

Burney, J. & Ramanathan, V.. (2014). Recent climate and air pollution impacts on Indian agriculture. Proceedings of the National Academy of Sciences.

Avnery, S., et al. (2011). Global crop yield reductions due to surface ozone exposure. Atmospheric Environment.

Additional References: New Systems-Level Theory (“Ozone Feedback Theory”)

Lenton, T. M., et al. (2008). Tipping elements in the Earth’s climate system.Proceedings of the National Academy of Sciences.

Steffen, W., et al. (2018). Trajectories of the Earth System in the Anthropocene.Proceedings of the National Academy of Sciences.

Ripple, W. J., et al. (2024). The 2024 State of the Climate Report: Entering Uncharted Territory.BioScience.

Rockström, J., et al. (2023). Safe and just Earth system boundaries.Nature.

bookmark_borderA New Way to Understand Earth’s Accelerating Climate System

Climate Change Threshold-Driven Dynamics

Public Access Edition

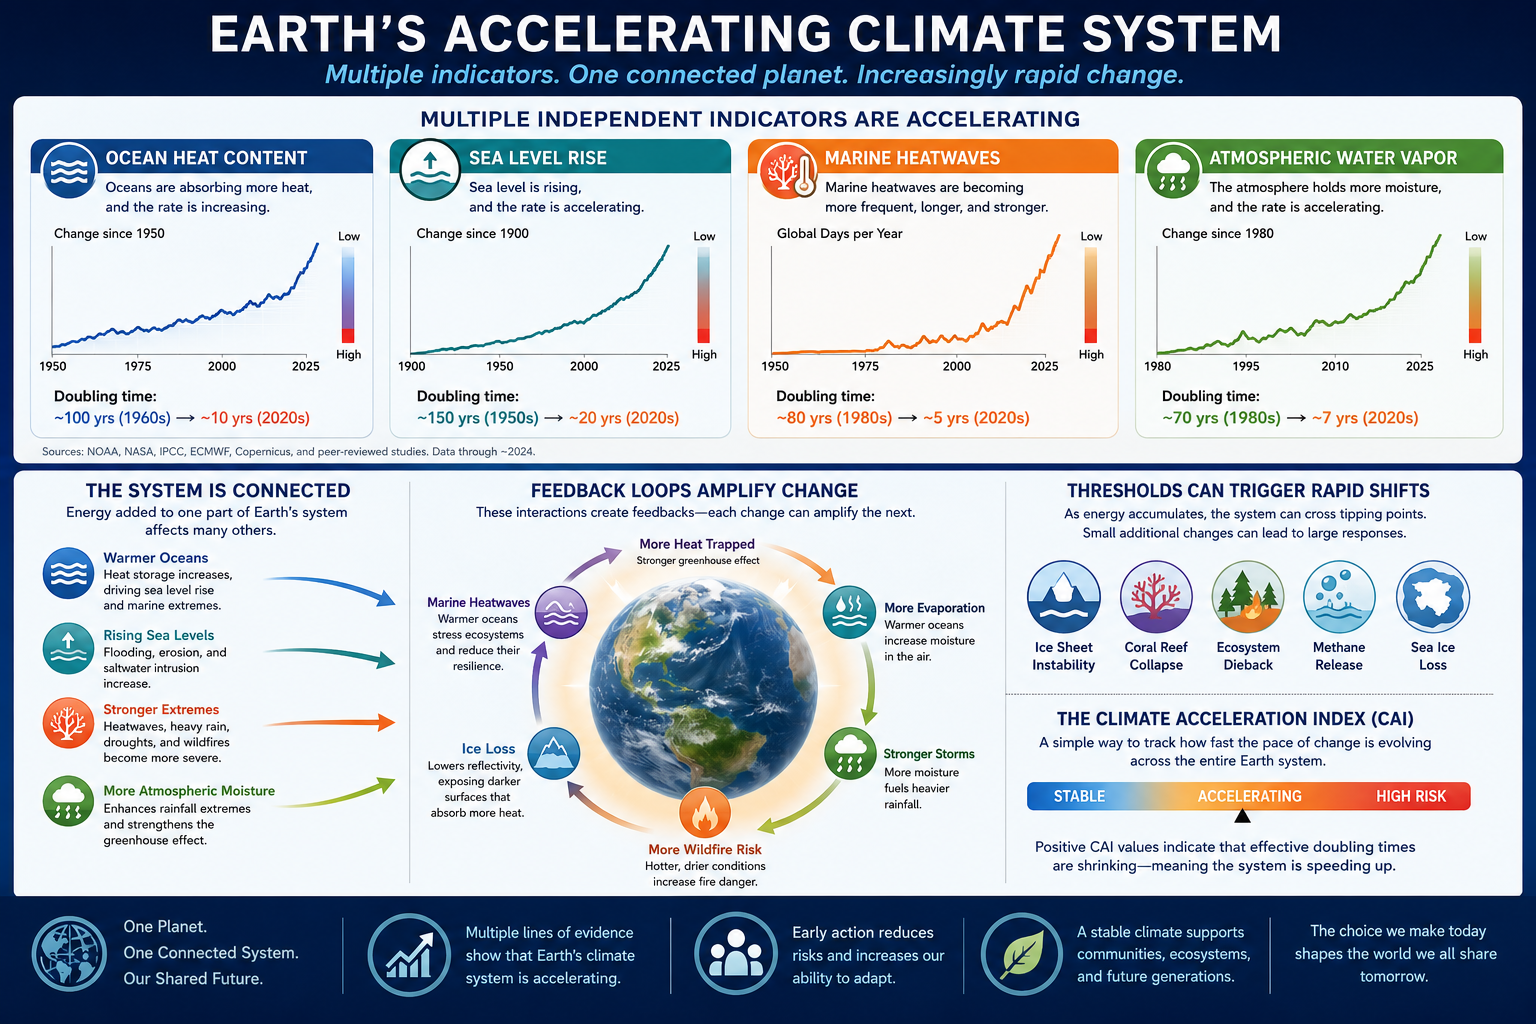
“This looks complicated.” True—it is complicated, and that’s part of the problem. The climate system involves interacting feedbacks across the atmosphere, oceans, biosphere, and cryosphere, so it can’t really be reduced to a single mechanism or slogan without losing important detail.

That’s exactly why we created this version as a public-access summary (roughly 6th–10th grade level)—to make the core ideas more accessible without requiring technical background.

But at the simplest level, the takeaway is straightforward: burning fossil fuels is driving the problem, and reducing those emissions is the most direct way to limit further warming and related impacts.


by Daniel Brouse

Executive Summary

For decades, climate change has often been described as a slow, gradual process. Rising temperatures, melting ice, and increasing sea levels were expected to unfold steadily over many generations.

That picture is changing.

Evidence from multiple independent observations now suggests that many parts of Earth’s climate system are no longer changing at constant rates. Instead, the rates of change themselves are increasing.

This distinction is important.

Instead of asking:

“How fast is sea level rising?”

we should increasingly ask:

“Is sea level rise itself speeding up?”

The same question applies to ocean warming, atmospheric moisture, marine heatwaves, wildfire conditions, and many other parts of the climate system.

This paper introduces a framework for examining the climate system as a single interconnected network whose major components exchange energy and reinforce one another through feedback loops. Rather than viewing each indicator independently, the framework evaluates how the entire system evolves together.


From Linear Change to Accelerating Change

Many natural systems change gradually.

Imagine driving a car at a constant speed.

Now imagine continually pressing the accelerator.

The difference is not simply that the car is moving—it is that the speed itself is increasing.

Earth’s climate increasingly appears to behave in the second way.

For much of the industrial era, many climate indicators changed relatively slowly.

Today, numerous observations show that several major Earth system components are accelerating simultaneously.

These include:

  • Ocean Heat Content
  • Global Sea Level
  • Marine Heatwaves
  • Atmospheric Water Vapor

Each represents a different part of Earth’s energy system, yet all respond to the same underlying planetary energy imbalance.


The Climate System Is Connected

Earth does not contain isolated climate systems.

Everything interacts.

As oceans absorb more heat:

  • seawater expands, raising sea levels
  • evaporation increases
  • atmospheric moisture rises
  • heavier rainfall becomes possible
  • marine heatwaves intensify
  • glaciers melt faster
  • ecosystems experience greater stress

These interactions create feedbacks.

A feedback occurs when one change amplifies another.

For example:

Ocean warming → More evaporation → More atmospheric water vapor → Stronger greenhouse trapping → Additional ocean warming

Each loop reinforces the next.

Instead of separate problems, these become parts of one larger system.


Why Doubling Times Matter

One useful way to understand acceleration is through doubling time.

Doubling time asks:

How long would it take for today’s value to double if the current rate continued?

If the doubling time becomes shorter, change is accelerating.

For example:

Doubling TimeInterpretation
100 yearsSlow change
50 yearsChanging faster
25 yearsAcceleration increasing
10 yearsRapid acceleration

Shrinking doubling times indicate that the climate system is evolving more quickly than before.

They provide an intuitive way to compare very different climate indicators using a common measure.

Familiar Example

Many people are familiar with the power of compound interest. Historically, a diversified stock portfolio has returned about 10% per year over long periods (although actual returns vary from year to year).

At a 10% annual return, an investment doubles approximately every 7.2 years (using the Rule of 72).

FV=PV(1+r)nFV=PV(1+r)^nFV=PV(1+r)n

Suppose you invest $10,000 at age 18 and leave it untouched until age 64—a period of 46 years.

Using annual compounding:FV=$10,000×(1.10)46FV = \$10,000 \times (1.10)^{46}FV=$10,000×(1.10)46 FV≈$803,731FV \approx \$803,731FV≈$803,731

That’s an increase by a factor of 80.4×.

Another way to see it is through doubling times:

  • Age 18: $10,000
  • Age 25 (1st doubling): $20,000
  • Age 32 (2nd): $40,000
  • Age 39 (3rd): $80,000
  • Age 46 (4th): $160,000
  • Age 53 (5th): $320,000
  • Age 60 (6th): $640,000
  • Age 64: About $804,000 (another four years of 10% growth beyond the sixth doubling)

This illustrates an important concept: the investment isn’t growing by the same dollar amount each year—it is growing by the same percentage. As the principal becomes larger, each year’s gain becomes dramatically larger than the previous year’s.

The compound interest example demonstrates why shrinking doubling times are so powerful. At a steady 10% annual return, an investment doubles about every seven years, allowing $10,000 to grow into more than $800,000 over a lifetime through the relentless mathematics of exponential growth. Climate change, however, may be even more concerning because the Earth’s effective doubling times are not remaining constant—they appear to be shrinking. In financial terms, it would be as if your investment initially doubled every 10 years, then every 5 years, then every 2 years, and eventually almost instantaneously. Each shortening of the doubling time means the system is accelerating, producing increasingly larger changes over increasingly shorter periods. As climate feedbacks strengthen, the accumulation and redistribution of energy through the oceans, atmosphere, ice sheets, and ecosystems can occur at an ever-faster pace. Just as investors celebrate faster compounding because it rapidly multiplies wealth, accelerating climate doubling times mean that warming, sea-level rise, extreme weather, and ecosystem disruption can compound much more quickly than linear thinking would suggest. The critical insight is not simply that the climate is changing, but that the pace of change itself is accelerating. In the limit, as the doubling time approaches zero, the system transitions toward an instantaneous-growth regime, where the characteristic timescale of change collapses and the climate system can respond far more rapidly than historical experience would suggest.

This is analogous to accelerating climate change. The Earth’s energy imbalance acts like the “interest rate.” If climate feedbacks strengthen over time, the effective growth rate increases and the doubling time shrinks. Just as a shortening doubling time makes an investment grow much faster, shrinking climate-system doubling times mean that changes in ocean heat, sea level, atmospheric moisture, and extreme events can accelerate much more rapidly than they did in previous decades.


A Shift Toward Threshold-Driven Dynamics

Many natural systems contain thresholds.

A bridge can withstand increasing weight until one additional truck causes failure.

A forest may tolerate drought for years before widespread wildfire suddenly erupts.

Ice sheets may melt slowly until structural weakening causes much faster ice loss.

Climate systems often behave similarly.

Energy accumulates gradually until internal stability begins to weaken.

Once thresholds are approached, relatively small additional warming can produce disproportionately large responses.

Scientists call this nonlinear behavior.

Instead of smooth change, the system begins responding through rapid jumps, stronger feedbacks, and cascading interactions.


Introducing the Climate Acceleration Index

To better understand this behavior, we introduce a simple concept called the Climate Acceleration Index (CAI).

Rather than measuring how large a climate variable becomes, the CAI measures how rapidly the pace of change itself is evolving.

Positive values indicate that effective doubling times are shrinking.

In plain language:

  • the system is speeding up
  • climate responses are occurring over shorter time scales
  • feedbacks are becoming increasingly important

The Climate Acceleration Index is intended as a system-wide diagnostic rather than a forecast.


Viewing the Entire Earth System

Traditional climate graphs usually display one variable at a time:

  • global temperature
  • sea level
  • ocean heat
  • Arctic ice
  • atmospheric carbon dioxide

Each tells an important story.

But because Earth’s climate behaves as a connected network, examining only individual indicators can miss broader system behavior.

This framework instead evaluates how multiple components evolve together.

When several independent indicators accelerate simultaneously, they provide stronger evidence of coordinated changes throughout the Earth system.


Why This Matters

As the climate system accelerates:

  • extreme rainfall becomes more likely
  • marine heatwaves become more persistent
  • stronger tropical cyclones become more probable
  • wildfire conditions become increasingly favorable
  • droughts intensify
  • flooding becomes more frequent
  • ecosystem stress increases

None of these processes occur in isolation.

They emerge from the same planetary energy imbalance interacting through multiple feedback mechanisms.


A New Perspective

Historically, climate science has focused on answering questions such as:

  • How much warmer is the planet?
  • How much higher is sea level?
  • How often do heatwaves occur?

These remain essential.

However, a new question is becoming increasingly important:

How quickly are the rates of change themselves evolving?

Answering this question helps identify whether Earth’s climate is entering a different dynamical regime—one increasingly governed by interacting feedbacks rather than relatively steady trends.


Conclusion

Earth’s climate is best understood not as a collection of independent trends but as an interconnected system continually redistributing energy.

As that redistribution accelerates, multiple climate indicators increasingly change together.

Shrinking doubling times provide one way to observe this transition.

The Climate Acceleration Index offers a framework for monitoring whether the Earth’s major subsystems are moving toward faster, more tightly coupled behavior.

This approach does not replace traditional climate indicators.

Instead, it complements them by focusing on the evolution of the entire system rather than any single variable.

As climate feedbacks strengthen, understanding the behavior of the whole system may become just as important as measuring its individual parts.


Key Takeaways

  • Earth is warming through an interconnected network of climate processes.
  • Multiple climate indicators are accelerating simultaneously.
  • Shrinking doubling times provide evidence that changes are occurring more rapidly.
  • Thresholds and feedbacks can amplify future changes beyond simple linear expectations.
  • The Climate Acceleration Index is a new framework designed to measure how rapidly the pace of climate change itself is evolving across the entire Earth system.