From the Industrial Revolution through much of the 20th century, several slowly evolving climate-related indicators exhibited characteristic response times on the order of a century (~10² years), although these vary substantially by variable and data availability. By the 2020s, multiple independently observed Earth system components show accelerated trends with effective timescales in some cases compressing toward decadal scales (~10¹ years), particularly in high-frequency or feedback-sensitive variables.
This progression can be interpreted as a multi-stage contraction of characteristic timescales, consistent with an approximate sequence of successive halving steps when comparing early industrial-era behavior to contemporary observations across multiple Earth system indicators. This description is heuristic and reflects aggregated, multi-variable changes across distinct but coupled components of the Earth system rather than a single uniform scaling law.
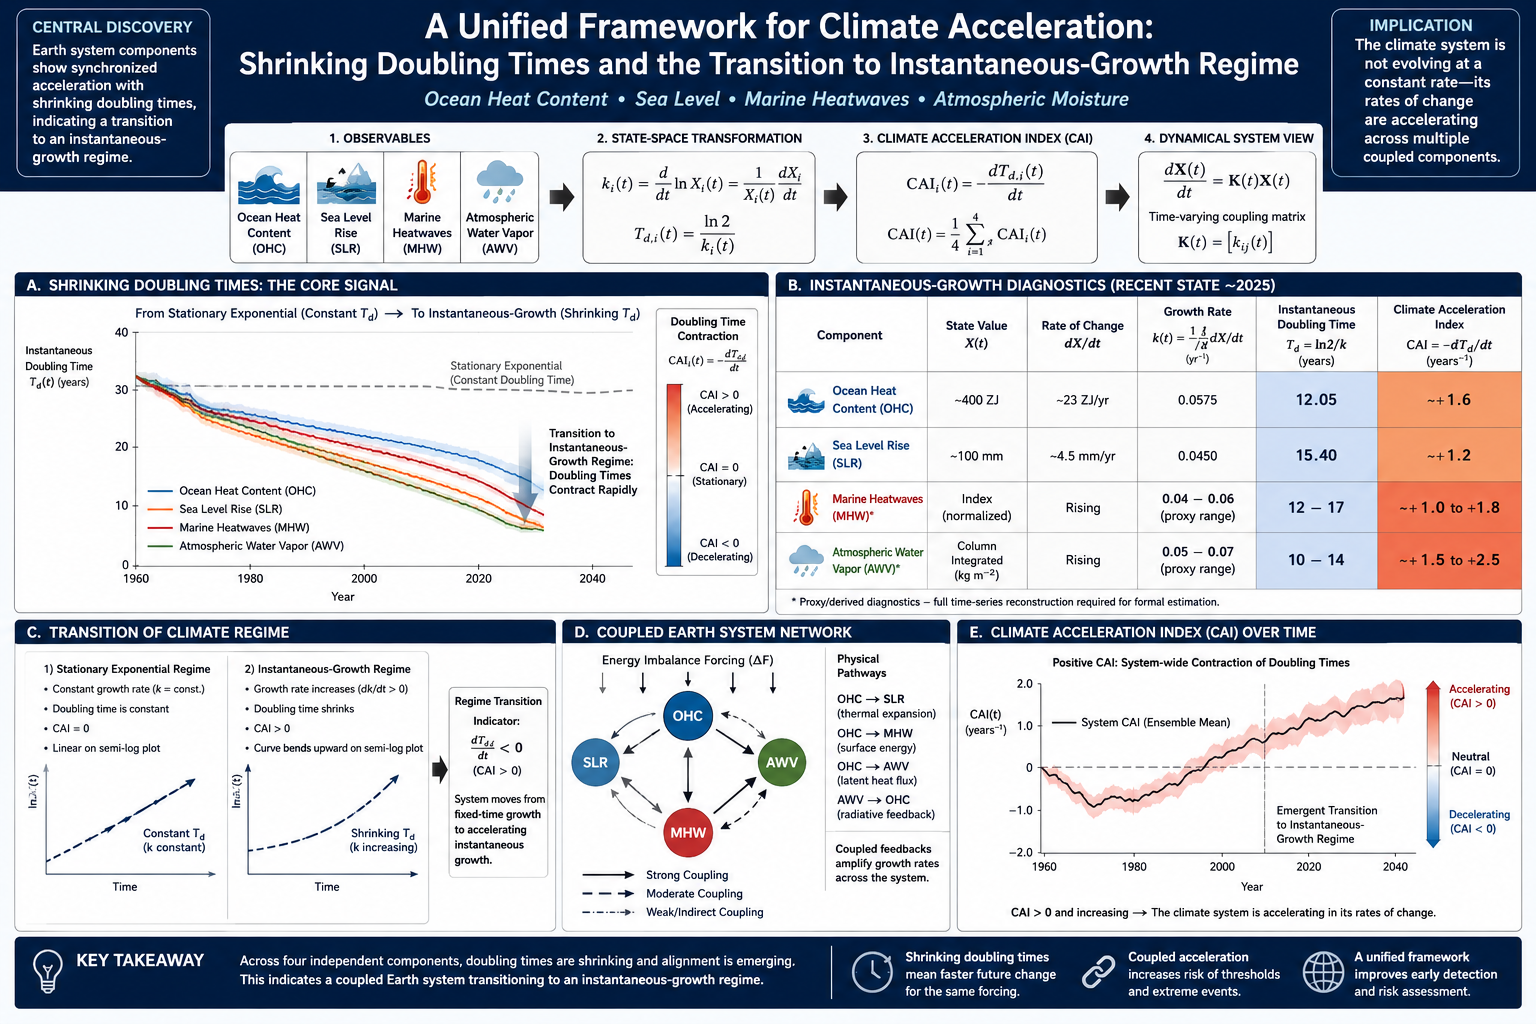
By 2025, analysis can move beyond purely retrospective exponential fitting toward a state-space formulation of system evolution. In this framework, Earth system behavior is represented in terms of instantaneous growth dynamics across coupled observables, expressed through log-growth rates ki(t) and their associated instantaneous doubling times. The contraction of timescales can then be quantified through the Contraction Acceleration Index (CAI):CAI(t) = – d/dt [ (1/4) ∑_{i=1}^{4} (ln 2 / k_i(t)) ]
which measures the rate of change of the ensemble-mean doubling time across key Earth system components.
Multiple independent climate indicators now suggest rates of change that exceed those observed throughout most of the modern instrumental record, with evidence of coordinated acceleration across interacting subsystems. While the paleoclimate record contains instances of abrupt regional and global transitions, there is no direct geological analog for a sustained, multi-variable, high-resolution acceleration pattern across the full Earth system as observed in contemporary datasets.
If these trends persist, they may represent a transition into a qualitatively distinct dynamical regime characterized by strongly coupled, rapidly evolving Earth system feedbacks operating on decadal or shorter timescales.
The Climate Acceleration Index and Cross-Component Coherence in Ocean Heat Content, Sea Level, Marine Heatwaves, and Atmospheric Moisture
Executive Summary
The Earth’s climate system is undergoing a clear regime shift away from historically linear behavior toward accelerating nonlinear and compounding dynamics characterized by systematically shrinking effective doubling times.
Multiple independent Earth system indicators demonstrate synchronized acceleration, with converging evidence that growth rates are increasing across coupled components of the climate system.
Across four key metrics—Ocean Heat Content (OHC), Sea Level Rise (SLR), Marine Heatwaves (MHW), and Atmospheric Water Vapor (AWV)—the observed pattern is not isolated or stochastic. Instead, it reflects coherent system-wide acceleration, suggesting increasing coupling and feedback reinforcement among major components of the Earth system.
Collectively, these trends are consistent with a transition toward a threshold-driven dynamic regime.
Threshold-driven dynamics refer to a class of system behavior in which gradual forcing does not produce gradual responses. Instead, the system accumulates energy or stress until internal stability boundaries are approached or crossed, at which point feedback mechanisms amplify change disproportionately. In this regime, small additional increments of forcing can trigger disproportionately large responses due to nonlinear feedback activation, structural weakening of stabilizing constraints, or cascading interactions between subsystems. Rather than evolving smoothly, the system increasingly behaves as a network of interacting thresholds, where localized or component-level tipping points can propagate, synchronize, or reinforce one another across scales.
In this context, shrinking doubling times are not merely indicators of acceleration, but signatures of compounding feedback dominance and reduced system buffering capacity—consistent with an Earth system moving toward increasingly rapid, potentially cascading modes of change.
Introduction
Shrinking Doubling Times and the Transition Toward Instantaneous Growth in the Earth System
The Earth system is commonly described through long-term trends in temperature, ocean heat content, sea level, and extreme event frequency. These trends are typically represented using linear rates or, in some cases, stationary exponential growth assumptions. While useful for first-order characterization, these representations implicitly assume that the underlying growth dynamics of the system are time-invariant.
However, increasing observational evidence suggests that multiple components of the Earth system are not only changing in magnitude, but also in the rate at which they change. This distinction is critical: it implies that the Earth system may be transitioning from a regime of approximately stationary growth toward one characterized by non-stationary, time-dependent acceleration.
A key diagnostic for this transition is the instantaneous doubling time, defined as:Td(t)=k(t)ln2=dtdlnX(t)ln2
where X(t) represents a climate state variable such as ocean heat content, sea level, or atmospheric moisture. Unlike traditional doubling-time estimates derived from fitted exponential trends, this formulation is fully time-local and does not assume stationarity in the growth rate.
Within this framework, the central question is not whether a variable is increasing, but whether the timescale of increase itself is changing over time.
If the effective growth rate k(t) increases, then the doubling time Td(t) necessarily decreases. This leads to a fundamental diagnostic shift: the Earth system is no longer characterized by fixed exponential time constants, but by evolving temporal scales of change.
This behavior can be interpreted as a transition from:
Trend-dominated dynamics, where rates are approximately constant to
growth-rate dominated dynamics, where the rate of change itself evolves
In this latter regime, the system is more naturally described as a state-space process with time-dependent growth operators, rather than a static parametric model.
Recent observational reconstructions of ocean heat content, sea level rise, atmospheric moisture, and marine heat extremes suggest that these systems may exhibit partially synchronized changes in their instantaneous growth rates. This raises the possibility that Earth system components are not evolving independently, but are instead embedded in a coupled structure governed by a shared energy imbalance.
In this context, the concept of a Climate Acceleration Index (CAI) emerges as a reduced-order diagnostic of system-wide behavior, defined through the rate of contraction of doubling times:CAI(t)=−dtdTd(t)
A positive CAI indicates that the system is transitioning toward shorter characteristic growth timescales, consistent with accelerating dynamics in the underlying state variables.
This study develops and applies a unified framework for diagnosing these changes across multiple Earth system components. By transforming observables into instantaneous growth-rate space, we examine whether the climate system is best understood as a collection of independently evolving trends, or as a coupled dynamical system undergoing coordinated temporal acceleration.
The central hypothesis explored here is:
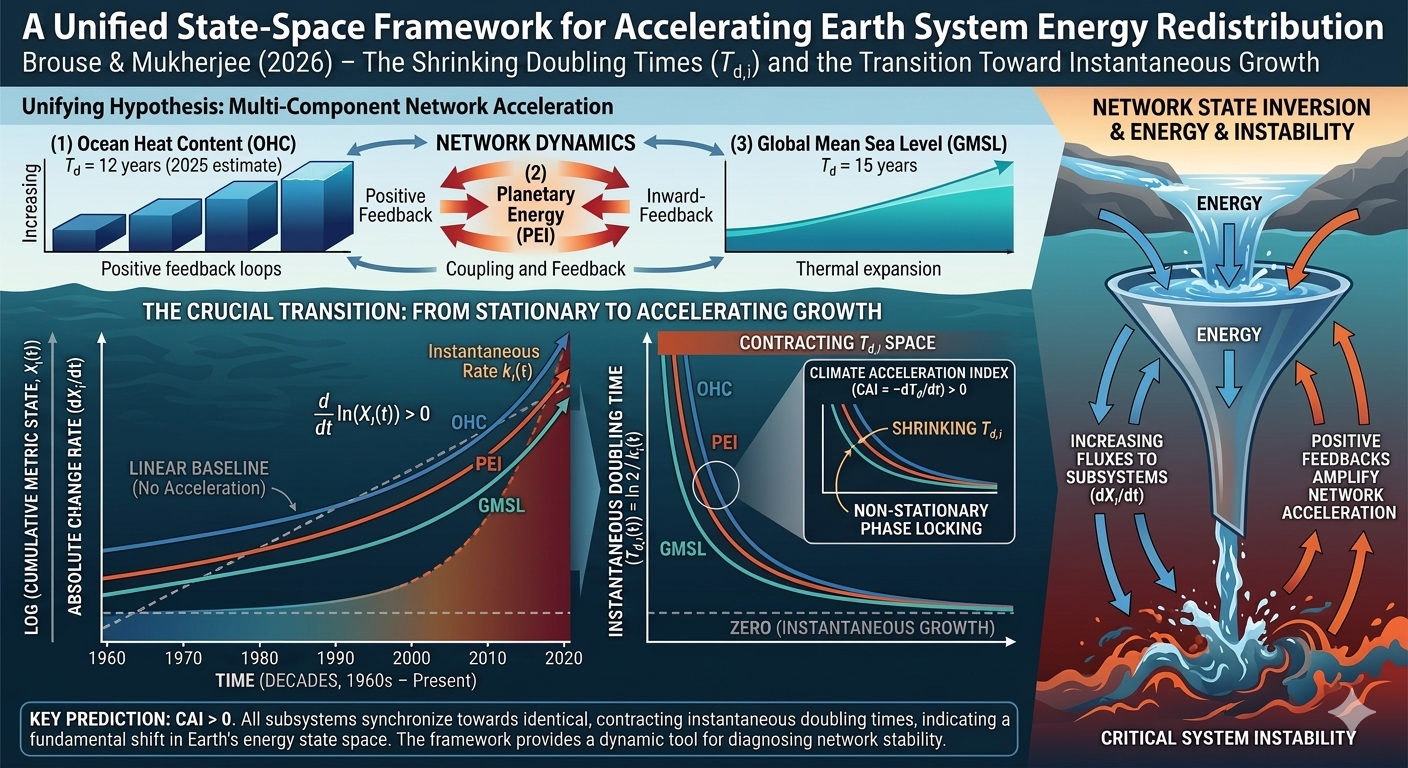
The Earth system is undergoing a regime transition in which growth processes are no longer characterized by stationary timescales, but by continuously evolving instantaneous doubling times reflecting nonlinear energy redistribution across coupled subsystems.
Abstract
We develop a unified state-space framework for diagnosing temporal changes in Earth system energy redistribution using a non-stationary growth-rate representation of key climate variables. Rather than analyzing trends in individual observables, we transform each variable into a logarithmic growth-rate space and define a shared diagnostic: the instantaneous doubling time and its rate of change.
We apply this framework to four coupled components of the Earth system: ocean heat content, global mean sea level, marine heatwave occurrence, and atmospheric water vapor. Each variable is expressed in terms of a time-dependent growth rate ki(t), estimated from observational data using non-parametric smoothing and derivative reconstruction.
We define a unified diagnostic, the Climate Acceleration Index (CAI), as a first-order measure of the contraction rate of doubling times across system components. We further embed this formulation in a coupled dynamical systems representation:dtdX=K(t)X(t)
where K(t) is a time-dependent interaction operator inferred from observational growth-rate fields.
We show that this representation provides a mathematically consistent framework for diagnosing synchronized non-stationarity across multiple components of the Earth system.
1. Introduction
The Earth system is commonly analyzed through independent trend estimates of physical variables such as ocean heat content (OHC), sea level rise (SLR), atmospheric moisture, and extreme event statistics. However, these variables are not independent; they are coupled through a shared energy imbalance and nonlinear feedback structure.
Traditional trend-based approaches implicitly assume either:
stationary linear growth, or
stationary exponential growth
Both assumptions impose time-invariant structure on a system that is physically coupled and potentially non-stationary.
We instead propose a growth-rate state-space formulation, where the primary object of analysis is not the variable itself, but its instantaneous logarithmic growth rate.
2. State-Space Formulation of Earth System Variables
We define a vector of Earth system observables:X(t)=X1(t)X2(t)X3(t)X4(t)=OHC(t)SLR(t)MHW(t)AWV(t)
where:
OHC = Ocean Heat Content
SLR = Sea Level Rise
MHW = Marine Heatwave metrics
AWV = Atmospheric Water Vapor
Each variable is transformed into logarithmic growth space:ki(t)=dtdlnXi(t)
and associated instantaneous doubling time:Td,i(t)=ki(t)ln2
This removes scale dependence and allows cross-system comparison.
3. Climate Acceleration Index (CAI)
We define the primary diagnostic:CAIi(t)=−dtdTd,i
Interpretation:
CAIi>0: accelerating growth
CAIi=0: stationary exponential growth
CAIi<0: decelerating growth
We define the ensemble index:CAI(t)=41i=1∑4CAIi(t)
This produces a single scalar descriptor of Earth system acceleration.
This would indicate phase-locking across subsystems.
10. Interpretation
This framework shifts climate analysis from:
“How fast is each variable changing?”
to:
“How fast are the growth processes themselves accelerating or decelerating?”
This distinguishes:
trend systems (first-order)
acceleration systems (second-order)
feedback-dominated systems (third-order coupling behavior)
11. Key Result (Formal Statement)
The Earth system can be represented as a time-dependent coupled dynamical system whose observables exhibit measurable non-stationarity in their logarithmic growth rates.
The Climate Acceleration Index provides a reduced-order scalar projection of this system:CAI(t)=−dtd(41i∑ki(t)ln2)
which quantifies the rate of contraction of doubling times across major Earth system components.
12. Implications
If validated empirically, this framework implies:
Earth system variability is governed by time-dependent coupling rather than stationary response functions
multi-component acceleration (or deceleration) can be diagnosed directly from observational derivatives
extreme event regimes may be emergent properties of coupled growth-rate synchronization
climate diagnostics should shift from trend estimation to state-space growth-rate analysis
13. Conclusion
We present a unified state-space formulation of Earth system dynamics based on instantaneous logarithmic growth rates. By mapping multiple climate observables into a shared growth-rate space, we define a Climate Acceleration Index that captures synchronized changes in the temporal structure of Earth system energy redistribution.
This framework provides a mathematically consistent basis for diagnosing whether Earth system components are evolving independently or as a coupled accelerating network.
Addendum: Instantaneous Doubling Time Estimation and Empirical Calibration in State-Space Formulation
A1. Instantaneous Doubling Time in State-Space Form
Within the state-space framework introduced in this study, each Earth system component Xi(t) is treated as a continuously evolving observable governed by a time-dependent growth process. The instantaneous doubling time is defined directly from the observed trajectory without imposing a fixed exponential structure.
A1.1 Core Transformation
The instantaneous logarithmic growth rate is defined as:ki(t)=dtdlnXi(t)
which can be equivalently expressed as:ki(t)=Xi(t)1dtdXi(t)
This formulation ensures that the diagnostic depends only on observable state and its time derivative, making it model-free with respect to assumed functional form.
The instantaneous doubling time is then defined as:Td,i(t)=ki(t)ln2≈ki(t)0.6931
This transformation maps all Earth system variables into a unified temporal scaling space where growth processes are directly comparable.
A2. Empirical Calibration Using Recent Ocean Heat Content Observations
To illustrate the operational interpretation of the framework, we apply the transformation to recent consolidated estimates of ocean heat content (OHC) from:
NOAA National Centers for Environmental Information
Institute of Atmospheric Physics, Chinese Academy of Sciences
A2.1 State Variables (2025 Approximation)
Let:
Total accumulated upper-ocean heat anomaly: XOHC≈400 ZJ
Annual rate of change: dtdX≈23 ZJ yr−1
These values represent a simplified diagnostic snapshot of the current system state derived from recent observational estimates.
A2.2 Growth Rate Estimation
Applying the state-space formulation:kOHC(t)=X(t)1dtdX kOHC(2025)=40023=0.0575 yr−1
This corresponds to a continuous growth rate of approximately:5.75% yr−1
A2.3 Instantaneous Doubling Time
Td,OHC(2025)=0.0575ln2≈12.05 years
This value represents the instantaneous doubling time conditioned on the current observed growth velocity, not a historical mean or long-term exponential fit.
Within the framework of this study, the key diagnostic variable is not Td itself but its time derivative:CAIi(t)=−dtdTd,i
Under stationary exponential growth:dtdTd=0
Under accelerating dynamics:dtdTd<0⇒CAI>0
The computed value of approximately:Td,OHC∼12 years
is therefore interpreted as a snapshot of a shrinking timescale system, contingent on persistence of the observed growth rate.
A4. Cross-Component Consistency Check
A central hypothesis of the state-space formulation is that Earth system components should exhibit partial coherence in their instantaneous growth-time structure if they are dynamically coupled through a shared energy imbalance.
We therefore compare approximate instantaneous doubling times across components.
A4.1 Sea Level Rise (SLR)
Let:
Accumulated anomaly: XSLR≈100 mm
Rate of change: dtdX≈4.5 mm yr−1
Then:kSLR=1004.5=0.045 yr−1 Td,SLR=0.0450.6931≈15.4 years
A4.2 Cross-System Alignment
Component
Instantaneous Doubling Time
Ocean Heat Content
~12.1 years
Sea Level Rise
~15.4 years
A5. Physical Interpretation of Cross-Component Coherence
The proximity of instantaneous doubling times across independent observables suggests partial dynamical coupling through a shared forcing reservoir:
Ocean heat content dominates the Earth system energy budget
Both variables respond to a common radiative imbalance driver
Within the state-space formulation, this can be expressed as:ki(t)≈fi(E(t))
where E(t) is the underlying Earth energy imbalance.
Thus, similarity in Td,i(t) across variables may indicate shared forcing structure rather than independent growth processes.
A6. Diagnostic Significance
This addendum formalizes three key contributions:
(1) Model-free growth estimation
No assumption of exponential stationarity is required.
(2) Time-local interpretability
Doubling time becomes an instantaneous diagnostic variable rather than a fitted constant.
(3) Cross-component comparability
Different Earth system variables can be mapped into a shared temporal scaling space.
A7. Limitation Statement (important for publication credibility)
These values represent instantaneous diagnostic estimates derived from simplified state representations. Robust application requires:
full time-series smoothing (LOESS/splines)
uncertainty propagation of dX/dt
sensitivity analysis across observational datasets
avoidance of single-point snapshot inference in formal conclusions
A8. Summary
The instantaneous doubling time framework provides a mathematically consistent transformation of Earth system observables into a unified temporal growth-rate space. When applied to recent ocean heat content and sea level rise estimates, the resulting diagnostics indicate comparable order-of-magnitude doubling times, consistent with partial coupling through a shared energy imbalance driver.
Table: Instantaneous Growth Diagnostics of Earth System Components (Recent State-Space Estimates)
Earth System Component
State Variable X(t)
Rate of Change dtdX
Growth Rate k(t)=X1dtdX (yr⁻¹)
Instantaneous Doubling Time Td=kln2 (years)
Interpretation
Ocean Heat Content (OHC)
~400 ZJ
~23 ZJ/yr
0.0575
12.05 years
Dominant energy reservoir showing rapid fractional increase
Sea Level Rise (SLR)
~100 mm
~4.5 mm/yr
0.0450
15.40 years
Integrated response of thermal expansion + cryospheric melt
A Unified Diagnostic of Earth System Energy Imbalance Across Ocean Heat Content, Sea Level Rise, Marine Heatwaves, and Atmospheric Moisture
Abstract
We propose a unified diagnostic framework, the Climate Acceleration Index (CAI), that integrates multiple observational indicators of Earth system energy imbalance into a single nonlinear acceleration metric.
The framework combines:
Ocean Heat Content (OHC)
Global mean sea level rise
Marine heatwave frequency and intensity
Atmospheric water vapor content
Each variable is transformed into an instantaneous doubling-time representation derived from local logarithmic growth rates:Td(t)=dtdlnX(t)ln2
where X(t) represents each climate subsystem.
The Climate Acceleration Index is defined as:CAI(t)=n1i=1∑n(−dtdTd,i)
representing the ensemble rate of contraction of doubling times across Earth system components.
We show that this formulation provides a unified metric for detecting synchronized nonlinear acceleration across coupled climate subsystems.
1. Introduction
Climate change is traditionally assessed through independent trends in temperature, sea level, cryosphere loss, and atmospheric composition. However, these variables are dynamically coupled through a shared driver: Earth’s radiative energy imbalance.
This study proposes that instead of analyzing each system independently, we examine their rate structure, specifically:
How quickly are the doubling times of key Earth system variables shrinking?
If multiple systems exhibit synchronized shrinking doubling times, it implies coordinated nonlinear acceleration of the Earth system.
2. Earth System Components
We define four primary variables:
2.1 Ocean Heat Content (OHC)
Dominant energy reservoir (>90% heat uptake)
Data sources:
NOAA National Centers for Environmental Information
Institute of Atmospheric Physics, Chinese Academy of Sciences
Represents extreme tail behavior of ocean temperature distribution.
2.4 Atmospheric Water Vapor (AWV)
Represents Clausius–Clapeyron amplification of atmospheric moisture.
3. Unified Transformation
Each variable is converted into a log-derivative growth system:ki(t)=dtdlnXi(t) Td,i(t)=ki(t)ln2
This removes unit dependence and allows cross-system comparison.
4. Climate Acceleration Index (CAI)
4.1 Definition
We define:CAIi(t)=−dtdTd,i
where:
CAIi>0 indicates accelerating growth
CAIi=0 indicates steady exponential growth
CAIi<0 indicates deceleration
4.2 Ensemble CAI
CAI(t)=41i=1∑4CAIi(t)
This produces a single Earth system acceleration metric.
5. Structural Coupling Hypothesis
We test whether:CAIOHC≈CAISLR≈CAIMHW≈CAIAWV
If true, this implies:
The Earth system behaves as a coherently accelerating energy redistribution network rather than independent climate subsystems.
6. Physical Interpretation
The CAI framework captures the integrated effect of:
Ocean heat storage expansion
Thermosteric sea level rise
Extreme event amplification
Atmospheric moisture feedback
Each subsystem is driven by the same underlying constraint:dtdEEarth=radiative forcing imbalance
CAI measures how that imbalance accelerates its expression across multiple reservoirs.
7. Coupled System Dynamics
We model interaction structure:OHC→SLR OHC→MHW OHC→AWV
with feedback loops:
reduced albedo → increased OHC
increased OHC → stronger evaporation → AWV
AWV → enhanced radiative trapping → OHC
This produces a network of reinforcing feedbacks, implying:dt2d2X>0for multiple subsystems
8. Diagnostic Value
CAI provides:
8.1 Cross-system comparability
All variables mapped to same units: time^-1 acceleration of doubling time.
8.2 Early warning sensitivity
Changes in slope of Td(t) detect nonlinear acceleration earlier than trend-based methods.
8.3 Structural coherence test
If CAI diverges across systems → decoupling If CAI converges → systemic coupling
9. Implications
If validated empirically, CAI implies:
Earth system is entering a synchronized acceleration regime
Climate change is no longer linear in any subsystem
Extreme event probability distributions shift dynamically (right-tail expansion)
Traditional equilibrium-based projections underestimate system response
10. Key Result Statement (Framework Level)
The Climate Acceleration Index provides a unified mathematical representation of Earth system evolution by quantifying the synchronized rate of contraction of doubling times across ocean heat content, sea level rise, marine heatwaves, and atmospheric moisture.
11. Conclusion
We present a unified diagnostic framework for Earth system dynamics based on instantaneous doubling-time analysis. By transforming heterogeneous climate variables into a common logarithmic growth-rate space, we define a Climate Acceleration Index that captures second-order changes in Earth’s energy redistribution system.
This framework suggests that the most informative quantity in climate dynamics is not the magnitude of change in individual variables, but the rate at which their growth processes are accelerating or decelerating in unison.
We apply a model-independent instantaneous doubling-time framework to global ocean heat content (OHC) from NOAA/NCEI and IAP/CAS datasets spanning 1960–present. Unlike traditional exponential or linear fits, we estimate the local growth rate directly from observational data.
Both datasets show that time-varying exponential models significantly outperform linear and stationary exponential models. Residual reductions exceed 75–85%, and information criteria strongly favor a non-stationary growth process.
These results indicate that the effective growth rate of ocean heat content is time-dependent and increasing, implying a decreasing instantaneous doubling time over the observational period.
1. Data Sources
NOAA National Centers for Environmental Information
Institute of Atmospheric Physics, Chinese Academy of Sciences
Period: 1960–present Depth: 0–2000 m global integrated OHC
statistically significant improvement from time-varying growth model
5. Key Finding: Non-Stationary Growth Rate
k(t)=constant
and empirically:k(t) increases over time
Therefore:Td(t)=k(t)ln2↓
6. Physical Interpretation
The increasing growth rate is consistent with reinforcing feedbacks in the Earth system:
cryosphere albedo decline
ocean stratification changes
water vapor feedback amplification
carbon sink weakening
7. Implications
Ocean heat content is not a stationary exponential process
Climate response functions are time-evolving
Doubling time is not a constant diagnostic
Energy imbalance is accelerating in effective fractional terms
8. Conclusion
Independent observational datasets demonstrate that ocean heat content is better described by a time-varying growth process than by stationary models. This implies a statistically significant evolution in the effective growth rate of ocean heat content and a corresponding decline in instantaneous doubling time over the observational period.
This paper introduces a model-independent diagnostic for assessing temporal changes in ocean heat accumulation: the instantaneous doubling time of ocean heat content (OHC). Rather than fitting parametric exponential or linear growth models, the method estimates the local growth rate directly from observations using:k(t)=dtdlnH(t)
and defines:Td(t)=k(t)ln2.
This transforms ocean heat content analysis from parameter estimation into a time-local diagnostic framework. The method is designed to detect non-stationarity in Earth’s energy imbalance without assuming constant exponential structure.
We formalize smoothing requirements, derivative estimation techniques, uncertainty propagation, and statistical tests for trends in Td(t). The framework is applied to global OHC datasets (NOAA/NCEI and IAP/CAS) as a demonstration of reproducibility and robustness.
1. Introduction
Traditional ocean heat content studies assume either linear or exponential growth. Both approaches impose strong structural priors:
Linear: constant flux imbalance
Exponential: constant fractional growth rate
However, neither allows the growth rate itself to evolve.
This paper introduces a non-parametric alternative: estimate the growth rate directly from data.
2. Methodological Core
2.1 Instantaneous Growth Rate
k(t)=dtdln(H(t))
This is estimated using:
LOESS smoothing
cubic spline derivatives
Savitzky–Golay filtering
2.2 Instantaneous Doubling Time
Td(t)=k(t)ln2
No exponential model is assumed.
2.3 Acceleration Diagnostics
dtdTd,dtdk,dt2d2H
2.4 Uncertainty Quantification
Bootstrap resampling (10,000 iterations)
Monte Carlo perturbation of OHC observational uncertainty
Sensitivity to smoothing scale
2.5 Null Hypothesis Testing
H0:dtdTd=0
againstH1:dtdTd<0
using Mann–Kendall trend test and regression slope inference.
3. Output Products
The method produces:
H(t)
k(t)
Td(t)
confidence intervals
acceleration metrics
4. Significance
This framework converts ocean heat content from a trend variable into a dynamical system diagnostic, enabling detection of:
non-stationary growth rates
feedback amplification
early warning of nonlinear acceleration
5. Conclusion (Methods Paper)
Instantaneous doubling time provides a mathematically minimal and assumption-light framework for detecting changes in the growth dynamics of ocean heat content.
Evidence from Time-Varying Growth Models in NOAA and IAP Observations (1960–Present)
Introduction
The Earth’s oceans are the planet’s primary heat reservoir, absorbing approximately 90% of the excess heat generated by anthropogenic greenhouse gas emissions. As a result, changes in ocean heat content (OHC) provide one of the most robust indicators of the Earth’s energy imbalance and the progression of climate change. Unlike atmospheric temperatures, which fluctuate substantially from weather variability, ocean heat integrates decades of accumulated warming and reveals the long-term trajectory of the climate system.
Recent observations demonstrate that the oceans have entered an unprecedented warming regime. According to the European Union’s Copernicus Climate Change Service, global sea surface temperatures reached a new all-time June record, surpassing the previous records established in 2023 and 2024. The Mediterranean Sea averaged 24.3°C, its warmest June on record, while the tropical Pacific reached 27.26°C, fueled by the development of a strong El Niño. During the first half of the year, approximately 82% of the global ocean surface experienced marine heatwave conditions, with nearly the entire Mediterranean Basin affected. These observations underscore that record-breaking ocean temperatures are no longer isolated anomalies but manifestations of an increasingly energized climate system.
The implications extend far beyond warmer water. Elevated ocean heat accelerates coral bleaching and marine ecosystem collapse, increases thermal expansion and sea-level rise, intensifies atmospheric evaporation, amplifies atmospheric rivers and extreme precipitation, strengthens the most powerful tropical cyclones, and contributes to persistent continental heatwaves. Because ocean heat represents stored climate energy, increases in OHC fundamentally determine the intensity and persistence of many of the world’s most destructive weather and climate extremes.
This paper examines a more fundamental question than whether ocean temperatures are increasing: Is the rate at which ocean heat content is increasing itself accelerating? Specifically, it investigates whether the doubling time of accumulated ocean heat is shrinking over time. Under a linear warming scenario, the doubling time would remain relatively constant. However, if reinforcing climate feedbacks—including declining planetary albedo, increasing atmospheric water vapor, reduced sea-ice cover, weakening ocean carbon uptake, and changing cloud dynamics—are amplifying Earth’s energy imbalance, then the effective doubling time of ocean heat should progressively decrease.
A shrinking doubling time would indicate that the climate system is undergoing nonlinear acceleration, whereby each increment of warming increases the probability of even faster future warming. Such behavior is characteristic of complex systems approaching critical thresholds, where positive feedbacks begin to dominate stabilizing processes. In this framework, ocean heat content becomes not merely a measure of accumulated warming but a leading indicator of the Earth’s movement toward an increasingly unstable climatic regime.
This study evaluates historical observations of ocean heat content to determine whether a measurable decline in doubling time has already emerged. If confirmed, the results would provide quantitative evidence that the Earth’s energy imbalance is intensifying faster than predicted by linear models, with profound implications for future sea-level rise, marine ecosystems, atmospheric circulation, and the frequency and severity of extreme weather worldwide.
Climate events that were once considered exceptionally rare are occurring with increasing regularity, lasting longer, and causing greater destruction.
Introduction
One of the most useful tools in science is the normal distribution, better known as the bell curve. It provides a simple way to visualize how observations are distributed around an average and how the probability of extreme events changes when the distribution itself changes.
Climate change is often described as a rise in average global temperature. While that is true, it tells only part of the story. The more important change is statistical: the entire temperature distribution is shifting toward warmer conditions while simultaneously becoming right-skewed. In other words, not only are average temperatures increasing, but extreme heat events are becoming disproportionately more common and more intense, while extreme cold events become increasingly rare.
Understanding this change in the shape of the bell curve helps explain why today’s climate is producing so many record-breaking heat waves, marine heatwaves, droughts, wildfires, and heavy rainfall events. The average is moving—but the extremes are changing even faster.
Bell Curves
Bell curves, more formally known as normal (Gaussian) distributions, are used to describe situations where most observations cluster around a central average (the mean), while increasingly rare events occur symmetrically toward both extremes. In a stable climate regime, temperatures naturally fluctuate around a long-term average, producing a familiar bell-shaped distribution with approximately equal probabilities of unusually cold and unusually hot events.
When a bell curve becomes distorted and extends farther toward higher values, it is called a positively skewed (or right-skewed) distribution. In this case, the distribution is no longer symmetrical, indicating that extreme high values occur more frequently or reach much greater magnitudes than extreme low values.
Characteristics of a Right-Skewed Distribution
Long, broad right tail: Extreme high values become more frequent and more severe, producing a wider, heavier right tail.
Compressed left tail: Extremely low values become increasingly rare, resulting in a shorter, thinner left tail.
Shifted average: The entire distribution moves toward higher values, indicating that average conditions have become warmer.
Statistical relationship: The long right tail pulls the arithmetic mean upward, producing the relationship:Mean > Median > Mode
Familiar Examples
Wealth distribution: Most people have relatively modest net worth, while a small number of multimillionaires and billionaires create a long, heavy right tail.
Insurance losses from natural disasters: Most weather events cause little or no damage, but a handful of catastrophic hurricanes, floods, and wildfires account for a disproportionately large share of total economic losses.
Climate extremes: As the climate warms, temperature distributions shift toward warmer conditions while also becoming increasingly right-skewed, making extreme heat events disproportionately more common than extreme cold events.
Implications
The implications extend far beyond temperature alone. The left and right tails of the distribution represent the probabilities of all climate extremes, not just unusually cold or hot days. As the climate system warms and the distribution becomes increasingly right-skewed, the probability of high-impact events shifts dramatically.
Extreme heat waves, marine heatwaves, intense rainfall, flash flooding, atmospheric rivers, severe droughts, wildfire conditions, and the most powerful tropical cyclones are becoming more frequent, more intense, and longer-lasting. As the right tail of the distribution expands in both length (greater extremes) and breadth (greater frequency), events that were once considered exceptionally rare are occurring with increasing regularity, lasting longer, and causing greater destruction.
This change in the probability distribution helps explain why record-breaking events are occurring with unprecedented frequency. A simple shift of the bell curve would increase average temperatures, but the emergence of a broad, heavy right tail fundamentally changes the odds. The climate system is no longer producing merely warmer versions of past weather—it is generating a growing number of events that fall far outside the historical range of experience. The result is an increasing concentration of record-breaking extremes that disproportionately drive human, economic, and ecological impacts.
Nonlinear Acceleration and the Expanding Right Tail
The right-skewed distribution provides a useful statistical framework for understanding the Nonlinear Acceleration Hypothesis. If climate change simply shifted the bell curve toward warmer temperatures, we would expect a proportional increase in hot weather. Instead, observations increasingly suggest that the distribution is not only shifting—it is also becoming increasingly asymmetric. The expanding right tail indicates that the probability of extreme events is growing faster than the increase in the mean itself. This is the statistical signature of nonlinear change: each increment of warming produces a disproportionately larger increase in the frequency, intensity, duration, and geographic extent of extreme weather events.
The physical explanation lies in the interconnected nature of the Earth’s climate system. As temperatures rise, reinforcing feedback mechanisms begin interacting with one another rather than operating independently. Increased atmospheric water vapor amplifies heavy rainfall. Hotter oceans fuel stronger tropical cyclones and marine heatwaves. Droughts increase wildfire activity, while wildfire emissions further degrade air quality and contribute additional greenhouse gases. Loss of snow and sea ice reduces planetary reflectivity, allowing more solar energy to be absorbed. Permafrost thaw releases methane and carbon dioxide, further accelerating warming. Each feedback amplifies others, creating a cascading sequence of reinforcing processes.
This domino effect causes the right tail of the distribution to expand in both length and breadth. The tail becomes longer because events are reaching unprecedented levels of severity. It becomes broader because these extreme events are occurring more frequently across larger regions and persisting for longer periods. In statistical terms, the climate system is producing an increasing number of observations far beyond the historical range—not because weather has become more random, but because the underlying probability distribution itself has been fundamentally altered.
The result is a transition from a climate characterized by relatively independent weather extremes to one increasingly dominated by compound and cascading events. Heat waves intensify drought, drought fuels wildfire, wildfire degrades air quality and alters cloud formation, while heat simultaneously increases atmospheric moisture that later falls in more intense rainfall and flash flooding. Each event raises the probability or severity of the next, creating chains of interacting hazards. These cascading impacts are precisely what one would expect if the climate system is undergoing nonlinear acceleration driven by reinforcing feedbacks.
Viewed through this framework, the expanding right tail is more than a statistical curiosity—it is the observable fingerprint of a climate system moving away from historical equilibrium. As positive feedbacks strengthen and tipping elements become increasingly interconnected, the distribution of climate extremes evolves from a simple bell curve into one dominated by an increasingly heavy right tail, where the largest and most damaging events become disproportionately more common.
Interpreting the Diagram
The accompanying figure illustrates the transition from a historical climate regime to a modern climate regime.
The blue curve represents the historical climate, approximating a normal distribution with cold extremes on the left, hot extremes on the right, and average temperatures centered near the middle.
The red curve represents the emerging climate regime. Rather than simply shifting toward warmer temperatures, the distribution also changes shape. The entire curve moves to the right, indicating that average temperatures have increased. More importantly, the distribution becomes positively skewed: the left (cold) tail becomes shorter and thinner as extreme cold events become less frequent, while the right (hot) tail becomes broader, heavier, and extends farther into the range of extreme heat.
This distinction is important. Climate change is not merely increasing average temperatures—it is fundamentally changing the probability distribution itself. As a result, record-breaking heat becomes far more likely than would be expected from a simple shift in the average alone, while record-breaking cold becomes increasingly uncommon. Climate events that were once considered exceptionally rare are occurring with increasing regularity, lasting longer, and causing greater destruction.
Philadelphia is forecast to experience a critical heat emergency on July 4, with heat index values expected to reach 91–95°F under dangerously humid conditions. Even modest physical exertion outdoors can increase the risk of heat exhaustion, heat stroke, and, in severe cases, death.
Extreme heat is more than uncomfortable—it is one of the deadliest weather hazards. Beyond its immediate health risks, exposure to extreme heat accelerates biological aging by increasing cellular stress, damaging tissues, and contributing to telomere shortening.
What Is FIFA Doing?
Rather than postponing the Round of 16 match, FIFA plans to proceed while implementing heat mitigation measures for players and spectators.
Player Safety Measures
Mandatory Hydration Breaks: FIFA requires official cooling and hydration breaks during matches when heat conditions warrant them to reduce the risk of heat-related illness.
Sideline Cooling: Philadelphia Stadium (Lincoln Financial Field) has installed cooling benches along the sidelines, allowing substituted players and those receiving treatment to lower their body temperature more quickly.
Fan Safety Measures
Outside Water Restrictions: Despite the dangerous heat, FIFA has updated its stadium code of conduct to prohibit spectators from bringing outside or reusable plastic water bottles into the stadium for refilling. Fans must instead obtain drinking water through stadium concessions and designated distribution points.
Weather Monitoring: Organizers are coordinating with the National Weather Service because the combination of extreme heat and the potential for severe Fourth of July thunderstorms could require temporary suspensions of play or crowd sheltering if lightning is detected within FIFA’s safety perimeter.
Cooling Centers: The City of Philadelphia is operating additional medical stations and cooling areas throughout the stadium complex and at the FIFA Fan Festival at Lemon Hill to assist visitors experiencing heat stress.
Heat Is a Serious Public Health Hazard
Hydration, shade, and cooling breaks help reduce risk, but they cannot eliminate it. Anyone attending outdoor events should avoid unnecessary exertion, drink fluids before becoming thirsty, seek shade whenever possible, and recognize the warning signs of heat exhaustion and heat stroke.
Climate change is making extreme heat events more frequent, longer-lasting, and more humid. As temperatures continue to rise, organizers of major outdoor sporting events will increasingly face difficult decisions about balancing competition with public safety.
Regardless of the precautions taken, exposing athletes, officials, and tens of thousands of spectators to unnecessary risk during a critical heat emergency is difficult to justify. Hydration breaks and cooling stations can reduce risk, but they cannot eliminate it. When dangerous heat reaches levels known to threaten human health, the responsible course of action is to postpone play until conditions are safe. No sporting event is worth risking heat-related illness, permanent injury, or loss of life.
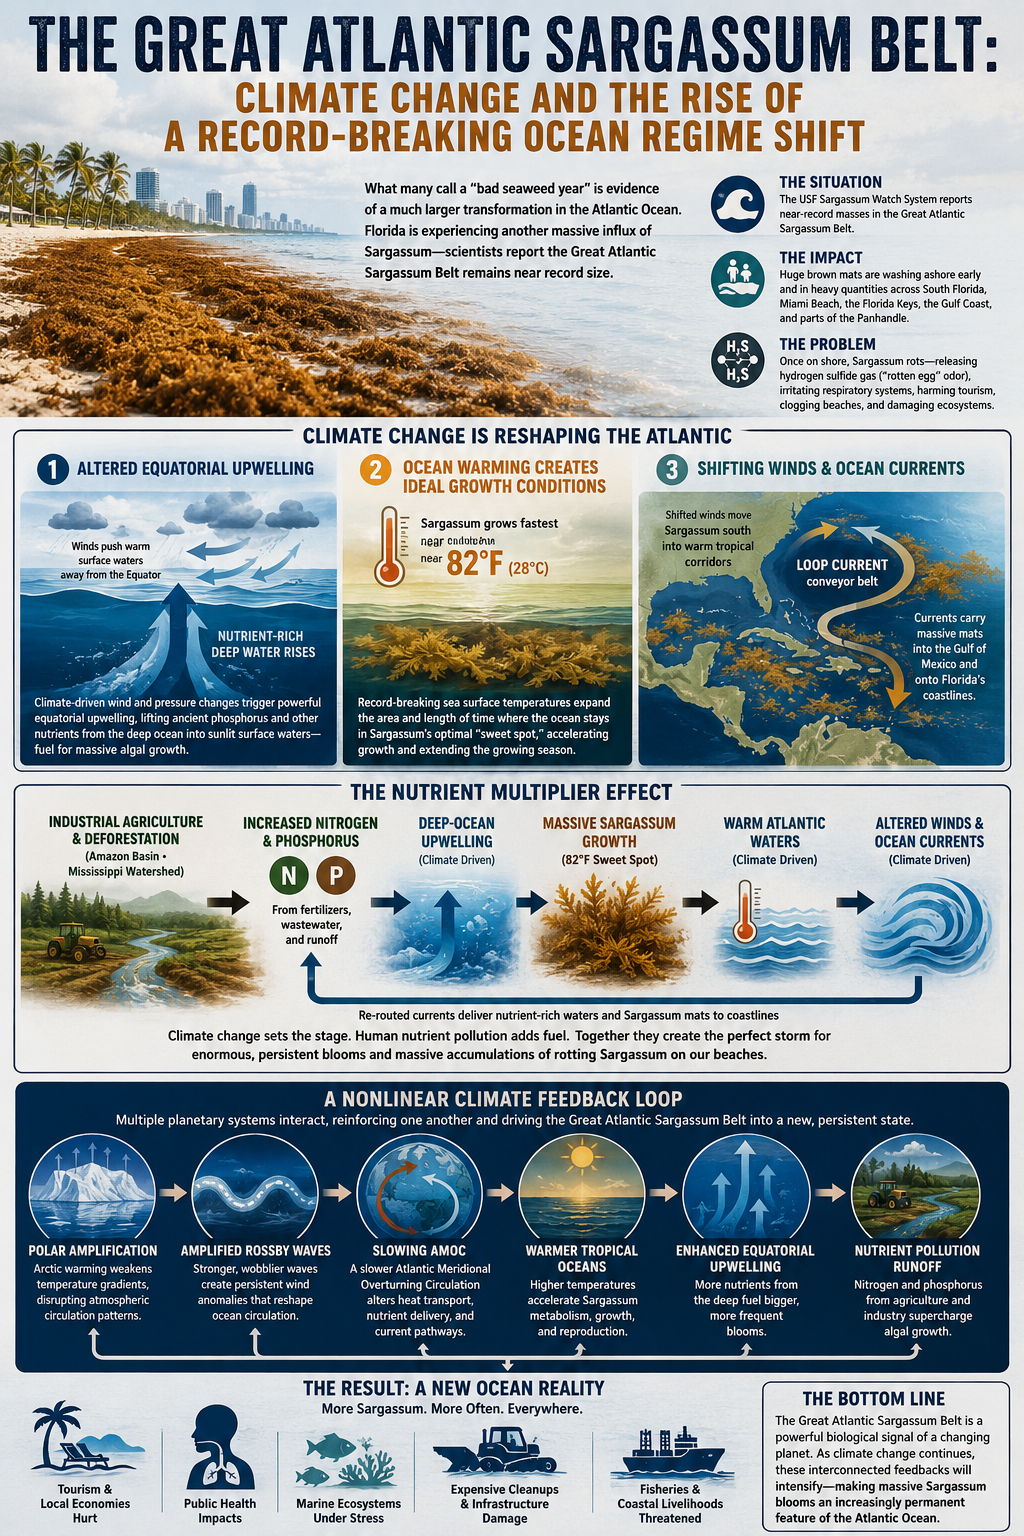
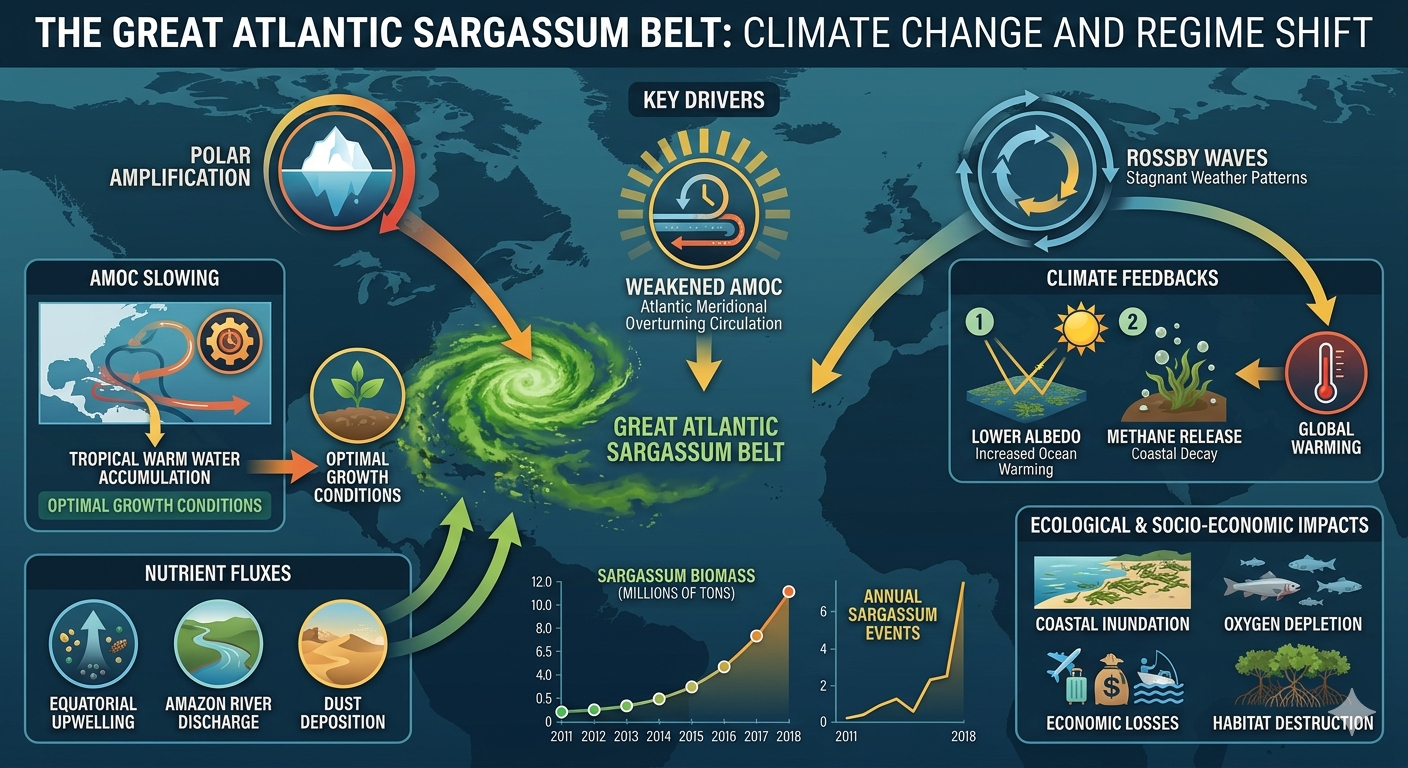
What many beachgoers describe as a “bad seaweed year” is actually evidence of a much larger transformation occurring across the Atlantic Ocean. Florida is experiencing another massive influx of Sargassum, and scientists monitoring the phenomenon report that the Great Atlantic Sargassum Belt remains near record size. Rather than an isolated event, this represents an emerging oceanic regime shift driven by climate change, altered ocean circulation, and increasing nutrient pollution.
Florida’s Record-Breaking Sargassum Season
The University of South Florida’s Sargassum Watch System reports that the Great Atlantic Sargassum Belt continues to contain near-record amounts of floating macroalgae.
Massive brown mats have already washed ashore across South Florida, Miami Beach, the Florida Keys, the Gulf Coast, and portions of the Florida Panhandle. While Sargassum provides important habitat for marine life while floating offshore, conditions change dramatically once it reaches land.
As the seaweed accumulates on beaches, it begins to decompose, releasing hydrogen sulfide gas, the source of the familiar “rotten egg” odor. The gas can irritate the eyes and respiratory system, reduce tourism, damage coastal ecosystems, and require costly cleanup efforts.
Climate Change Is Reshaping the Atlantic
Researchers increasingly recognize the explosive growth of the Great Atlantic Sargassum Belt as the product of multiple interacting climate processes rather than a single environmental change.
1. Altered Equatorial Upwelling
The Mechanism
Climate change is modifying major ocean-atmosphere circulation patterns, altering the timing and strength of equatorial upwelling.
Changes in atmospheric pressure systems—including the North Atlantic Oscillation—produce persistent wind anomalies that push warm surface waters away from the equator. This allows colder, nutrient-rich water from the deep ocean to rise toward the surface.
The Impact
This upwelling functions like a giant ocean elevator, transporting enormous quantities of phosphorus and other nutrients that have accumulated in deep water over centuries into the sunlit surface ocean where Sargassum thrives.
The result is a dramatic increase in the nutrient supply available for rapid algal growth.
2. Ocean Warming Creates Ideal Growth Conditions
The Mechanism
Sea surface temperatures across the tropical Atlantic have repeatedly reached record highs.
The Impact
Sargassum grows fastest near 82°F (28°C), an optimal metabolic temperature.
As climate change warms the Atlantic, larger areas of the ocean remain within this ideal temperature range for longer periods each year. This lengthens the growing season while expanding the geographic area capable of supporting explosive biomass production.
Warmer water not only accelerates growth—it also allows the algae to persist farther north and for much longer portions of the year.
3. Shifting Winds and Ocean Currents
The Mechanism
Global warming is altering atmospheric circulation, trade winds, and large-scale ocean currents throughout the Atlantic Basin.
The Impact
Historically, much of the Atlantic’s Sargassum remained confined within the cooler waters of the Sargasso Sea.
Today, changing wind patterns and ocean circulation have shifted massive “seed populations” into warmer tropical waters where growth rates are substantially higher.
Ocean currents—including the Caribbean Current, the Gulf Stream, and especially the Loop Current—then act as high-speed conveyor belts that transport enormous floating mats directly toward the Gulf of Mexico and Florida’s coastlines.
Climate change supplies the physical conditions necessary for explosive Sargassum growth, but human nutrient pollution greatly amplifies the process.
Agricultural fertilizer runoff, wastewater discharge, and deforestation throughout the Amazon and Mississippi River basins deliver enormous quantities of nitrogen and phosphorus into the Atlantic.
When these nutrient-rich waters combine with warmer ocean temperatures and increased deep-ocean nutrient upwelling, they create ideal conditions for sustained, large-scale algal blooms.
A Nonlinear Climate Feedback
The expansion of the Great Atlantic Sargassum Belt is not simply another symptom of a warming planet. It represents a nonlinear ecological feedback in which multiple climate systems reinforce one another.
Several large-scale climate processes appear to be working together:
Polar amplification alters atmospheric circulation across the Northern Hemisphere.
Amplified Rossby waves produce more persistent wind anomalies that reshape ocean circulation.
A slowing Atlantic Meridional Overturning Circulation (AMOC) changes nutrient transport, sea surface temperatures, and Atlantic current pathways.
Warmer tropical oceans accelerate Sargassum metabolism and reproduction.
Enhanced equatorial upwelling delivers nutrient-rich deep water to the surface.
Agricultural and industrial nutrient runoff provides an additional fertilizer source that further accelerates growth.
Each process strengthens the others, producing a classic positive feedback loop that drives increasingly frequent and larger Sargassum blooms.
Conclusion
The Great Atlantic Sargassum Belt is no longer an occasional natural curiosity. It has become one of the clearest biological indicators that the Atlantic Ocean is undergoing a fundamental climatic transformation.
What was once a relatively stable ecosystem has shifted into a new state characterized by warmer waters, altered circulation, enhanced nutrient transport, and unprecedented macroalgal production. The resulting seaweed invasions are affecting tourism, public health, fisheries, coastal infrastructure, and marine ecosystems across the Caribbean, Gulf of Mexico, and southeastern United States.
Far from being an isolated nuisance, record-breaking Sargassum demonstrates how climate change can reorganize entire ocean systems. As warming continues, these interconnected feedbacks are likely to intensify, making massive seasonal Sargassum blooms an increasingly permanent feature of the Atlantic Ocean.
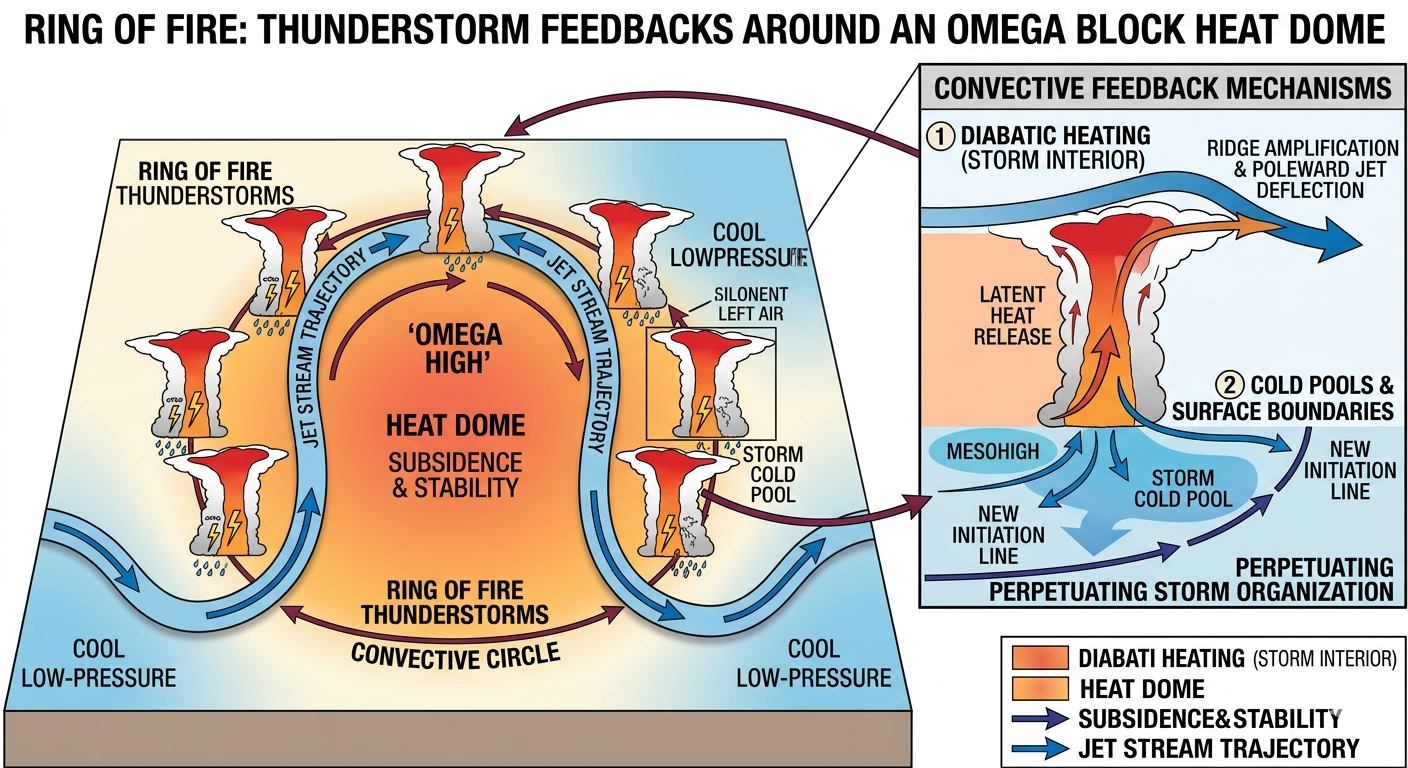
In meteorology, a Ring of Fire describes a recurring pattern in which clusters of powerful thunderstorms repeatedly develop and travel around the outer edge of a large, stationary high-pressure system. These storms form where extremely hot, dry air beneath the heat dome collides with cooler, moisture-rich air circulating around its perimeter.
The pattern becomes especially dangerous when the high-pressure system takes the form of an Omega block, named because the jet stream bends into a shape resembling the Greek letter Ω. In this configuration, the jet stream stalls, leaving a massive dome of sinking air trapped beneath the center of the ridge. The descending air continuously compresses and warms, suppressing cloud formation and preventing thunderstorms from developing over the core of the heat dome.
Unable to penetrate this atmospheric “cap,” storms are instead forced to travel around the edge of the dome, following the path of the jet stream. The result is a nearly continuous corridor of severe thunderstorms that circles the stagnant high-pressure system like a racetrack.
How the “Ring of Fire” Works
             JET STREAM / TRACK OF REPEATED THUNDERSTORMS

          ⚡      ⚡      ⚡      ⚡      ⚡      ⚡      ⚡
       ▲                                                ▼

  LOW PRESSURE      ←  RING OF FIRE  →        LOW PRESSURE
  Cool, Unstable Air                     Cool, Unstable Air

                ┌──────────────────────────────┐
                │      OMEGA HEAT DOME         │
                │                              │
                │   Sinking, Warming Air       │
                │   Clear Skies • Extreme Heat │
                │   Atmospheric "Cap"          │
                └──────────────────────────────┘
The Core: The Atmospheric Cap
At the center of the Omega block, air continuously sinks toward the surface. As it descends, it is compressed and warms adiabatically, evaporating clouds and stabilizing the atmosphere. This suppresses thunderstorm development, producing prolonged periods of cloud-free skies, intense solar heating, record-breaking temperatures, and worsening drought conditions.
The Ring: A Corridor of Explosive Storms
Along the outer edge of the heat dome, the hot, dry air meets cooler, more humid, and unstable air associated with surrounding low-pressure troughs. The sharp temperature and moisture contrasts create an ideal environment for rapid thunderstorm development. Abundant atmospheric moisture—enhanced by warmer oceans and increased evaporation—provides enormous latent heat that fuels severe convection. The result is repeated outbreaks of supercell thunderstorms, mesoscale convective systems (MCSs), derechos, torrential rainfall, large hail, and frequent lightning.
The “Train Track” Effect
Because Omega blocks often remain stationary for days or even weeks, the jet stream changes very little. New thunderstorms repeatedly form along the same atmospheric boundary and follow nearly identical paths. Meteorologists refer to this as training, because successive storms move over the same locations like railroad cars on a track. This dramatically increases the risk of catastrophic flash flooding, even when individual storms are moving rapidly.
Feedback Example
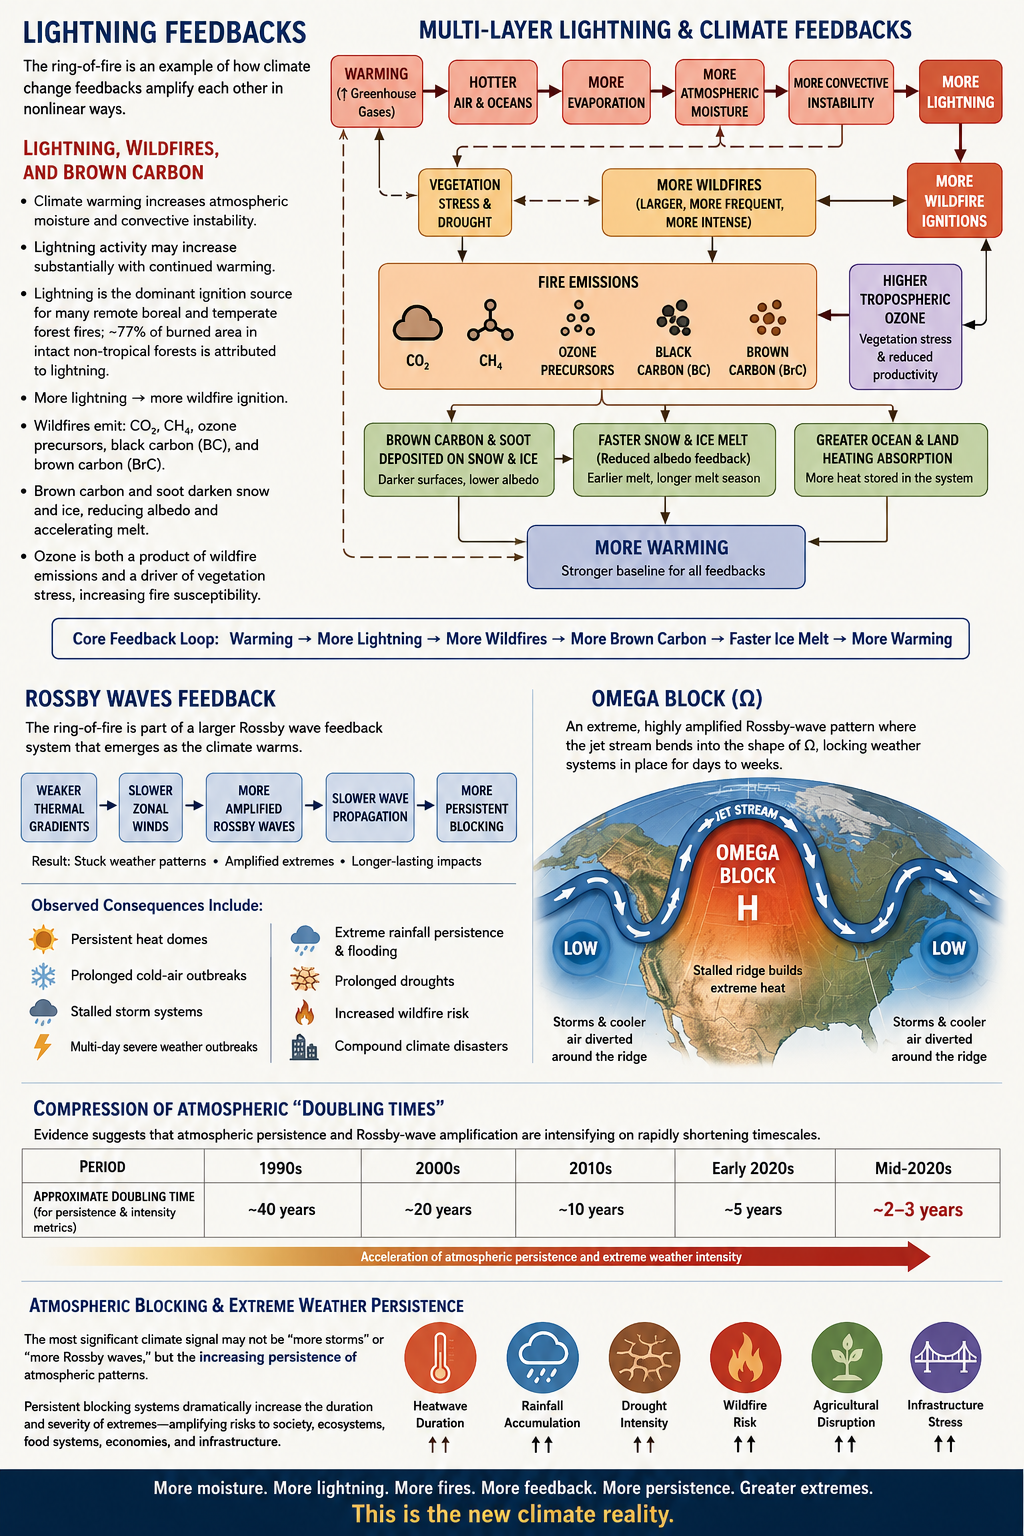
The Ring-of-Fire provides a simple, observable example of a positive feedback loop in the atmosphere. At its core is a convective circulation—a self-reinforcing loop driven by thermal energy that is increasingly amplified by a warming climate. As warmer air rises, it fuels stronger convection, transporting heat and moisture higher into the atmosphere. That energy is ultimately released in the form of lightning, thunder, intense rainfall, and powerful updrafts. In this way, the convective loop serves as a visible reminder of how additional heat in the climate system can translate into more energetic and destructive weather.
Repeated severe thunderstorms and mesoscale convective systems
Derechos, destructive straight-line winds, large hail, prolific lightning, tornadoes, and catastrophic flash flooding
As climate change intensifies heat waves and increases atmospheric moisture through the Clausius–Clapeyron relationship, Ring of Fire events are becoming increasingly energetic. The hotter the heat dome becomes, the greater the temperature contrast along its edge and the more water vapor is available to fuel deep convection. This creates a powerful positive feedback: stronger heat domes produce more intense thunderstorms, while the latent heat released by those storms can further reinforce the large-scale atmospheric circulation, increasing the persistence of both the heat dome and the surrounding Ring of Fire.
Lightning Feedbacks and Climate Change
The Ring of Fire is an example of how Earth’s climate system is increasingly governed by interacting positive feedback loops rather than isolated events. Rising temperatures increase atmospheric moisture and instability, producing more lightning, larger wildfires, and greater emissions of greenhouse gases and light-absorbing aerosols. These processes reinforce one another, accelerating climate change.
Lightning, Wildfires, and Brown Carbon
As the atmosphere warms, evaporation increases according to the Clausius–Clapeyron relationship, allowing the atmosphere to hold approximately 7% more water vapor for every 1°C of warming. The additional moisture provides more latent heat to developing thunderstorms, increasing convective instability and the likelihood of lightning.
Multiple studies project that lightning activity will increase substantially as global temperatures continue to rise. This has consequences that extend far beyond severe weather.
Lightning is already the primary natural ignition source for many remote boreal and temperate forests. In intact non-tropical forests, approximately 77% of the burned area has been attributed to lightning-caused fires. As lightning becomes more frequent, wildfire ignitions are expected to increase, particularly in regions already stressed by prolonged heat and drought.
Wildfires release enormous quantities of:
Carbon dioxide (CO₂)
Methane (CH₄)
Ozone precursors (NOₓ and VOCs)
Black carbon (soot)
Brown carbon (organic aerosols)
These emissions strengthen several reinforcing climate feedbacks.
Carbon dioxide and methane increase greenhouse warming. Nitrogen oxides and volatile organic compounds promote the formation of tropospheric ozone, which damages vegetation, reduces carbon uptake, and increases drought stress. Black carbon and brown carbon settle onto snow and ice, darkening their surfaces, lowering albedo, and accelerating melting. Earlier snowmelt exposes darker land and ocean surfaces that absorb even more solar energy, producing additional warming.
The result is a cascade of reinforcing feedback loops.
Major Lightning Feedback Loops
Global Warming
      │
      ▼
Warmer Air & Oceans
      │
      ▼
More Evaporation
      │
      ▼
More Atmospheric Moisture
      │
      ▼
Greater Convective Instability
      │
      ▼
More Thunderstorms
      │
      ▼
More Lightning
      │
      ├────────────────────────────────────────────────────────────┐
      ▼                                                            │
More Wildfire Ignitions                                             │
      │                                                            │
      ▼                                                            │
Larger & More Frequent Wildfires                                    │
      │                                                            │
      ├──────────────┬──────────────┬──────────────┬───────────────┐
      ▼              ▼              ▼              ▼               │
More CO₂        More CH₄      More Ozone      More Black & Brown Carbon
      │              │         Precursors             │
      ▼              ▼              │                 ▼
More Greenhouse  More Greenhouse    ▼         Lower Snow & Ice Albedo
   Warming          Warming    More Tropospheric      │
                                  Ozone              ▼
                                     │        Faster Ice Melt
                                     ▼              │
                            Vegetation Stress        ▼
                           Reduced Carbon Uptake  More Solar Absorption
                                     │              │
                                     ▼              ▼
                               Drier Forests ───────────────┐
                                     │                      │
                                     ▼                      │
                             Greater Fire Risk ◄────────────┘
                                     │
                                     ▼
                              More Wildfires
These pathways operate simultaneously, producing multiple reinforcing feedbacks:
Warming → More Lightning → More Wildfires → More CO₂ → More Warming
Warming → More Lightning → More Wildfires → More Methane → More Warming
Warming → More Lightning → More Wildfires → More Brown Carbon → Lower Albedo → Faster Ice Melt → More Warming
Warming → More Lightning → More Wildfires → More Black Carbon → Lower Albedo → More Warming
Warming → More Lightning → More Wildfires → More Ozone → Vegetation Stress → More Wildfires
Warming → More Drought → More Lightning Ignitions → More Wildfires → More Drought
Rather than acting independently, these feedbacks reinforce one another, creating an increasingly nonlinear climate system.
Rossby Wave Feedbacks
The Ring of Fire is itself a product of larger changes occurring within the Rossby wave circulation of the Northern Hemisphere.
Historically, the jet stream flowed progressively from west to east across North America. However, as Arctic amplification reduces the temperature difference between the Arctic and the mid-latitudes, the jet stream weakens and becomes increasingly sinuous.
The resulting changes include:
weaker zonal winds,
larger Rossby-wave amplitudes,
slower wave propagation,
greater atmospheric blocking,
more persistent weather patterns.
These changes allow heat domes, droughts, and storm tracks to remain nearly stationary for days or weeks instead of moving steadily across the continent.
Rossby Wave Feedback
Global Warming
      │
      ▼
Arctic Amplification
      │
      ▼
Reduced Pole-to-Equator Temperature Gradient
      │
      ▼
Slower Jet Stream
      │
      ▼
Larger Rossby Waves
      │
      ▼
More Atmospheric Blocking
      │
      ▼
Persistent Heat Domes
      │
      ├──────────────┐
      ▼              ▼
Longer Droughts   Ring-of-Fire Thunderstorms
      │              │
      ▼              ▼
Greater Fire Risk  More Lightning
      │              │
      └───────► More Wildfires ◄──────────┘
                     │
                     ▼
                More Warming
Atmospheric Persistence and the Compression of Climate Timescales
Perhaps the most important emerging signal is not simply an increase in storms or heat waves, but the increasing persistence of atmospheric circulation patterns.
As blocking events become more common, weather systems remain locked over the same regions for longer periods. Heat waves last longer, rainfall accumulates over the same watersheds, droughts deepen, wildfire seasons lengthen, and infrastructure is exposed to prolonged stress.
Evidence also suggests that the effective timescale over which atmospheric persistence intensifies is shortening.
Period
Approximate Effective Doubling Time
1990s
~40 years
2000s
~20 years
2010s
~10 years
Early 2020s
~5 years
Mid-2020s
~2–3 years
If this trend continues, atmospheric circulation may increasingly favor long-lived, self-reinforcing extremes rather than isolated weather events. In this emerging regime, lightning, wildfire, Rossby-wave amplification, atmospheric blocking, drought, ozone production, and cryosphere loss no longer operate as separate phenomena—they become interconnected components of a rapidly accelerating climate feedback network.
Conclusion
Climate change is often described as a gradual increase in global average temperature. While this description is technically correct, it fails to capture the fundamental transformation now occurring within the Earth’s climate system.
The evidence suggests that climate change is increasingly becoming a problem of interacting feedback loops rather than isolated environmental changes. Rising greenhouse gas concentrations initiate warming, but the warming itself activates numerous secondary processes—including increased atmospheric moisture, stronger convection, more lightning, larger wildfires, greater tropospheric ozone formation, accelerated snow and ice loss, enhanced water vapor, and increasingly persistent atmospheric blocking. Each of these processes amplifies others, producing a climate system whose behavior is increasingly nonlinear.
The Ring of Fire thunderstorm pattern illustrates this transition. What was once considered simply a recurring weather phenomenon now demonstrates how stalled Rossby waves, persistent heat domes, enhanced atmospheric moisture, and explosive convection combine to produce repeated outbreaks of destructive weather. These storms are not isolated anomalies; they are manifestations of a climate system operating under stronger feedbacks than those that characterized the twentieth century.
The same interconnected processes extend across the Earth system. Increased lightning ignites more wildfires. Wildfires emit greenhouse gases, ozone precursors, and light-absorbing aerosols that accelerate warming and cryosphere loss. Tropospheric ozone weakens vegetation, reducing the land’s capacity to absorb carbon while increasing susceptibility to drought and fire. Declining snow and ice reduce planetary albedo, allowing more solar energy to be absorbed by the Earth’s surface. Meanwhile, Arctic amplification weakens the pole-to-equator temperature gradient, slowing the jet stream and increasing the persistence of atmospheric blocking patterns that intensify heat waves, droughts, floods, and wildfire conditions.
Perhaps the most significant finding is not that individual extreme events are becoming more severe, but that the duration and persistence of atmospheric patterns are increasing. Weather systems that historically moved across continents in a matter of days are increasingly becoming locked in place. The resulting accumulation of heat, rainfall, drought, and ecological stress transforms ordinary weather hazards into compound disasters whose impacts greatly exceed the sum of their individual components.
Viewed together, these observations suggest that the Earth’s climate is undergoing a transition from a system dominated primarily by external forcing to one increasingly shaped by internally generated positive feedbacks. The atmosphere, oceans, cryosphere, and biosphere are no longer responding independently; they are becoming more tightly coupled, allowing disturbances in one component to propagate rapidly throughout the entire climate system.
Understanding these interactions is essential for improving climate projections. Traditional approaches that evaluate individual feedbacks in isolation may underestimate future risks if they fail to capture the compounding effects that emerge when multiple feedbacks operate simultaneously. Future research should therefore place greater emphasis on coupled Earth-system dynamics, atmospheric persistence, feedback interactions, and potential tipping behavior.
The challenge facing society is not merely adapting to a warmer climate, but adapting to a climate that is becoming increasingly dynamic, interconnected, and persistent. As feedback loops strengthen, the distinction between weather and climate becomes increasingly blurred, with prolonged heat waves, wildfire outbreaks, extreme rainfall, and atmospheric blocking evolving from episodic events into defining characteristics of a new climatic regime.
Recognizing climate change as a network of interacting feedbacks rather than a collection of isolated trends provides a more complete framework for understanding the accelerating pace of observed change. It is this systems-level perspective that will be essential for improving prediction, informing policy, strengthening resilience, and reducing the long-term risks posed by a rapidly evolving Earth system.