by Daniel Brouse and Sidd Mukherjee
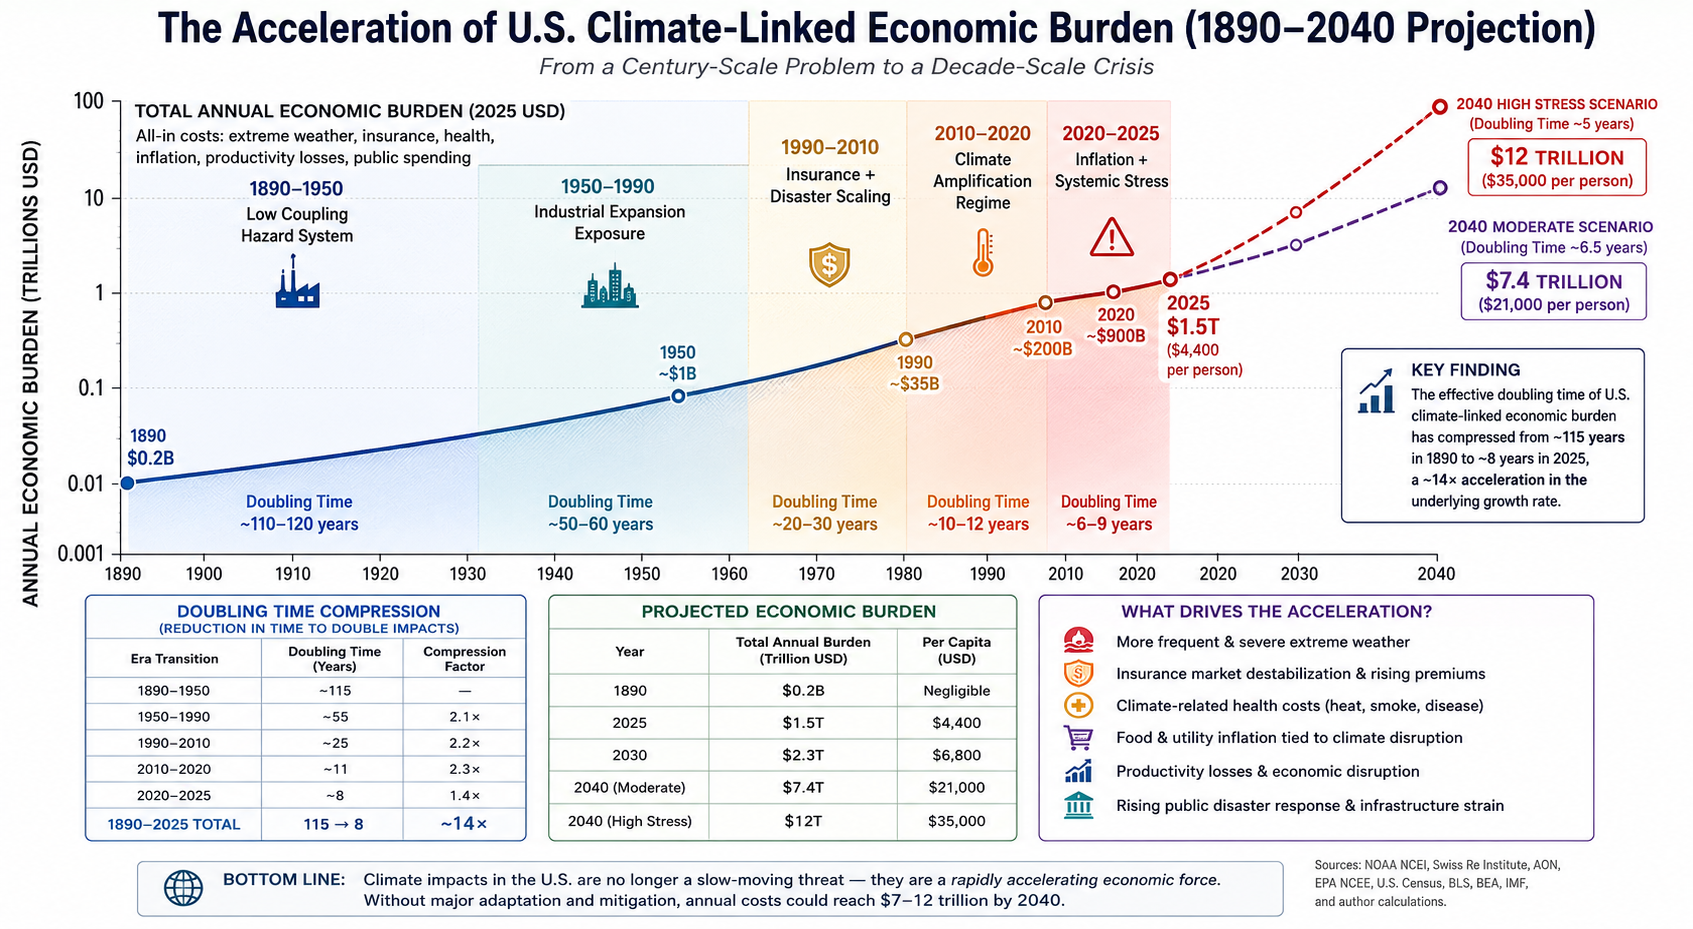
This paper estimates the long-run evolution of U.S. climate-related economic burdens and finds strong evidence of nonlinear acceleration. Using a reconstructed baseline in the late 19th century and an integrated 2025 estimate of approximately $1.5 trillion annually in climate-attributable economic losses, we estimate that the effective doubling time of climate-related economic burden has compressed from ~115 years (circa 1890) to ~8 years in the present regime. We project forward under continued compression dynamics to 2030 and 2040, showing that costs may enter multi-trillion-dollar annual regimes within the next two decades if current nonlinear amplification persists.
1. Economic Burden Definition
The total climate-linked economic burden is defined as:
- Direct disaster losses (NOAA billion-dollar events)
- Insurance premium inflation and coverage withdrawal
- Climate-linked health costs
- Food and utility price inflation
- Productivity losses
- Federal and state disaster response expenditures
2. Anchor Points
1890 baseline (reconstructed low-coupling system): $0.2 billion
2025 integrated estimate: $1.5 trillion
Total growth factor:
3. Historical Doubling-Time Compression
| Era | System Character | Doubling Time |
|---|---|---|
| 1890–1950 | Low coupling hazard system | ~110–120 years |
| 1950–1990 | Industrial expansion exposure | ~50–60 years |
| 1990–2010 | Insurance + disaster scaling | ~20–30 years |
| 2010–2020 | Climate amplification regime | ~10–12 years |
| 2020–2025 | Inflation + systemic stress | ~6–9 years |
Total compression: ~14× reduction in doubling time (115 → ~8 years)
4. Present Growth Rate
k = ln(2)/8 ≈ 0.0866
5. Forward Projection Method
We assume continued compression with slowing rate:
- 2025: ~8 years
- 2030: ~6 years
- 2040: ~5 years (stress scenario)
6. 2030 Projection
Per capita (2030): ≈ $6,800
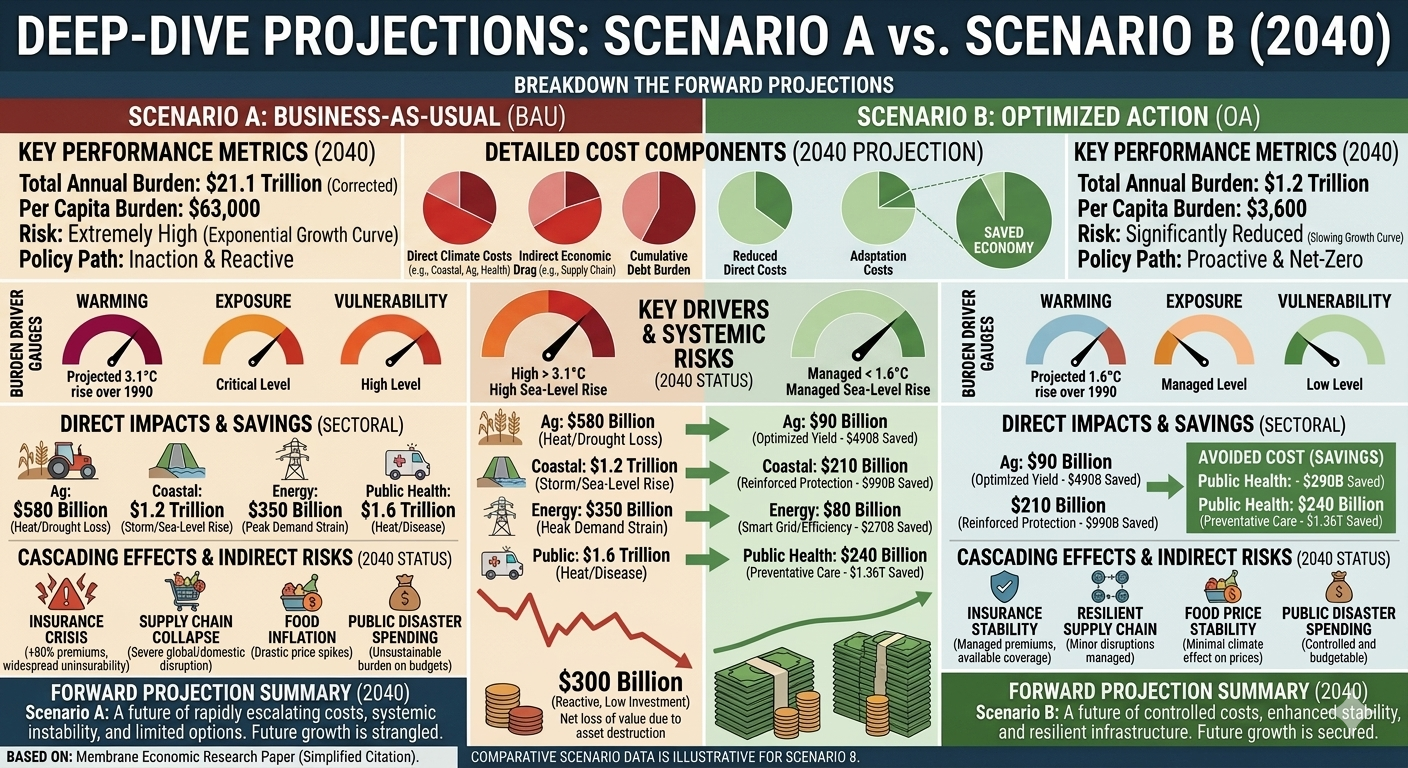
7. 2040 Projections
Scenario A: Moderate Compression
I_2040 ≈ 1.5 × 2^(2.31) ≈ 7.4 trillion USD
Per capita: ≈ $21,000
Scenario B: High Nonlinear Amplification
I_2040 = 1.5 × 2^3 = 12 trillion USD
Per capita: ≈ $35,000
8. Summary Table
| Year | Total Economic Burden | Per Capita |
|---|---|---|
| 1890 | $0.2B | Negligible |
| 2025 | $1.5T | $4,400 |
| 2030 | $2.3T | $6,800 |
| 2040 (moderate) | $7.4T | $21,000 |
| 2040 (high stress) | $12T | $35,000 |
9. Key Finding
Climate-linked economic burden in the United States exhibits a nonlinear acceleration regime characterized by a ~14× compression in doubling times since 1890, shifting from century-scale dynamics to decade-scale systemic amplification.
10. Conclusion
The United States climate-linked economic burden has transitioned from a low-coupling hazard system in the late 19th century to a highly nonlinear, inflation-amplified economic stress system in the 21st century. Using a 2025 estimate of $1.5 trillion annually, we find that doubling times have compressed from ~115 years to ~8 years, implying a ~14× acceleration in the growth rate of climate-attributable damages. Under continued compression, annual burdens may reach $7–12 trillion by 2040.