By Daniel Brouse and Sidd Mukherjee
Abstract
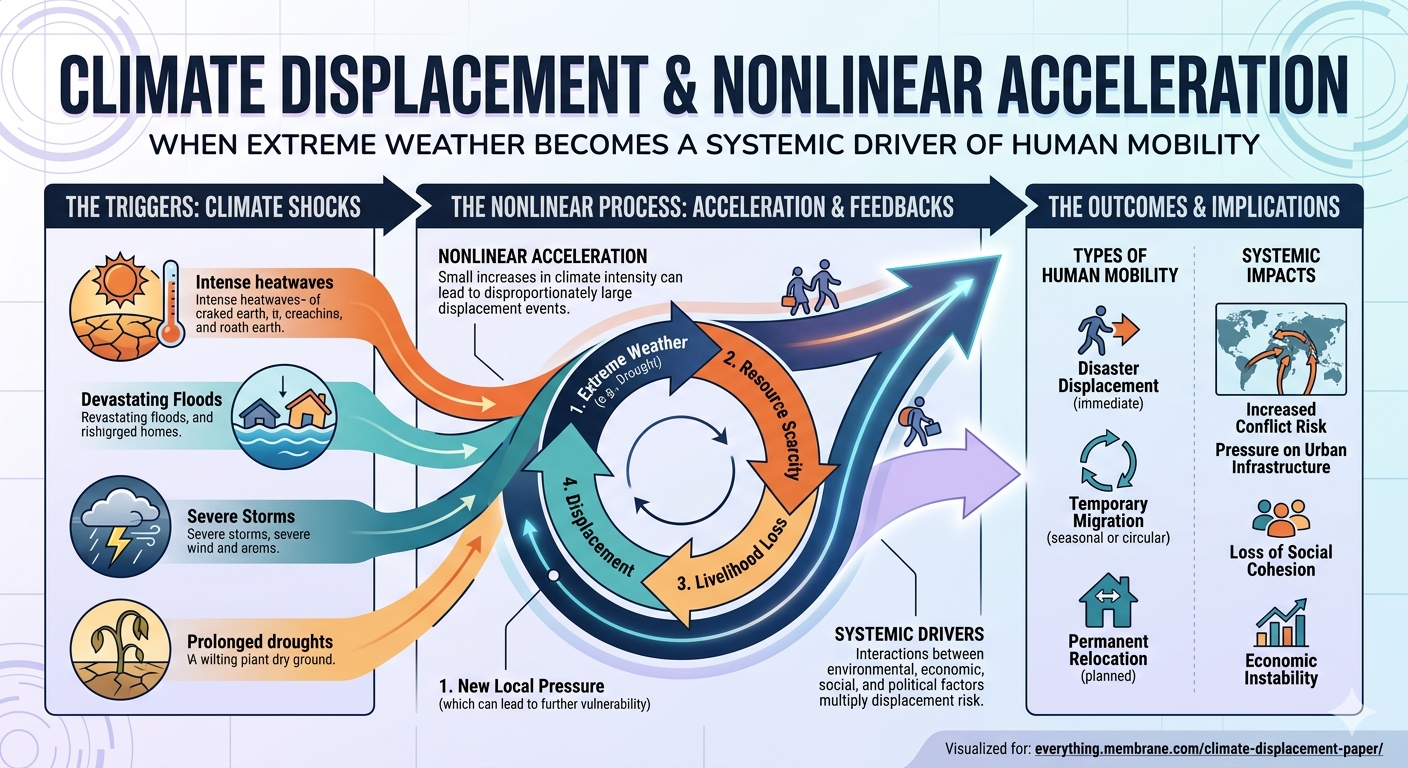
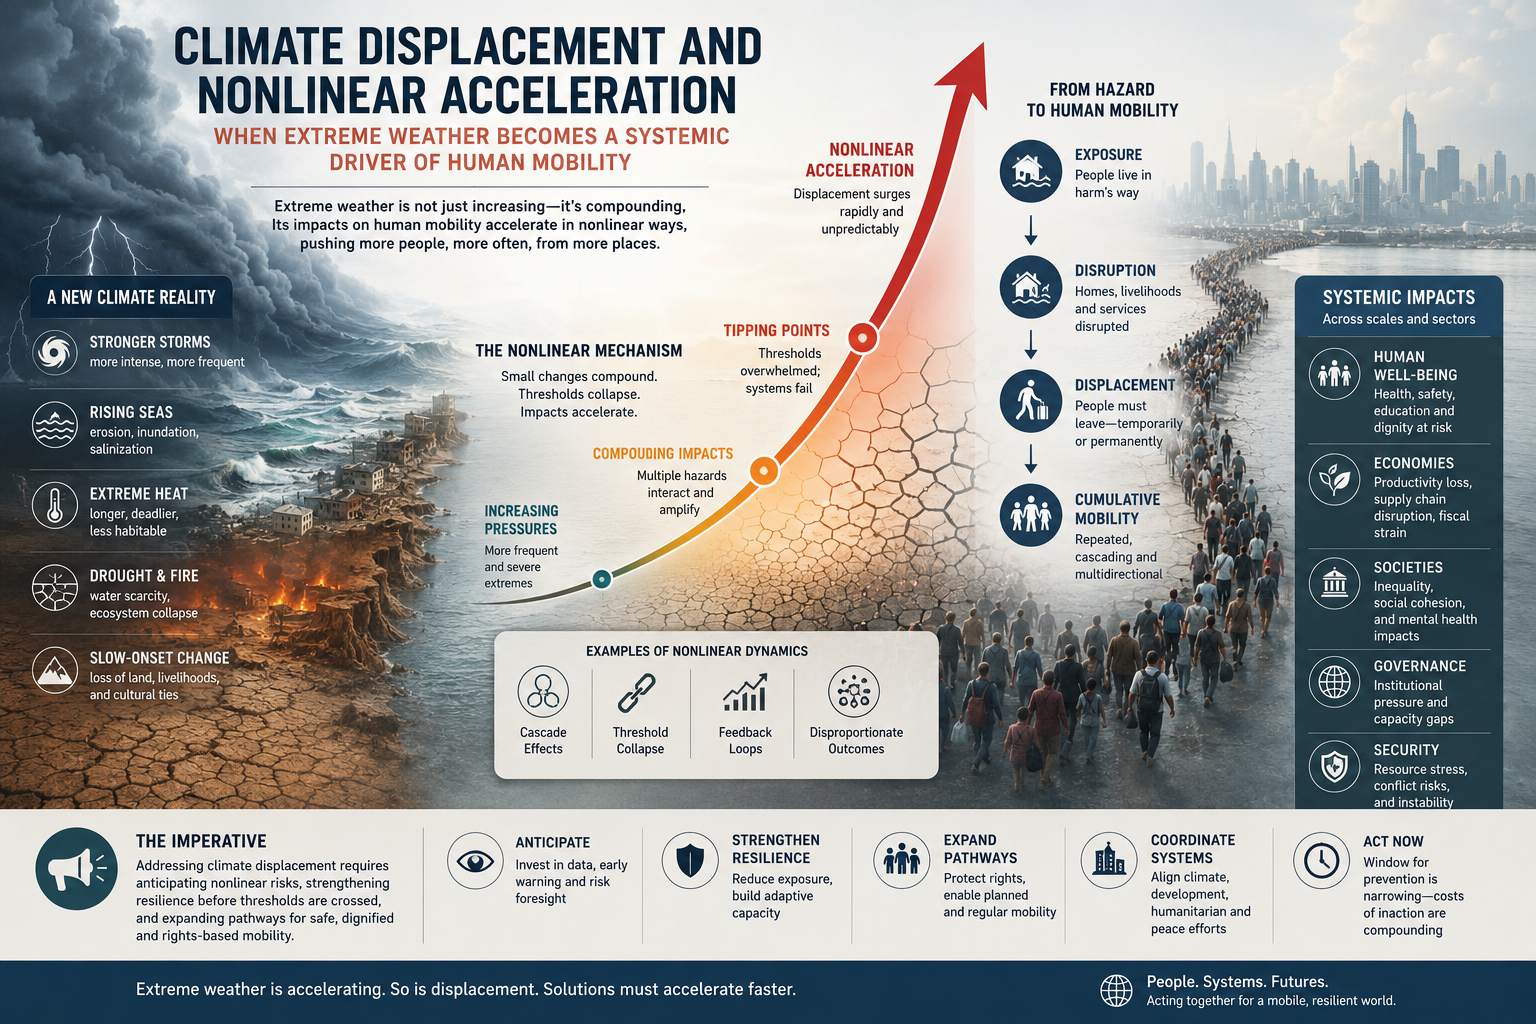
Climate displacement is often framed as a humanitarian consequence of storms, floods, droughts, wildfires, and sea-level rise. That framing is correct but incomplete. The deeper problem is that climate displacement is increasingly emerging from a nonlinear Earth system in which multiple climate hazards are intensifying simultaneously and interacting with preexisting social, political, economic, and infrastructural vulnerabilities.
Recent displacement data suggest that the world may be entering a new phase of climate-driven mobility. According to the Internal Displacement Monitoring Centre (IDMC), 13.6 million people were living in internal displacement because of disasters at the end of 2025, up sharply from roughly 9.9 million at the end of 2024. At the same time, 82.2 million people worldwide were living away from their home communities because of conflict, violence, or disasters, the second-highest figure ever recorded. These numbers do not merely reflect isolated weather events. They reflect a world in which climatic shocks are becoming more frequent, more intense, and increasingly entangled with food insecurity, weak infrastructure, repeated recovery failures, and declining social resilience.
This paper argues that climate displacement should be understood not as a linear byproduct of warming, but as a nonlinear acceleration problem. As the climate system warms, extreme events do not simply increase in number; they increasingly interact across sectors and timescales. Drought is followed by flood. Heat is followed by crop failure. Wildfire is followed by erosion and debris flows. Sea-level rise magnifies storm surge. Water scarcity amplifies political instability. The result is not a single hazard but a cascade of hazards capable of overwhelming adaptation systems and forcing repeated human movement. In that sense, displacement is one of the clearest social indicators that climate change is no longer acting as a distant environmental stressor. It is becoming a systemic destabilizer.
1. Introduction: Displacement as a Climate-System Signal
Most climate discussions still treat displacement as a downstream consequence of weather disasters. A cyclone strikes, homes are destroyed, and people flee. A flood submerges cropland, and communities relocate. A drought persists, livelihoods collapse, and migration follows.
That sequence is real, but it understates the scale of what is now occurring.
Displacement is increasingly best understood as a systems-level indicator. It measures not only the physical impact of a storm, flood, drought, wildfire, or heatwave, but also the failure of social and ecological buffers that once absorbed those shocks. When households are forced to move, it means a threshold has been crossed: infrastructure failed, livelihoods failed, food systems failed, water systems failed, governance failed, or some combination of the above failed at once.
The 2026 Global Report on Internal Displacement provides a stark snapshot of this process. By the end of 2025, 82.2 million people were living in internal displacement across 104 countries and territories. Of those, 68.6 million were displaced by conflict and violence and 13.6 million by disasters. The global total remained near historic highs, while the stock of people displaced by disasters rose sharply. Meanwhile, IDMC recorded 65.8 million internal displacements during 2025, including disaster- and conflict-related movements, underscoring the scale of repeated uprooting in a single year.
The central question is not simply how many people are displaced by climate-related disasters in a given year. The more important question is whether the underlying drivers of displacement are themselves accelerating nonlinearly.
2. The Data: A Sharp Rise in Disaster Displacement
According to IDMC, nearly 13.6 million people were still living in internal displacement at the end of 2025 because of disasters, compared with roughly 9.9 million at the end of 2024. That is an increase of about 3.7 million people in a single year, or approximately 37–38 percent.
This matters for two reasons.
First, it suggests that the consequences of disasters are becoming more persistent. Many people are not simply evacuating and returning home after a storm. They are remaining displaced for longer periods because homes, farmland, water systems, roads, and local economies are not recovering quickly enough.
Second, it highlights the difference between flows and stocks in displacement analysis. IDMC distinguishes between:
- internal displacements: the number of forced movements recorded during a year, including repeated movements by the same person; and
- internally displaced people (IDPs): the number of people still living in displacement at a given point in time, usually at the end of the year.
This distinction is crucial in a nonlinear climate context. A single extreme event can trigger a large flow of short-term displacements, but a system under sustained stress generates something more dangerous: a rising stock of people who remain uprooted because return, recovery, and resettlement become progressively harder.
That is the deeper warning embedded in the recent numbers.
3. From Linear Hazard to Nonlinear Displacement
A linear view of climate displacement assumes a relatively simple chain of causation:
warming → more extreme weather → more damage → more displacement
But the real system increasingly looks more like this:
warming → hydrologic intensification → drought/flood volatility → crop loss + infrastructure damage + water insecurity + economic stress + conflict risk → repeated displacement → prolonged displacement → social destabilization
In other words, displacement is not driven by one variable. It emerges from coupled feedbacks.
3.1 Hydrologic whiplash
One of the clearest nonlinear pathways is hydrologic whiplash—the growing tendency for regions to swing rapidly between drought and flood. A warmer atmosphere increases evaporation, drying soils and intensifying drought. At the same time, warmer air holds more water vapor, increasing the likelihood of extreme rainfall when storms do occur. The result is not simply “more drought” or “more flooding,” but a destabilizing oscillation between the two.
For vulnerable populations, this matters enormously. Drought can destroy crops, livestock, and local water supplies. Flooding can then destroy the roads, bridges, homes, sanitation systems, and clinics needed for recovery. The second disaster lands before recovery from the first is complete. Communities are not merely hit harder; they are hit before they have time to recover. That is a nonlinear displacement engine.
3.2 Repeated displacement
Climate displacement is often not a one-time movement. A household may flee a floodplain, return months later, then flee again during the next storm season, then relocate after drought destroys agricultural income, then move again after conflict or price shocks intensify. The same family can be counted multiple times in annual displacement flows, but the deeper reality is repeated social dislocation.
Repeated displacement erodes savings, fragments families, interrupts schooling, worsens health outcomes, and depletes community resilience. Over time, it converts temporary mobility into chronic instability.
3.3 Coupled climate-conflict systems
Climate displacement and conflict displacement are not cleanly separable in the real world. Drought can weaken agriculture. Flooding can destroy infrastructure. Food insecurity and water stress can intensify social instability. In fragile settings, those pressures can contribute to violence and forced movement. The categories may differ administratively; the systems do not.
4. Nonlinear Acceleration and Threshold Behavior
The central argument of this paper is that climate displacement is increasingly governed by threshold behavior rather than smooth linear change.
A household can often absorb one bad harvest.
A town can sometimes recover from one flood.
A region may survive one year of drought.
But nonlinear systems change character when repeated shocks arrive faster than recovery can occur. Once adaptation capacity is exceeded, the response is no longer incremental. It becomes discontinuous.
A few examples illustrate this threshold logic:
- Water threshold: A city or agricultural basin can function under water stress up to a point. Once aquifers collapse, reservoirs fail, or snowpack loss undermines irrigation, displacement risk rises abruptly rather than gradually.
- Food threshold: Households can absorb modest food-price increases or crop losses. But once food insecurity becomes chronic, migration becomes a survival strategy.
- Infrastructure threshold: A road washed out once is a repair problem. Roads, bridges, ports, and power systems repeatedly damaged by extreme weather become a regional collapse problem.
- Livelihood threshold: Smallholder farmers can survive a poor season. They cannot survive repeated crop failures, rising heat stress, declining water availability, and fertilizer or fuel price shocks indefinitely.
The importance of thresholds is that they help explain why displacement can rise sharply even if average warming appears gradual. The forcing may be smooth; the social response is not.
5. Doubling-Time Compression in Climate Displacement
Based on the currently cited modern displacement record, climate/disaster displacement appears to be entering a phase of rapid compression in effective doubling times.
Using the year-end stock of people displaced by disasters:
- 2024: ~9.9 million
- 2025: 13.6 million
The one-year growth factor is:
g = 13.6 / 9.9 ≈ 1.374
The implied doubling time is:
T_d = ln(2) / ln(13.6 / 9.9)
Substituting the observed values:
T_d ≈ 0.6931 / 0.3178 ≈ 2.18 years
In other words, the latest year-over-year increase implies an effective doubling time of roughly 2.2 years.
This does not mean climate displacement will literally double every 2.2 years in a stable exponential fashion. One year does not establish a long-run law of motion. But it does signal that displacement may be entering a regime in which recovery times are being compressed faster than adaptation systems can respond.
That distinction matters. The significance of the calculation is not that it proves a permanent exponential trend. The significance is that it reveals how quickly displacement pressure can rise once multiple hazards, infrastructure losses, and repeated recovery failures begin interacting in the same period.
In a linear system, displacement might rise gradually as climate hazards intensify. In a nonlinear system, displacement can remain manageable for a time and then surge when thresholds are crossed. The recent IDMC numbers suggest the latter risk is becoming more plausible.
6. U.S. Impacts: Property Loss, Real Estate Values, and Insurance Stress
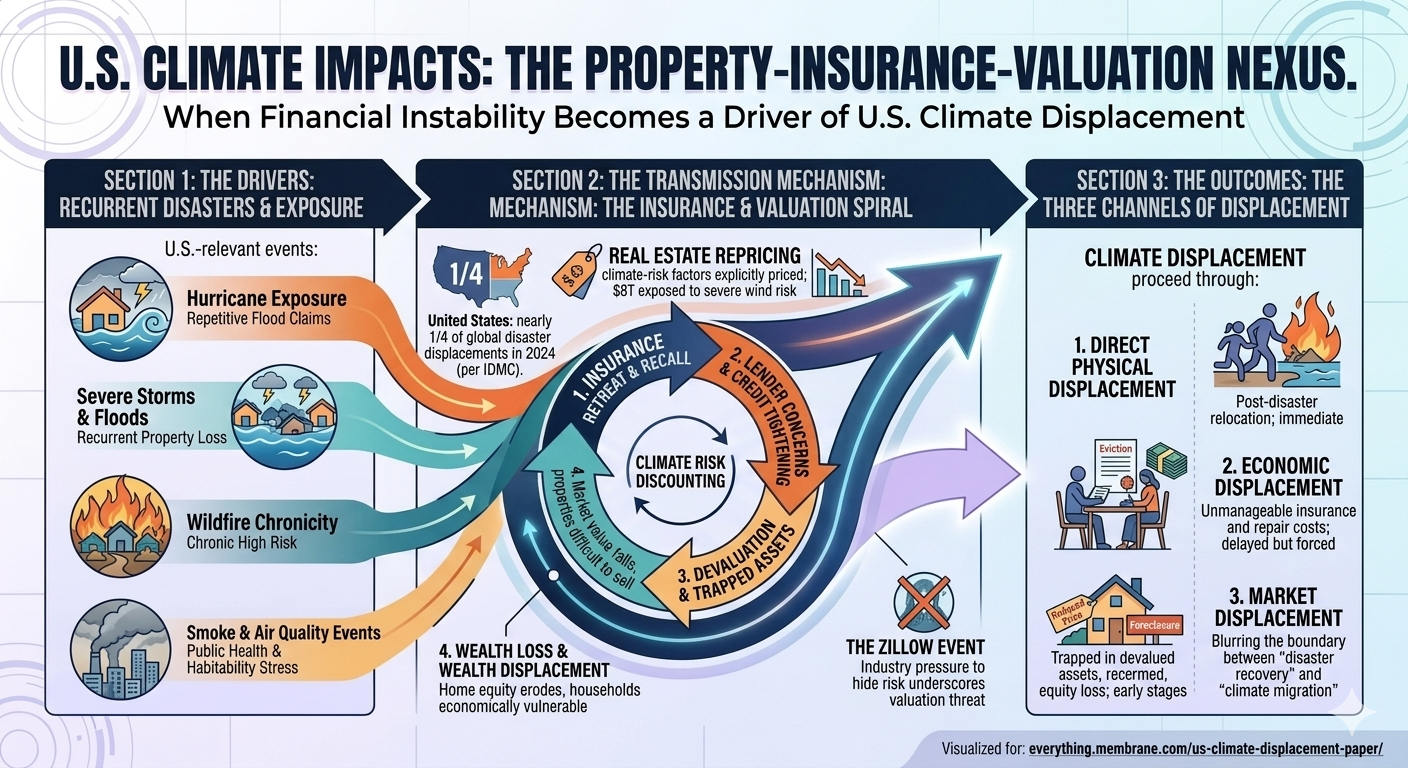
Climate displacement is often framed as a problem of distant coastlines, small island states, or conflict-prone regions in the Global South. That framing is increasingly obsolete. Climate displacement is already affecting the United States through property loss, real estate repricing, insurance instability, and internal migration pressures.
6.1 Property loss and recurrent disaster exposure
The United States has experienced repeated waves of large-scale disaster displacement from hurricanes, floods, wildfires, severe storms, and smoke-related emergencies. IDMC reported that the United States accounted for nearly one-quarter of all disaster displacements globally in 2024, driven by severe floods and storms.
What matters economically is not only the immediate property damage, but the way repeated exposure changes the viability of living in certain regions. Once homes flood multiple times, or wildfire risk becomes chronic, the relevant question is no longer just repair cost. It becomes whether the property remains insurable, financeable, and marketable.
6.2 Real estate repricing and climate-risk discounting
Climate risk is increasingly being priced into housing markets, though unevenly and often belatedly. Realtor.com analysis cited by Axios found that nearly 20 percent of U.S. homes—worth about $8 trillion—face severe or extreme hurricane wind risk, illustrating the scale of housing-market exposure.
Private climate-risk firms such as First Street have argued that rising insurance costs and underpriced climate risk could drive substantial housing-value losses over coming decades. The controversy surrounding Zillow’s 2025 removal of embedded climate-risk scores from property listings is revealing. Zillow had integrated climate-risk data for floods, wildfire, wind, heat, and air quality, but removed those ratings after industry complaints that they were hurting sales. The episode matters because it shows that climate risk is not only a physical threat but a valuation threat. Once buyers, lenders, and insurers begin to price hazard exposure more explicitly, some properties will lose value not because they are uninhabitable today, but because the market increasingly recognizes that they may become financially fragile tomorrow.
6.3 Insurance retreat as a displacement mechanism
Insurance may become one of the most important near-term transmission mechanisms linking climate change to displacement in the United States. A home does not need to be destroyed to become effectively displaced from the market. If premiums become unaffordable, deductibles become unmanageable, or insurers withdraw from a region entirely, households can be forced to move even before a catastrophic event occurs.
This creates a new category of climate displacement: financial displacement driven by insurability collapse.
In that sense, climate displacement in the United States may increasingly proceed through three channels:
- direct physical displacement after storms, fires, floods, or heat-related infrastructure failures;
- economic displacement as repeated damage, maintenance costs, and insurance premiums overwhelm household budgets; and
- market displacement as property values fall and homeowners become trapped in devalued or difficult-to-sell assets.
These dynamics blur the boundary between “disaster recovery” and “climate migration.” A family may still occupy the same home today while already experiencing the early stages of displacement through rising insurance costs, declining home equity, and a shrinking set of exit options.
7. Mental Health, Social Stress, and Climate Policy Feedbacks
Climate displacement is not only a housing or migration problem. It is also a mental-health and socio-economic destabilization problem with direct implications for climate politics and public policy.
Extreme weather exposure, chronic climate disruption, and perceived governmental inaction are increasingly associated with post-traumatic stress disorder (PTSD), depression, anxiety, grief, chronic stress, and climate-related distress. The psychological burden is not limited to those who lose homes outright. It extends to people living under repeated evacuation orders, communities facing chronic smoke or heat exposure, farmers confronting repeated crop losses, and households watching insurance premiums, utility bills, and rebuilding costs climb year after year.
7.1 Trauma after extreme events
Disaster research has long shown elevated rates of PTSD, depression, and anxiety following hurricanes, floods, wildfires, and prolonged displacement. Climate change amplifies this burden by increasing the frequency of events and by reducing the time available for psychological recovery between them. A household displaced once by a flood may eventually recover. A household displaced by a flood, then smoke, then heat, then another flood enters a very different mental-health regime.
The cumulative burden matters because trauma is not merely an individual health outcome. It affects work capacity, school performance, family stability, substance use, physical health, and community cohesion.
7.2 Chronic disruption and “pre-traumatic” stress
Climate-related mental-health impacts are not limited to post-disaster trauma. Chronic exposure to climate risk can generate persistent anxiety even before a disaster occurs. People living in high-risk regions may experience what is increasingly described as anticipatory or pre-traumatic stress: the psychological strain of knowing that another wildfire season, another hurricane, or another flood is coming, while also suspecting that public institutions are unprepared to protect them.
This can produce a form of climate dread with economic teeth. Families delay investment. Young adults reconsider where to live or whether to have children. Retirees reassess whether fixed incomes can survive escalating insurance and utility costs. Farmers and small businesses become less willing to invest in long-lived assets. In that sense, mental-health stress feeds back into economic behavior and local resilience.
7.3 Perceived governmental inaction and policy instability
Perceived governmental inaction is itself a destabilizing variable. When people repeatedly experience disasters, property loss, insurance shocks, or displacement while seeing little meaningful adaptation, planning, or support, trust in institutions erodes. That erosion can produce several policy effects at once:
- political polarization, as climate impacts become refracted through grievance and distrust;
- policy whiplash, as short-term emergency spending substitutes for long-term adaptation planning;
- maladaptation, where communities rebuild into high-risk zones because retreat, relocation, and buyout programs remain politically or financially inaccessible;
- social fragmentation, as households with resources leave while lower-income residents remain exposed to escalating risk.
These are not side effects. They are part of the climate-displacement system itself. A society experiencing repeated disasters without credible adaptation pathways may become less capable of implementing coherent climate policy precisely because the social stress of climate disruption is eroding the institutional capacity required to respond.
8. Climate Displacement as an Indicator of Systemic Instability
Climate displacement should therefore be viewed not merely as a humanitarian outcome but as a diagnostic signal of Earth-system destabilization interacting with human vulnerability.
In the same way that ocean heat content reveals accumulating thermal energy in the climate system, displacement reveals accumulating social stress in human systems. It tells us that environmental shocks are no longer being absorbed locally. They are crossing thresholds and reorganizing human geography.
Seen this way, displacement is one of the clearest real-world indicators that climate change is moving beyond “environmental change” and into civilizational risk.
When millions of people are forced to move because water disappears, crops fail, coasts flood, storms intensify, and recovery systems collapse, the issue is no longer whether the climate is changing. The issue is whether the political, economic, and humanitarian systems built for the twentieth century can withstand the pace and nonlinearity of twenty-first century climate disruption.
9. Conclusion
The latest displacement data should not be read as isolated humanitarian statistics. They should be read as evidence that climate change is increasingly acting through nonlinear social pathways.
The rise in disaster-related internal displacement from roughly 9.9 million to 13.6 million in a single year does not, by itself, prove a permanent exponential trajectory. But it does imply an effective short-term doubling time of about 2.2 years, a warning that climate displacement may be entering a phase of rapid compression in recovery times and rising systemic instability.
In a linear world, displacement would rise gradually as hazards gradually intensified.
In the world we are actually entering, climate forcing interacts with thresholds, feedbacks, and repeated shocks. Drought is followed by flood. Recovery is interrupted by the next disaster. Conflict overlays crop failure. Property values fall as risk becomes visible. Insurance costs become a displacement mechanism of their own. Trauma, anxiety, and distrust weaken the very institutions needed to adapt.
Climate displacement is therefore not merely one consequence of warming. It is one of the clearest manifestations of nonlinear acceleration in the human dimensions of climate change.
The real question is no longer whether climate change will displace people. It already is.
The real question is how many social, economic, and political thresholds will be crossed before the world recognizes that displacement is not a side story to climate change.
It is one of its central outcomes.
References
1. Climate displacement, internal displacement, and disaster mobility
Internal Displacement Monitoring Centre. (2025). Global report on internal displacement 2025 (GRID 2025). Geneva, Switzerland: IDMC. https://www.internal-displacement.org/global-report/grid2025/
Internal Displacement Monitoring Centre. (2026). 2026 global report on internal displacement (GRID 2026). Geneva, Switzerland: IDMC. https://www.internal-displacement.org/publications/2026-global-report-on-internal-displacement-grid/
Internal Displacement Monitoring Centre. (2026). Global report on internal displacement 2026 overview and data portal. https://www.internal-displacement.org/global-report/grid2026/
Internal Displacement Monitoring Centre. (n.d.). Global report on internal displacement (annual series). https://www.internal-displacement.org/global-report/
Internal Displacement Monitoring Centre. (2026). Global report on internal displacement 2026 [PDF]. https://api.internal-displacement.org/sites/default/files/2026-05/IDMC-GRID-2026-Global-Report-on-Internal-Displacement.pdf
United Nations High Commissioner for Refugees. (2026, June 11). UNHCR says fewer people displaced worldwide in 2025 but long-term refugee crisis persists. Reuters. https://www.reuters.com/world/unhcr-says-fewer-people-displaced-worldwide-2025-long-term-refugee-crisis-2026-06-11/
Pietrostefani, E., Mason, M., Iradukunda, R., Tran-Jones, H., Loktieva, I., & Rowe, F. (2025). Dynamic estimates of displacement in disaster regions: A policy-driven framework triangulating data. arXiv. https://arxiv.org/abs/2511.01955
Idzalika, R., Muztahid, M. R., & Prasojo, R. E. (2026). Context-aware displacement estimation from mobile phone data: A methodological framework. arXiv. https://arxiv.org/abs/2604.21457
2. Climate migration, human mobility, and climate vulnerability framing
Intergovernmental Panel on Climate Change. (2022). Climate change 2022: Impacts, adaptation and vulnerability. Contribution of Working Group II to the Sixth Assessment Report of the Intergovernmental Panel on Climate Change. Cambridge University Press.
Intergovernmental Panel on Climate Change. (2021). Climate change 2021: The physical science basis. Contribution of Working Group I to the Sixth Assessment Report of the Intergovernmental Panel on Climate Change. Cambridge University Press.
World Bank. (2021). Groundswell Part 2: Acting on internal climate migration. Washington, DC: World Bank.
Black, R., Bennett, S. R. G., Thomas, S. M., & Beddington, J. R. (2011). Migration as adaptation. Nature, 478(7370), 447–449.
McLeman, R. A. (2014). Climate and human migration: Past experiences, future challenges. Cambridge University Press.
Adger, W. N., de Campos, R. S., Siddiqui, T., et al. (2020). Migration, displacement and mobility. In Climate change 2022: Impacts, adaptation and vulnerability (IPCC WGII chapter).
3. Nonlinear acceleration, compound climate extremes, and hydrologic whiplash
Chun, K. P., Octavianti, T., Papacharalampous, G., Tyralis, H., Sutanto, S. J., Terskii, P., Mazzoglio, P., Treppiedi, D., Rivera, J., Dogulu, N., Olusola, A., Dieppois, B., Dembélé, M., Moulds, S., Li, C., Morales-Marin, L. A., Macdonald, N., Amoussou, T. O., Yonaba, R., Obahoundje, S., Hannah, D. M., Chidepudi, S. K. R., & Hamududu, B. (2024). Unravelling compound risks of hydrological extremes in a changing climate: Typology, methods and futures. arXiv. https://arxiv.org/abs/2409.19003
Green, J., Haigh, I. D., Quinn, N., Neal, J., Wahl, T., Wood, M., Eilander, D., de Ruiter, M., Ward, P., & Camus, P. (2024). A comprehensive review of coastal compound flooding literature. arXiv. https://arxiv.org/abs/2404.01321
Kleidon, A. (2024). Droughts in Germany—Why global climate change amplifies hydrological extremes. arXiv. https://arxiv.org/abs/2403.16551
Murphy-Barltrop, C. J. R., Richards, J., Poschlod, B., Sasse, A., & Zscheischler, J. (2026). Exploring climate change effects on concurrent floods and concurrent droughts via statistical deep learning. arXiv. https://arxiv.org/abs/2604.21647
He, Y., et al. (2026, June 17). Rising temperatures may increase flood risk through river “whiplash,” study finds. The Guardian. https://www.theguardian.com/environment/2026/jun/17/rising-temperatures-may-increase-flood-risk-through-river-whiplash-study-finds
Zscheischler, J., Westra, S., van den Hurk, B. J. J. M., et al. (2018). Future climate risk from compound events. Nature Climate Change, 8, 469–477.
Ridder, N. N., Ukkola, A. M., Pitman, A. J., et al. (2022). Increased occurrence of high-impact compound events under climate change. Nature Climate Change, 12, 600–606.
Swain, D. L., et al. (2018). Increasing precipitation volatility in a warming climate. Nature Climate Change, 8, 427–433.
Touma, D., Stevenson, S., Camargo, S. J., Horton, D. E., & Diffenbaugh, N. S. (2022). Climate change increases risk of extreme rainfall following drought. Science Advances, 8(32), eabn6301.
4. Climate displacement as nonlinear acceleration / doubling-time compression
Brouse, D., & Mukherjee, S. (2026). Climate displacement and nonlinear acceleration: When extreme weather becomes a systemic driver of human mobility. [Working paper / manuscript].
Brouse, D., & Mukherjee, S. (2026). Emergent climate dynamics: The nonlinear acceleration of climate impacts. [Manuscript].
Brouse, D., & Mukherjee, S. (2026). A unified energetics framework for nonlinear climate acceleration. [Manuscript].
Brouse, D., & Mukherjee, S. (2025). Runaway climate feedbacks and systemic collapse. [Manuscript].
5. U.S. property loss, housing-market repricing, and insurance retreat
Bernstein, A., Gustafson, M. T., & Lewis, R. (2019). Disaster on the horizon: The price effect of sea level rise. Journal of Financial Economics, 134(2), 253–272.
Bakkensen, L. A., & Barrage, L. (2021). Flood risk beliefs and coastal home price dynamics. Review of Financial Studies, 34(10), 1–41.
(Use whichever final journal version you have access to; there are several closely related working-paper/journal versions in this literature.)
Keys, B. J., Mulder, P., & Vissing-Jorgensen, A. (2024). Climate risk and the U.S. housing market. Annual Review of Financial Economics / working paper literature as applicable.
Keenan, J. M., Hill, T., & Gumber, A. (2018). Climate gentrification: From theory to empiricism in Miami-Dade County, Florida. Environmental Research Letters, 13(5), 054001.
First Street Foundation. (2025). Climate risk, mortgage exposure, and U.S. property vulnerability [Risk analysis / research releases]. New York, NY: First Street Foundation.
(Use the specific First Street report or white paper you cite.)
Realtor.com. (2025). Climate-risk exposure in U.S. housing markets [Market analysis / research brief].
(Use the specific report behind the $8 trillion severe or extreme hurricane wind exposure figure if you cite that number.)
Axios. (2025, October 7). Where U.S. homes face the most severe and extreme climate risk. https://www.axios.com/2025/10/07/climate-risk-housing-market-real-estate
The Guardian. (2025, December 1). Zillow deletes climate risk data from listings after complaints it harms sales. https://www.theguardian.com/environment/2025/dec/01/zillow-removes-climate-risk-data-home-listings
The Verge. (2025). Zillow property listings no longer show risk of fires, floods, and storms. https://www.theverge.com/news/834715/zillow-removes-flood-fire-risk-scores-home-listings
Wall Street Journal. (2025). The climate-disaster scores that could make or break your home sale.
(Add exact author/date if you want strict APA completeness.)
Washington Post. (2025, December 9). Hurricanes and wildfires influence homebuyers, if only for a minute.
(Add author if available in your final bibliography draft.)
6. Insurance stress, retreat, and financial displacement
Kousky, C. (2019). The role of natural disaster insurance in recovery and risk reduction. Annual Review of Resource Economics, 11, 399–418.
Kousky, C., & Shabman, L. (2016). Flood risk and property values: Examining the role of flood insurance. Natural Hazards Review, 17(3).
Botzen, W. J. W., Deschenes, O., & Sanders, M. (2019). The economic impacts of natural disasters: A review of models and empirical studies. Review of Environmental Economics and Policy, 13(2), 167–188.
Kunreuther, H., & Michel-Kerjan, E. (2011). At war with the weather: Managing large-scale risks in a new era of catastrophes. Cambridge, MA: MIT Press.
First Street Foundation. (2025). Climate risk and insurance affordability in U.S. housing markets.
(Insert the exact report title you use if citing insurer retreat or affordability estimates.)
7. Mental health, PTSD, anxiety, and climate-related distress
Berry, H. L., Bowen, K., & Kjellstrom, T. (2010). Climate change and mental health: A causal pathways framework. International Journal of Public Health, 55(2), 123–132.
Clayton, S., Manning, C., Krygsman, K., & Speiser, M. (2017). Mental health and our changing climate: Impacts, implications, and guidance. Washington, DC: American Psychological Association and ecoAmerica.
Cianconi, P., Betrò, S., & Janiri, L. (2020). The impact of climate change on mental health: A systematic descriptive review. Frontiers in Psychiatry, 11, 74.
Hayes, K., & Poland, B. (2018). Addressing mental health in a changing climate: Incorporating mental health indicators into climate change and health vulnerability and adaptation assessments. International Journal of Environmental Research and Public Health, 15(9), 1806.
Lawrance, E. L., Thompson, R., Newberry Le Vay, J., Page, L., Jennings, N., & McBride, M. (2022). The impact of climate change on mental health and emotional wellbeing: A narrative review of current evidence, and its implications. International Review of Psychiatry, 34(5), 443–498.
Pihkala, P. (2020). Eco-anxiety and environmental education. Sustainability, 12(23), 10149.
Charlson, F., Ali, S., Benmarhnia, T., Pearl, M., Massazza, A., Augustinavicius, J., & Scott, J. G. (2021). Climate change and mental health: A scoping review. International Journal of Environmental Research and Public Health, 18(9), 4486.
Thoma, M. V., et al. (2021). The psychological consequences of climate-related disasters and displacement. Current Psychiatry Reports, 23, 82.
(Use a final journal article that best matches the PTSD/disaster-displacement angle you want.)
Janzen, B. (2022). Temperature and mental health: Evidence from helpline calls. arXiv. https://arxiv.org/abs/2207.04992
8. Disaster trauma, repeated exposure, and post-event psychiatric burden
Goldmann, E., & Galea, S. (2014). Mental health consequences of disasters. Annual Review of Public Health, 35, 169–183.
Neria, Y., Nandi, A., & Galea, S. (2008). Post-traumatic stress disorder following disasters: A systematic review. Psychological Medicine, 38(4), 467–480.
Lowe, S. R., & Galea, S. (2017). The mental health consequences of mass shootings and natural disasters. Current Psychiatry Reports, 19, 64.
(Use selectively if you want repeated-trauma framing across disaster types.)
Vins, H., Bell, J., Saha, S., & Hess, J. J. (2015). The mental health outcomes of drought: A systematic review and causal process diagram. International Journal of Environmental Research and Public Health, 12(10), 13251–13275.
Bryant, R. A. (2019). Post-traumatic stress disorder: A state-of-the-art review of evidence and challenges. World Psychiatry, 18(3), 259–269.
(Useful for grounding the PTSD language in the paper’s mental-health section.)
9. Climate anxiety, anticipatory stress, and perceived governmental inaction
Hickman, C., Marks, E., Pihkala, P., et al. (2021). Climate anxiety in children and young people and their beliefs about government responses to climate change: A global survey. The Lancet Planetary Health, 5(12), e863–e873.
Ojala, M. (2012). Hope and climate change: The importance of hope for environmental engagement among young people. Environmental Education Research, 18(5), 625–642.
Pihkala, P. (2022). Toward a taxonomy of climate emotions. Frontiers in Climate, 3, 738154.
Reser, J. P., Bradley, G. L., & Ellul, M. C. (2014). Encountering climate change: “Seeing” is more than “believing.” WIREs Climate Change, 5(4), 521–537.
Wang, S., Leviston, Z., Hurlstone, M., Lawrence, C., & Walker, I. (2018). Emotions predict policy support: Why it matters how people feel about climate change. Global Environmental Change, 50, 25–40.
10. Climate policy, social destabilization, and governance stress
Adger, W. N., Barnett, J., Brown, K., Marshall, N., & O’Brien, K. (2013). Cultural dimensions of climate change impacts and adaptation. Nature Climate Change, 3, 112–117.
Mach, K. J., Kraan, C. M., Adger, W. N., et al. (2019). Climate as a risk factor for armed conflict. Nature, 571, 193–197.
Abel, G. J., Brottrager, M., Crespo Cuaresma, J., & Muttarak, R. (2019). Climate, conflict and forced migration. Global Environmental Change, 54, 239–249.
Hsiang, S. M., Burke, M., & Miguel, E. (2013). Quantifying the influence of climate on human conflict. Science, 341(6151), 1235367.
Stern, N. (2007). The economics of climate change: The Stern review. Cambridge University Press.
11. Climate-risk communication, valuation, and disclosure in housing markets
Zillow. (2024). Zillow integrates climate-risk data into home listings [Corporate / platform announcement].
(If you use the rollout itself as part of the story, cite the original Zillow announcement or newsroom page.)
First Street Foundation. (2024–2025). Climate risk data for U.S. properties [Methodology and risk score documentation].
(Use the exact methodology page or report behind the risk metrics if cited in the paper.)
San Francisco Chronicle. (2025). Zillow is dropping climate risk scores. Here’s why it matters.
(Add author/date if you use this source in the final paper.)
12. Optional contemporary media sources for very recent 2025–2026 developments
Use these only for contemporary market developments or examples, not as the backbone of the scientific argument.
Axios. (2025, October 7). Where U.S. homes face the most severe and extreme climate risk. https://www.axios.com/2025/10/07/climate-risk-housing-market-real-estate
The Verge. (2025). Zillow property listings no longer show risk of fires, floods, and storms. https://www.theverge.com/news/834715/zillow-removes-flood-fire-risk-scores-home-listings
Reuters. (2026, June 11). UNHCR says fewer people displaced worldwide in 2025 but long-term refugee crisis persists. https://www.reuters.com/world/unhcr-says-fewer-people-displaced-worldwide-2025-long-term-refugee-crisis-2026-06-11/
The Guardian. (2026, June 17). Rising temperatures may increase flood risk through river “whiplash,” study finds. https://www.theguardian.com/environment/2026/jun/17/rising-temperatures-may-increase-flood-risk-through-river-whiplash-study-finds