Comparing Two Approaches to Measuring Humanity’s Climate Footprint
Climate responsibility depends on how emissions are assigned. Traditional territorial accounting attributes emissions to the country where they occur, but globalization has made that approach increasingly incomplete. Modern supply chains, international trade, and service-based economies often separate where emissions are produced from who ultimately benefits from them.
To explore this problem from two different perspectives, I developed two complementary accounting frameworks.
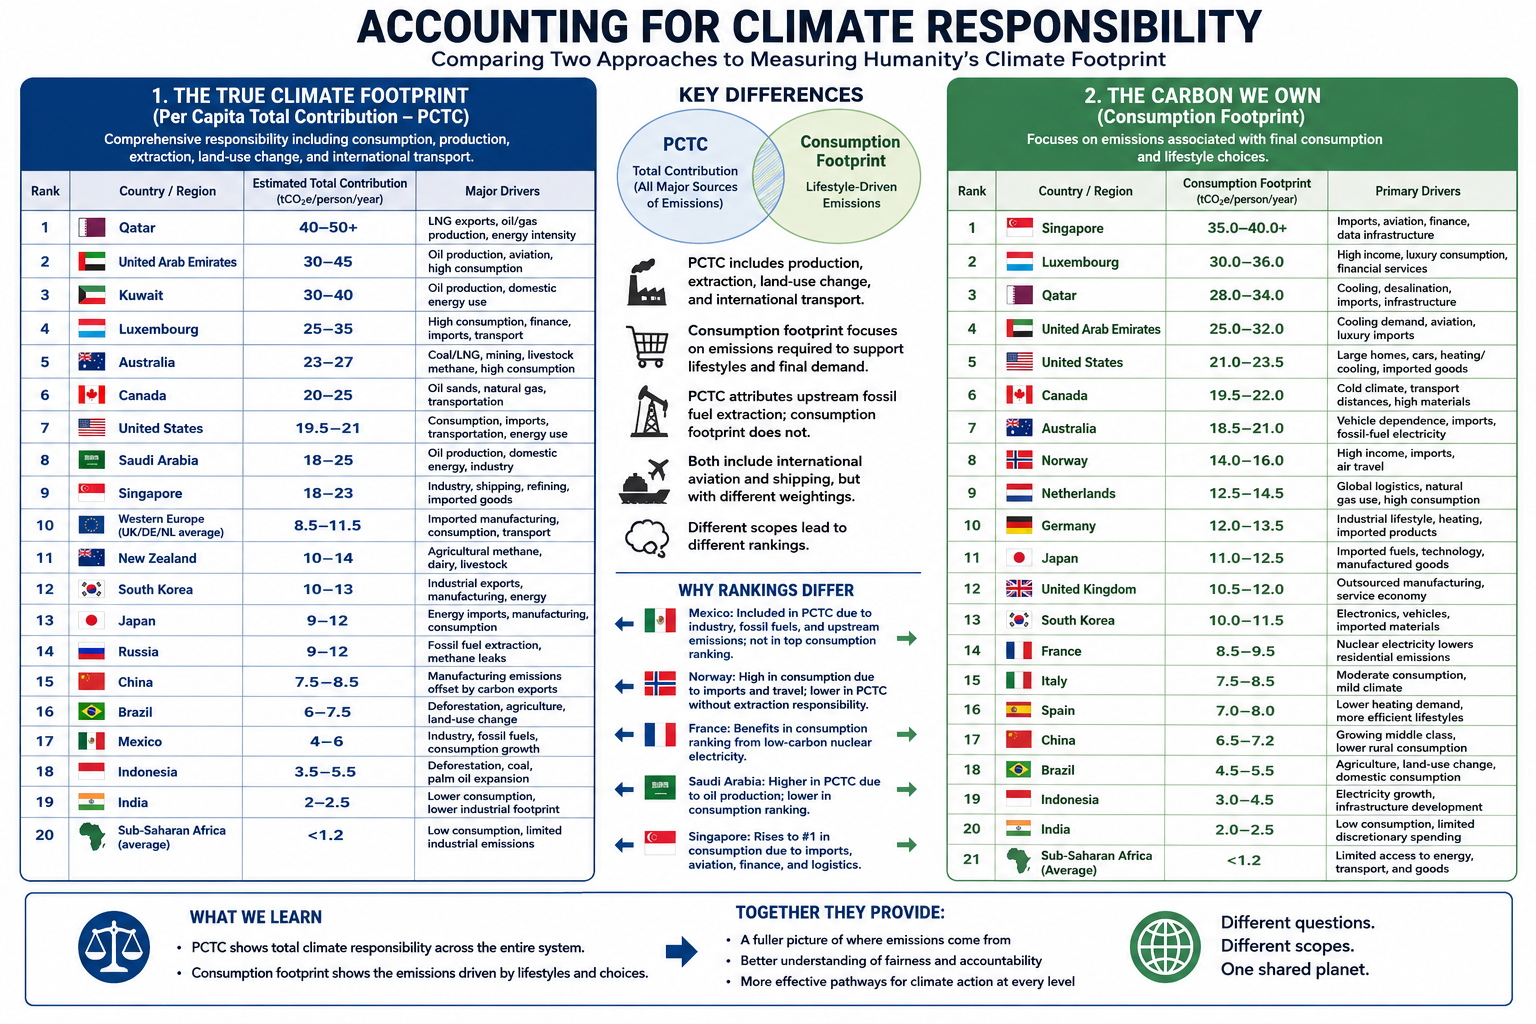
The first paper, The True Climate Footprint: Measuring Per Capita Total Contribution Beyond Territorial Emissions, introduces the Per Capita Total Contribution (PCTC) framework. PCTC seeks to estimate an individual’s or nation’s complete climate responsibility by incorporating not only consumption, but also several major sources of emissions that are frequently omitted from conventional carbon accounting.
All major greenhouse gases (CO₂, CH₄, N₂O, and others expressed as CO₂-equivalent)
Responsibility associated with fossil fuel production where appropriate
The second paper, The Carbon We Own: Why Consumption Matters More, examines climate responsibility from a different perspective. Rather than estimating total climate contribution, it focuses specifically on the carbon footprint required to support modern lifestyles using a consumption-based accounting approach.
Unlike PCTC, this framework intentionally places less emphasis on fossil fuel extraction and producer responsibility in order to better isolate the climate impacts associated with everyday consumption.
After completing the first paper, I wanted to examine the climate footprint from the perspective of the consumer rather than the entire climate system. The PCTC framework provides a comprehensive measure of total responsibility, but it does not distinguish as clearly between emissions driven by individual lifestyle choices and those associated with resource extraction or national production.
A consumption-based framework highlights decisions that individuals and societies can influence more directly. Choices such as lowering a home’s thermostat, improving insulation, selecting public transportation or electric vehicles instead of internal combustion vehicles, reducing air travel, or purchasing fewer carbon-intensive goods become more visible within the accounting. It also better captures the increasingly important role of service-based economies. While services may appear less energy-intensive than manufacturing, sectors such as healthcare, finance, telecommunications, cloud computing, and artificial intelligence rely on extensive digital infrastructure—including energy-hungry data centers—that can be substantially underrepresented in traditional emissions inventories.
Finally, I wanted a more detailed comparison among developed economies, particularly within Europe. Countries such as Norway and France illustrate why accounting methodology matters. Norway has one of the world’s cleanest domestic electricity systems, powered primarily by hydropower, yet it is also a major exporter of oil and natural gas. France, by contrast, derives much of its electricity from nuclear power, resulting in comparatively low-carbon domestic energy while maintaining a high standard of living. Comparing these countries under both frameworks reveals how different accounting methods assign responsibility and helps illustrate the strengths and limitations of each approach.
Taken together, these two papers do not compete—they answer different questions. Per Capita Total Contribution (PCTC) asks, What is humanity’s full climate responsibility?Consumption-based accounting asks, What emissions are required to sustain the lifestyle of the average resident? Used together, they provide a more complete understanding of climate responsibility than either framework alone.
Conclusion
Although The True Climate Footprint and The Carbon We Own both seek to improve upon traditional territorial emissions accounting, they answer different questions because they are built on different accounting frameworks.
The True Climate Footprint uses the Per Capita Total Contribution (PCTC) framework to estimate an individual’s or nation’s complete contribution to climate change. It extends beyond consumption to include land-use change, upstream fossil fuel extraction, international shipping and aviation, and the full spectrum of greenhouse gases. In some cases, it also attributes responsibility associated with fossil-fuel production, providing a broad measure of humanity’s total climate impact.
By contrast, The Carbon We Own focuses specifically on consumption-based climate responsibility. Using Multi-Regional Input-Output (MRIO) accounting, it assigns emissions to the final consumer by emphasizing direct household energy use, embedded emissions in imported goods, services, and lifestyle choices. It intentionally deemphasizes extraction and producer responsibility in order to better represent the carbon footprint required to sustain modern patterns of consumption.
Because these frameworks measure different aspects of climate responsibility, their rankings are not expected to be identical.
Mexico provides a useful illustration. Under the PCTC framework, Mexico’s estimated footprint includes domestic industry, fossil fuel production, growing consumption, and upstream emissions, resulting in an estimated contribution of approximately 4–6 tonnes of CO₂-equivalent per person per year. In the consumption-based analysis, however, Mexico does not appear among the highest-ranking countries because the focus is limited to end-user consumption, and the published rankings emphasize the world’s largest per-capita consumption footprints.
Similar differences appear elsewhere. Norway’s position changes substantially because one framework incorporates the climate responsibility associated with fossil fuel production, while the other emphasizes domestic consumption. France benefits in the consumption-based analysis because its low-carbon nuclear electricity reduces household emissions despite maintaining a high standard of living. Saudi Arabia ranks differently depending on whether responsibility is assigned to oil production or to energy consumption. Singapore rises dramatically under consumption accounting because imported goods, international aviation, finance, logistics, and digital infrastructure contribute heavily to its consumption footprint despite relatively limited domestic manufacturing.
These examples demonstrate that accounting methodology influences how climate responsibility is distributed. Production-based, consumption-based, and total-contribution frameworks each illuminate different dimensions of the global climate system.
Rather than viewing these approaches as competing methodologies, they should be regarded as complementary analytical tools. The Per Capita Total Contribution (PCTC) framework asks, What is a nation’s or individual’s total contribution to climate change? The consumption-based framework asks, What emissions are required to sustain the average resident’s lifestyle? Together, they provide a more complete understanding of climate responsibility than either approach can achieve alone, revealing both the systemic impacts of resource production and the powerful role of consumer demand in shaping the global climate.
Complex social-ecological feedback loops arise when human systems and natural systems react to climate change in ways that amplify one another. Because Earth’s climate operates as a nonlinear system, these interactions do not unfold gradually — they can accelerate suddenly, compound unpredictably, and push the system toward irreversible shifts.
This nonlinear, cross-regional feedback behavior is something we have been modeling for decades — where climate physics couples directly with economic networks.
In the 1990s we underestimated one variable: human delay. We assumed mitigation would begin in earnest. It did not.
Now we observe potential doubling in the intensity or frequency of certain climate impacts on timescales of 2–10 years rather than centuries. The apparent acceleration has compressed from millennial-scale shifts to multi-decade nonlinear surges.
Denialism and Ecofascism
One factor we drastically underestimated was the influence of organized denialism and emerging ecofascist ideology.
Initially the investigation focused on a straightforward institutional question:
Were challenges to the EPA’s Endangerment Finding and coordinated regulatory rollbacks primarily driven by economic motives — specifically the fossil-fuel industry’s long-documented strategy of financing climate denial narratives?
Organizations such as the CO₂ Coalition and the Department of Energy’s Climate Working Group were key nodes of analysis. The economic motive was clear and well documented: protect fossil capital, delay regulation, and manufacture doubt.
But as correspondence, affiliations, and rhetoric were analyzed, a second pattern emerged.
This was not simply economic denialism. It was the normalization of ecofascist ideology.
Ecofascism reframes environmental collapse as beneficial — even desirable — if it reduces populations deemed inferior, excessive, or expendable. It merges environmental crisis with authoritarian hierarchy, racialized survival logic, and elite domination theory.
This is not speculation. It is visible in the language used by some elite circles revealed through the Epstein files.
Examples include statements attributed to Jeffrey Epstein such as:
“I liked the argument that more CO₂ is good for plants.”
“Maybe climate change is a good way of dealing with overpopulation — the Earth’s forest fire. Potentially a good thing for the species.”
Combined with statements reflecting explicit eugenic ideology:
“Executions of the elderly and infirm make sense.”
“African music has lots of beats and little development — no accident. It mirrors their learning process.”
This is not conventional policy disagreement. This is eliminationist logic.
Where traditional denial protects capital investment, ecofascism rationalizes unequal human survival.
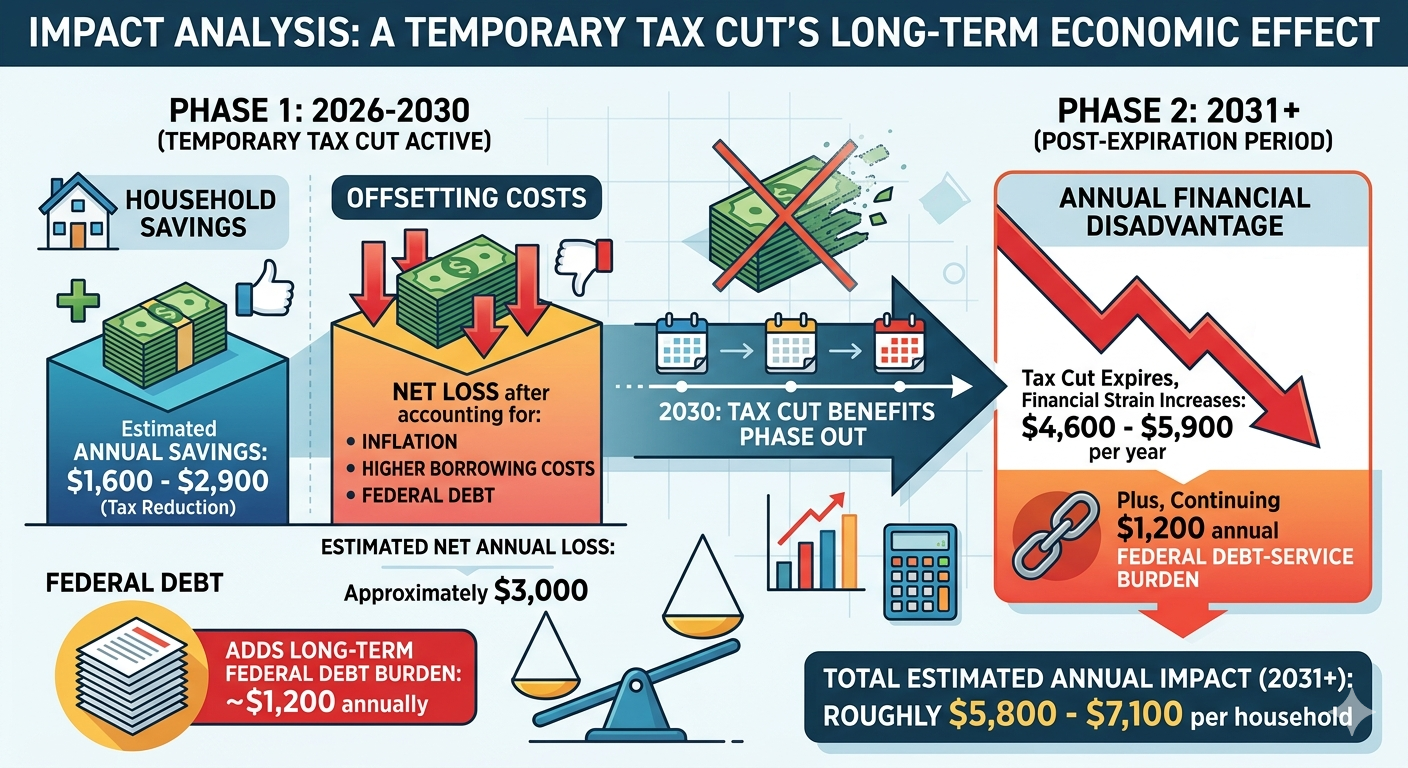
A tax cut that appeared to provide the average household with $1,600–$2,900 in annual savings was more than offset by the broader economic effects of inflation, higher borrowing costs, and increased federal debt. After accounting for these costs, the average household experienced an estimated net loss of approximately $3,000 per year, along with an additional long-term federal debt burden equivalent to roughly $1,200 annually.
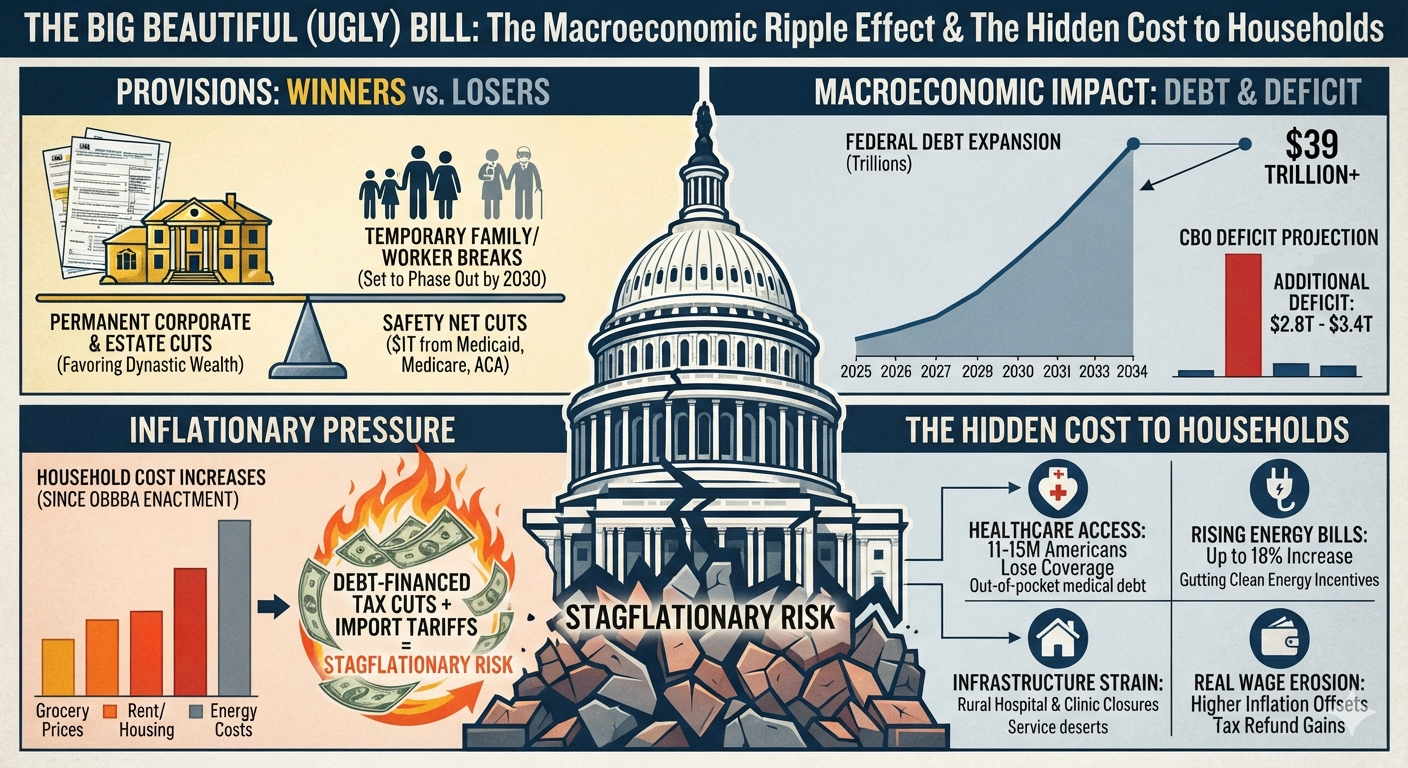
However, the tax cut benefits are scheduled to phase out by 2030, meaning households will eventually lose the temporary savings while many of the costs associated with higher debt, interest payments, and elevated borrowing rates remain. Beginning in 2031, when the tax reduction expires, the average household’s annual financial disadvantage could increase to approximately $4,600–$5,900 per year, plus the continuing $1,200 annual federal debt-service burden. This would place the total estimated impact at roughly $5,800–$7,100 per household annually, while the accumulated federal debt continues to shift additional costs onto future taxpayers.
Tax Cuts vs. Inflation: The Hidden Battle Over Household Purchasing Power
Tax cuts are often promoted as a direct way to improve household finances, but for the average American family, inflation can have a much larger and more immediate impact on financial well-being. A tax cut may provide a noticeable boost to income, but a sustained period of elevated inflation can quietly reduce purchasing power by thousands of dollars each year.
For a typical middle-income household, a broad tax reduction might save several hundred to a few thousand dollars annually. However, inflation affects the entire household budget—including housing, groceries, utilities, transportation, healthcare, and services. A 4%–5% annual inflation rate can easily increase household expenses by $3,500–$5,000 per year, effectively overwhelming the benefit of many tax cuts.
The result is a simple economic reality: a dollar gained through tax cuts can be offset—or even erased—by dollars lost through higher prices.
The Mathematical Mismatch: Tax Savings vs. Inflation Costs
Tax Cuts Provide Limited Annual Gains
For most middle-class households, federal tax cuts typically produce moderate savings rather than dramatic changes in disposable income. Historical analyses of broad tax packages, including evaluations by organizations such as the Tax Policy Center, have shown that middle-income families often receive annual tax reductions in the range of roughly $1,600 to $2,900, depending on the structure of the legislation. The most recent tax cuts saved the average household $1,600 and $2,900.
While meaningful, these savings represent only a fraction of a household’s total annual expenses.
Inflation Acts Like a Hidden Tax
Inflation operates differently from taxes. Rather than reducing a paycheck directly, it increases the cost of nearly everything a household buys.
A family spending $80,000 annually on goods and services would experience approximately:
4% inflation: about $3,200 in additional annual costs
5% inflation: about $4,000 in additional annual costs
6% inflation: about $4,800 in additional annual costs
Unlike a tax cut, which may provide a one-time or annual benefit, inflation compounds year after year. Even if wages rise, households can still lose purchasing power if prices increase faster than incomes.
Distribution of Benefits vs. Distribution of Burdens
Tax Cuts Often Deliver Larger Dollar Benefits to Higher-Income Households
Income tax reductions generally scale with taxable income. Higher-income households typically pay more in taxes, so percentage-based tax cuts often produce larger dollar savings at the top.
Analyses from organizations such as the Congressional Budget Office have repeatedly shown that broad tax changes frequently provide the largest absolute benefits to higher-income groups, while middle- and lower-income households receive smaller dollar amounts.
Inflation Disproportionately Hurts Lower- and Middle-Income Families
Inflation is often described as a regressive economic force because it affects essential spending categories that consume a larger share of lower-income household budgets.
A wealthy household can often absorb higher prices by reducing discretionary spending or shifting purchases. A working-class family has fewer options when facing increases in:
Food prices
Rent or mortgage payments
Electricity and heating costs
Gasoline and transportation
Healthcare expenses
For families living close to their monthly budget limits, inflation functions like a pay cut.
The Inflation Feedback Loop
Tax cuts can stimulate economic activity by increasing disposable income. However, if tax reductions are not matched by spending reductions or productivity gains, they can increase demand in an economy already operating near capacity.
The mechanism is straightforward:
Tax cuts increase household disposable income.
Increased income boosts consumer demand.
If supply cannot expand quickly enough, businesses raise prices.
Higher prices reduce the purchasing power of the original tax cut.
In this scenario, households may receive additional money in their paycheck while simultaneously paying more at the grocery store, gas station, and utility bill.
The economic benefit becomes partially or completely offset by rising prices.
The Federal Debt Effect: How Tax Cuts Can Increase Long-Term Costs
Tax cuts also have a broader economic impact beyond the immediate benefit to taxpayers. When tax reductions are not accompanied by equivalent spending reductions or stronger economic growth, they increase the federal budget deficit and add to the national debt. The government must finance that additional debt by issuing more Treasury securities, increasing the supply of government borrowing.
As federal debt rises, the government competes with households and businesses for available capital. This increased demand for borrowed money can place upward pressure on interest rates, raising the cost of mortgages, auto loans, credit cards, business financing, and other forms of credit.
The effect is often indirect but significant. A household may receive a $2,000 annual tax reduction, but if higher federal borrowing contributes to even a modest increase in interest rates, that same family may pay thousands of dollars more over time through:
Higher mortgage rates when purchasing or refinancing a home
Increased interest on auto loans
Higher credit card balances
More expensive consumer financing
Higher costs passed through by businesses borrowing at elevated rates
For example, a 1% increase in mortgage rates on a $300,000 home loan can add roughly $200 per month to a typical 30-year mortgage payment—more than $2,000 annually. Across the economy, higher interest rates also increase the federal government’s own debt-service costs, requiring more taxpayer dollars to pay interest rather than fund public services or reduce future deficits.
This creates a potential feedback loop:
Tax cuts reduce federal revenue.
Larger deficits increase government borrowing.
Higher debt levels put upward pressure on interest rates.
Higher rates increase borrowing costs for households, businesses, and the government.
Additional interest expenses reduce the long-term economic benefit of the original tax cut.
The ultimate measure of a tax policy is therefore not only the size of the immediate tax reduction, but its effect on total household purchasing power after accounting for inflation, interest rates, and the long-term cost of increased federal debt.
The Role of Bracket Creep
Inflation also affects taxation through a process known as bracket creep.
As wages rise due to inflation, taxpayers can unintentionally move into higher tax brackets even though their real purchasing power has not increased. To address this, the Internal Revenue Service adjusts federal income tax brackets, standard deductions, and other thresholds annually for inflation.
These adjustments prevent inflation from automatically increasing a household’s tax burden. However, they do not compensate for the broader loss of purchasing power caused by rising prices.
Inflation indexing protects taxpayers from paying higher taxes simply because of inflation—it does not make groceries, housing, or energy affordable again.
Conclusion: The True Measure Is Total Economic Impact
Tax cuts can provide meaningful benefits to households, but their true economic value cannot be measured by the size of the immediate reduction in a tax bill alone. A complete evaluation must consider the broader effects on purchasing power, inflation, interest rates, and the long-term federal debt burden.
A tax cut may increase disposable income in the short term, but those gains can be diminished or even erased when inflation raises the cost of everyday necessities such as housing, food, energy, and transportation. Unlike a one-time tax reduction, inflation affects the entire household budget and compounds over time, reducing what each dollar can actually buy.
The impact also depends on how tax cuts are financed. When reductions in federal revenue are not matched by spending cuts or sufficient economic growth, they increase budget deficits and add to the national debt. Higher federal borrowing can place upward pressure on interest rates, increasing costs for mortgages, auto loans, credit cards, and business financing. Households may receive additional money through lower taxes while simultaneously paying more through higher borrowing costs and rising prices.
This creates a broader economic equation:
The benefit of a tax cut is not simply the dollars returned to taxpayers—it is the change in real purchasing power after accounting for inflation, interest rates, and future debt obligations.
For some households, especially higher-income taxpayers, tax reductions may provide substantial direct benefits. However, for many middle- and lower-income families, the effects of inflation and higher interest rates can outweigh those gains because they spend a larger share of their income on necessities and borrowing costs.
The ultimate question is therefore not:
“How much did taxpayers save in taxes?”
The more important question is:
“Did households become financially better off after accounting for the full economic consequences?”
A sustainable economic policy must balance tax relief with fiscal responsibility, price stability, and long-term economic growth. Without that balance, a tax cut can create the appearance of increased prosperity while shifting costs into higher prices, higher interest payments, and a larger debt burden for future generations.
ADDENDUM
The exact “net cost” depends on the household’s income, debt exposure, and whether the tax cuts are financed by borrowing. A reasonable estimate can be made by separating immediate annual effects from long-term debt effects.
Estimated Annual Impact on an Average Household
Item
Annual Impact
Tax cut benefit
+$1,600 to +$2,900
4% inflation increase in household expenses
−$3,200
Higher mortgage costs (if buying/refinancing)
−$2,000+
Higher auto loan, credit card, and consumer financing costs
−$500 to −$2,000+
Higher business borrowing costs passed through in prices
−$300 to −$1,000+
Additional federal debt interest burden
−$900 to −$1,500+ annually (estimated)
Short-Term Net Effect (First-Year Estimate)
Lower-cost scenario:
Tax savings: +$2,900
Inflation cost: −$3,200
Consumer borrowing/business costs: −$800
Debt interest effect: −$900
Net impact: approximately −$2,000 per household per year
Higher-cost scenario:
Tax savings: +$1,600
Inflation cost: −$3,200
Mortgage/borrowing costs: −$3,000
Debt interest effect: −$1,500
Net impact: approximately −$6,100 per household per year
Long-Term Federal Debt Effect
If tax cuts add $3–$5 trillion to federal debt:
There are roughly 130 million U.S. households.
The added debt equals approximately:
130 million households$3 trillion≈$23,000 per household130 million households$5 trillion≈$38,000 per household
That does not mean each household receives a bill, but it represents the additional federal liability ultimately supported by taxpayers.
If the government pays roughly 4% interest on that additional debt:
$3 trillion × 4% = $120 billion/year
$5 trillion × 4% = $200 billion/year
Spread across households:
$900–$1,500 per household annually in additional federal interest costs
Over decades, if the debt is refinanced and interest compounds, the total burden can become substantially larger.
Other Potential Costs Associated With Large Tax Cuts
1. Reduced fiscal flexibility
Higher debt can limit the government’s ability to respond to:
recessions
natural disasters
pandemics
military emergencies
infrastructure needs
Future taxpayers may face higher taxes or spending cuts to service the debt.
2. Higher interest rates
Large deficits can increase demand for borrowed funds, putting upward pressure on interest rates. This affects:
mortgages
business loans
student loans
auto loans
government borrowing costs
3. Crowding out private investment
When the government absorbs more available capital:
businesses may invest less
productivity growth can slow
wage growth may weaken over time
4. Inflation risk
If tax cuts increase demand without increasing supply, they can contribute to inflationary pressure, especially when the economy is already near capacity.
Estimated Net Household Effect
Time Frame
Estimated Impact
Immediate annual effect
−$2,000 to −$6,000 per household
Added federal debt liability
+$23,000 to +$38,000 per household
Annual debt-service burden
−$900 to −$1,500 per household/year
Bottom Line
A tax cut that appeared to provide an average household with $1,600–$2,900 in annual savings was far outweighed by the broader economic effects of inflation, higher borrowing costs, and increased federal debt. The average household had a net loss of $3,000 and an additional debt burden of $1,200/year. For many households, the combined impact may represent a net financial loss of several thousand dollars per year, while the long-term debt burden shifts additional costs onto future taxpayers.
Philadelphia is forecast to experience a critical heat emergency on July 4, with heat index values expected to reach 91–95°F under dangerously humid conditions. Even modest physical exertion outdoors can increase the risk of heat exhaustion, heat stroke, and, in severe cases, death.
Extreme heat is more than uncomfortable—it is one of the deadliest weather hazards. Beyond its immediate health risks, exposure to extreme heat accelerates biological aging by increasing cellular stress, damaging tissues, and contributing to telomere shortening.
What Is FIFA Doing?
Rather than postponing the Round of 16 match, FIFA plans to proceed while implementing heat mitigation measures for players and spectators.
Player Safety Measures
Mandatory Hydration Breaks: FIFA requires official cooling and hydration breaks during matches when heat conditions warrant them to reduce the risk of heat-related illness.
Sideline Cooling: Philadelphia Stadium (Lincoln Financial Field) has installed cooling benches along the sidelines, allowing substituted players and those receiving treatment to lower their body temperature more quickly.
Fan Safety Measures
Outside Water Restrictions: Despite the dangerous heat, FIFA has updated its stadium code of conduct to prohibit spectators from bringing outside or reusable plastic water bottles into the stadium for refilling. Fans must instead obtain drinking water through stadium concessions and designated distribution points.
Weather Monitoring: Organizers are coordinating with the National Weather Service because the combination of extreme heat and the potential for severe Fourth of July thunderstorms could require temporary suspensions of play or crowd sheltering if lightning is detected within FIFA’s safety perimeter.
Cooling Centers: The City of Philadelphia is operating additional medical stations and cooling areas throughout the stadium complex and at the FIFA Fan Festival at Lemon Hill to assist visitors experiencing heat stress.
Heat Is a Serious Public Health Hazard
Hydration, shade, and cooling breaks help reduce risk, but they cannot eliminate it. Anyone attending outdoor events should avoid unnecessary exertion, drink fluids before becoming thirsty, seek shade whenever possible, and recognize the warning signs of heat exhaustion and heat stroke.
Climate change is making extreme heat events more frequent, longer-lasting, and more humid. As temperatures continue to rise, organizers of major outdoor sporting events will increasingly face difficult decisions about balancing competition with public safety.
Regardless of the precautions taken, exposing athletes, officials, and tens of thousands of spectators to unnecessary risk during a critical heat emergency is difficult to justify. Hydration breaks and cooling stations can reduce risk, but they cannot eliminate it. When dangerous heat reaches levels known to threaten human health, the responsible course of action is to postpone play until conditions are safe. No sporting event is worth risking heat-related illness, permanent injury, or loss of life.
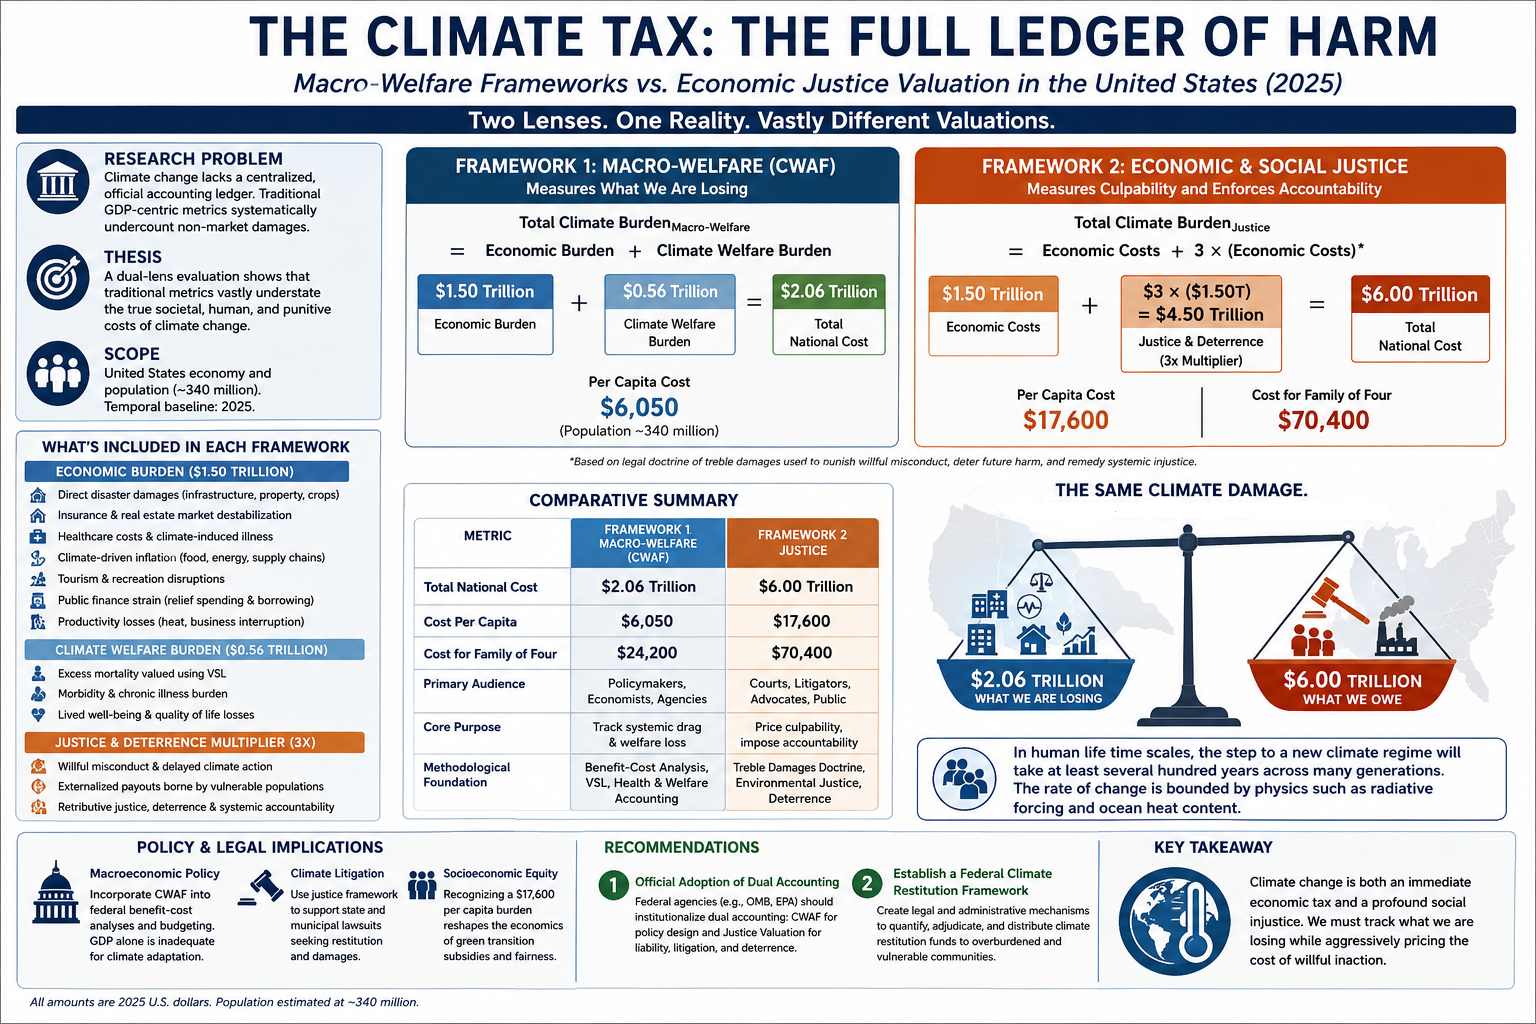
Macro-Welfare Frameworks vs. Economic Justice Valuation in the United States
Daniel Brouse and Sidd Mukherjee
I. Introduction
A. Research Problem
Climate change imposes large and growing costs on the United States, yet there is still no centralized national ledger that captures the full burden in a unified way. Conventional economic indicators—especially GDP, insured losses, and direct disaster tallies—systematically undercount the real cost of climate disruption because they omit or minimize non-market harms such as premature mortality, reduced life expectancy, chronic illness, degraded quality of life, ecological destabilization, and the unequal distribution of climate damages across vulnerable populations.
A narrow GDP-centered framework also fails to capture a second dimension of climate cost: accountability. A large share of today’s climate burden is not simply the product of random weather volatility. It is the cumulative result of delayed mitigation, externalized damages, underpriced emissions, regulatory failure, and in some cases decades of deception regarding the risks of fossil-fuel dependence. That means climate accounting must confront not only what climate change is costing the economy, but also what it should cost under a framework of social justice and deterrence.
B. Thesis Statement
Evaluating the 2025 U.S. cost of climate change requires moving beyond direct disaster losses and beyond GDP-centered accounting. Using a dual-lens approach, it compares:
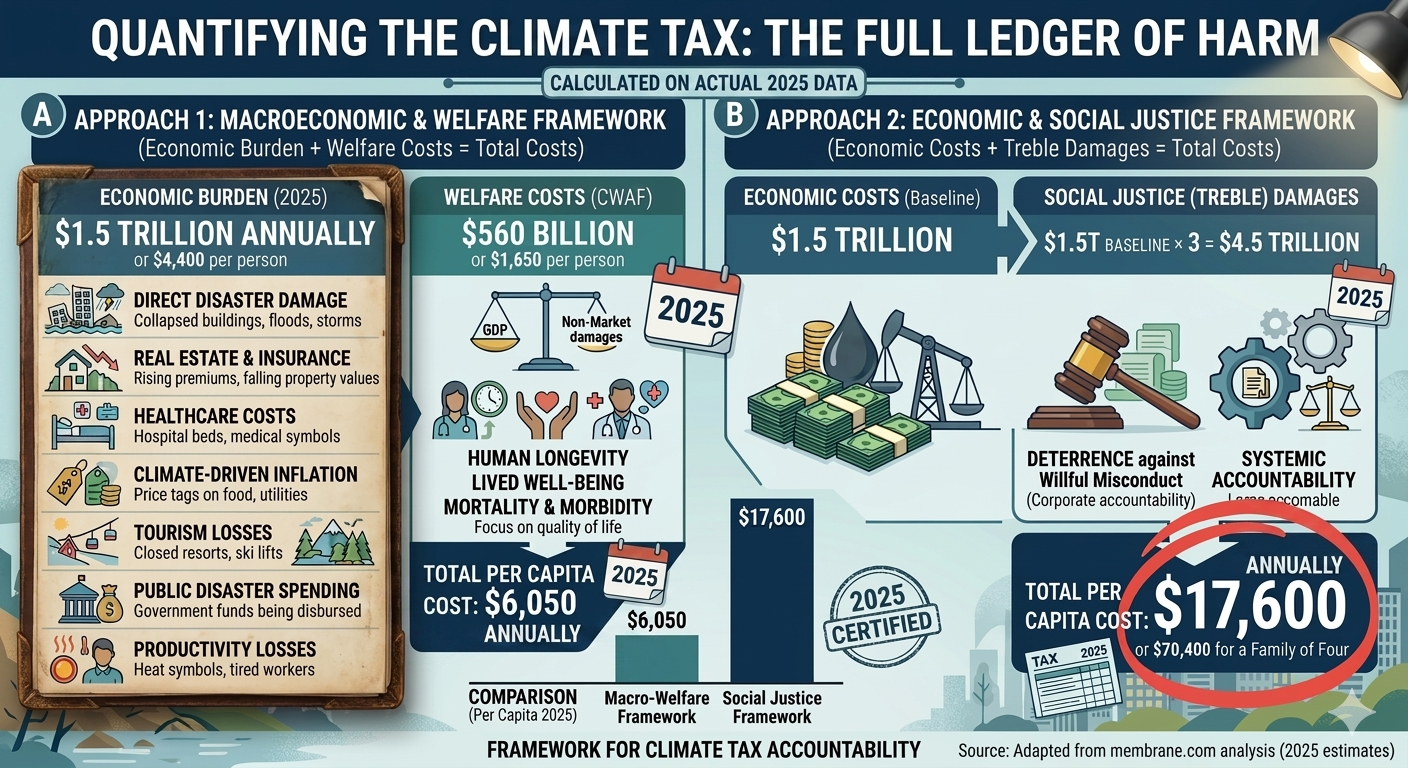
a Macroeconomic and Welfare Framework, which estimates the 2025 U.S. climate burden at approximately $2.06 trillion, or about $6,050 per person, and
an Economic and Social Justice Framework, which applies a treble-damages logic to climate-linked economic harms and yields a 2025 burden of approximately $6.0 trillion, or about $17,600 per person.
The core claim is that traditional economic metrics substantially understate the true societal burden of climate change. Climate damages should be understood not only as macroeconomic drag and welfare erosion, but also as a form of externalized injury with distributive, ethical, and potentially punitive dimensions.
C. Scope of the Study
This study focuses on the United States in calendar year 2025. Per-capita values are based on a U.S. population baseline of approximately 340 million residents. The analysis is national rather than state-specific and is intended as a high-level accounting framework rather than a final litigation damages model.
II. Methodology 1: The Macroeconomic and Welfare Framework
A. Conceptual Architecture
The first framework combines two components:
Economic burden: the direct and indirect market-facing costs imposed by climate change in 2025; and
Climate welfare burden: the non-market human costs associated with mortality, life-expectancy loss, morbidity, and degraded quality of life.
For 2025, the study uses the following central values:
$1.50T + $0.56T = $2.06T
On a per-capita basis:
$2.06T / 340M = $6,059 ≈ $6,050 per person
This can also be expressed as:
$4,400 + $1,650 = $6,050
where:
$4,400 per person is the estimated economic burden, and
$1,650 per person is the estimated climate welfare burden.
B. The Economic Burden Baseline: $1.5 Trillion ($4,400 per Capita)
The economic burden baseline is designed to capture the direct and indirect market-facing cost of climate change in the United States in 2025. It includes seven broad categories of loss.
1. Direct disaster damages
This category includes physical destruction from hurricanes, inland flooding, wildfires, convective storms, drought-related losses, heat-related infrastructure damage, and other extreme-weather events. It covers residential, commercial, public-sector, insured, and uninsured losses.
2. Real estate and insurance destabilization
Climate change is increasingly priced into property markets and insurance markets through higher premiums, policy nonrenewals, shrinking insurability, reserve stress, and geographic repricing of risk. These effects act as a quasi-tax on households, businesses, and municipalities even in years without a single catastrophic event.
3. Healthcare and health-insurance costs
Heat stress, wildfire smoke, respiratory disease, cardiovascular strain, injuries, mental-health burdens, and other climate-related medical effects increase both direct healthcare spending and insurance costs. These costs are counted here only insofar as they represent market expenditures rather than welfare losses already captured separately in the climate welfare framework.
4. Climate-driven inflation and household cost pressure
Climate shocks increase the price of food, electricity, water, transportation, and household essentials through crop disruption, supply-chain interruption, infrastructure stress, and energy-demand spikes. These effects function as a hidden climate tax on households and are treated as part of the economic burden.
5. Tourism and recreation losses
Climate volatility disrupts beach economies, ski industries, lake and river recreation, outdoor events, park visitation, and seasonal tourism revenue. The direct revenue loss belongs in the economic burden, while the lost enjoyment and diminished lived experience belong more naturally in the welfare framework.
6. Public finance and fiscal burden
Federal, state, and local governments increasingly absorb climate costs through disaster relief, infrastructure repair, emergency response, insurance backstops, and climate-related borrowing. These expenditures represent real public resource costs even when financed through debt.
7. Productivity losses
Heat stress, smoke exposure, flooding, power outages, transportation interruption, and business downtime reduce labor productivity and economic output. These losses are among the most undercounted but economically significant climate costs.
Taken together, these categories produce a 2025 U.S. economic burden estimate of approximately $1.5 trillion.
On a per-capita basis:
$1.50T / 340M = $4,412 ≈ $4,400 per person
This figure is intended as an integrated estimate of the market-facing annual climate burden imposed on the United States in 2025.
C. The Climate Welfare Accounting Framework (CWAF): $560 Billion ($1,650 per Capita)
The second component of Framework 1 is the Climate Welfare Accounting Framework (CWAF), which measures the direct erosion of human well-being from climate change. CWAF is designed to capture losses that do not appear clearly in GDP or conventional market accounts, including premature mortality, reduced life expectancy, chronic morbidity, and diminished quality of life.
1. CWAF structure
CWAF is organized around three pillars:
Pillar A: Mortality valuation
Pillar B: Life-expectancy loss
Pillar C: Morbidity and quality-of-life loss
The raw component identity is:
CWAF(raw) = A + B + C
Using the central estimates in this framework:
A = $375B
B = $80B
C = $180B
So the raw component sum is:
$375B + $80B + $180B = $635B
However, because mortality, life-year loss, and morbidity estimates can overlap at the margins even after careful structuring, the framework applies a conservative overlap adjustment and presents a central CWAF estimate of approximately $560 billion rather than the full raw sum of $635 billion.
Thus:
CWAF raw central estimate = $635B
CWAF adjusted central estimate ≈ $560B
On a per-capita basis:
$560B / 340M = $1,647 ≈ $1,650 per person
2. Pillar A: Mortality valuation
Pillar A estimates the welfare cost of climate-attributable premature mortality using the Value of a Statistical Life (VSL) framework used in federal regulatory analysis.
The stylized formula is:
A = D × VSL
where:
D = estimated climate-attributable premature deaths in 2025
VSL = value of a statistical life
Pillar A is treated as a contemporaneous willingness-to-pay valuation of mortality risk, not as a decomposition of life-years. Because Pillar A values mortality using a contemporaneous VSL, discounting is primarily relevant to Pillar B and to any portion of Pillar C that reflects future streams of lost healthy life rather than same-year welfare loss.
3. Pillar B: Life-expectancy loss
Pillar B captures the welfare loss associated with reductions in healthy life expectancy caused by heat exposure, smoke exposure, chronic disease burdens, and other climate-linked pathways that may not appear as immediate mortality events in a single-year accounting frame.
The stylized formula is:
B = Σ(LYᵢ × VSLY)
where:
LYᵢ = climate-attributable life-years lost for group i
VSLY = value of a statistical life-year
Pillar B is constructed as a non-overlapping residual welfare component and is not derived by mechanically decomposing Pillar A’s VSL estimate into life-years. Instead, it captures life-expectancy and health losses not already subsumed within the mortality valuation framework used in Pillar A. Put differently, Pillar A (VSL-based mortality valuation) captures the welfare equivalent of premature mortality as a contemporaneous risk realization, while Pillar B is calibrated to exclude mortality already captured in Pillar A and instead reflects residual life-expectancy and morbidity effects not subsumed by VSL valuation.
4. Pillar C: Morbidity and quality-of-life loss
Pillar C estimates the welfare cost of climate-driven morbidity, including heat-related illness, smoke-related respiratory burdens, mental-health stress, chronic disease aggravation, and other forms of degraded physical and psychological well-being.
The stylized formula is:
C = Σ(Qᵢ × Vᵢ)
where:
Qᵢ = quantity of climate-attributable morbidity burden for condition i
Vᵢ = monetized welfare value associated with that burden
This pillar can be operationalized using QALY, DALY, or related health-welfare valuation methods.
D. Summary of Framework 1
The Macroeconomic and Welfare Framework yields the following 2025 estimate:
$1.50T + $0.56T = $2.06T
Per capita:
$2.06T / 340M = $6,059 ≈ $6,050 per person
For a family of four:
4 × $6,050 = $24,200
Framework 1 therefore estimates that climate change imposed a 2025 macro-welfare burden of roughly $2.06 trillion on the United States, equivalent to about $6,050 per person or $24,200 for a family of four.
III. Methodology 2: The Economic and Social Justice Framework
A. Conceptual Architecture
Framework 2 asks a different question. Instead of measuring only the annual economic and welfare burden of climate change, it asks what the ledger would look like if climate damages were valued through a justice and deterrence lens, analogous to legal doctrines that multiply proven damages in response to willful misconduct, fraud, or socially destructive externalization of harm.
This framework begins with the same $1.5 trillion economic damage baseline used in Framework 1, but applies a treble-damages logic to those economic damages only.
Let:
E = Economic Climate Damages = $1.5T
Then the justice framework is:
Justice Cost = E + 3E = 4E
Substituting the 2025 baseline:
$1.5T + 3($1.5T) = $6.0T
Equivalently:
4 × $1.5T = $6.0T
On a per-capita basis:
$6.0T / 340M = $17,647 ≈ $17,600 per person
For a family of four:
4 × $17,600 = $70,400
Why the treble multiplier is applied only to the $1.5T economic burden
The treble-damages multiplier is applied only to the market-facing economic damage ledger ($1.5T), not to the CWAF welfare component ($560B). This choice is intentional. The justice framework is designed as a liability-style multiplier on economic damages—that is, on direct and indirect market harms such as property destruction, insurance destabilization, healthcare spending, public fiscal outlays, productivity loss, and climate-driven price pressures. By contrast, the CWAF already monetizes non-market welfare harms such as mortality risk, life-expectancy degradation, and morbidity-related quality-of-life loss. Trebling those welfare values would risk both conceptual double counting and an analytically awkward punitive replication of already-imputed welfare losses. Accordingly, Framework 2 should be understood as a justice-weighted escalation of the economic climate ledger, not as a trebling of the entire macro-welfare burden.
This framework is therefore not presented as a conventional welfare-economics estimate. It is a normative legal-economic framework designed to reflect accountability, deterrence, and the uneven distribution of climate harm.
B. The Legal Foundation of Treble Damages
Treble damages are a long-established feature of U.S. law in contexts where ordinary compensation is considered inadequate to deter or punish egregious misconduct. They appear most prominently in:
Antitrust law, including the Sherman Act
Civil racketeering actions, including RICO-based claims
False Claims Act enforcement, where fraud against the public fisc can trigger multiplied damages
The logic of treble damages is not merely compensatory. It is also punitive and deterrent. Trebling recognizes that some harms are imposed through conduct sufficiently reckless, deceptive, or socially damaging that ordinary compensation fails to capture either the full social cost or the need for institutional deterrence.
C. Application to Climate Justice
The justice framework applies this legal logic to climate damages on the theory that a substantial share of modern climate costs reflects not only physical climate change, but also delayed mitigation, historic externalization of damages, and sustained campaigns of misinformation or obstruction that prolonged fossil-fuel dependence and delayed adaptation.
Three considerations motivate the treble-damages approach:
1. Willful misconduct and delayed action
If major emitters or institutions knowingly delayed action while externalizing foreseeable climate harms onto the public, then a purely compensatory accounting of damages may understate the true social cost of that conduct.
2. Unequal distribution of harm
Climate damages are not evenly distributed. Lower-income households, communities of color, medically vulnerable populations, outdoor workers, and disaster-prone regions often bear disproportionate burdens. A justice framework therefore recognizes that climate losses are not merely aggregate economic losses but also distributional injuries.
3. Deterrence and accountability
A damages framework that merely reimburses a fraction of direct losses may fail to deter future misconduct. A justice-oriented framework treats climate damages as the basis for a larger accountability regime aimed at shifting incentives, strengthening disclosure, and pricing the cost of willful inaction.
IV. Comparative Analysis
A. Aggregate Results
The two frameworks produce sharply different valuations of the 2025 U.S. climate burden.
Metric
Framework 1: Macro-Welfare
Framework 2: Justice
Economic burden baseline
$1.50 trillion
$1.50 trillion
Welfare burden (CWAF)
$0.56 trillion
—
Treble-damages penalty on economic burden
—
$4.50 trillion
Total national cost
$2.06 trillion
$6.00 trillion
Cost per capita
$6,050
$17,600
Cost for family of four
$24,200
$70,400
Framework 1 estimates the full annual burden of climate change on the economy and on human welfare. Framework 2 estimates the justice-weighted accountability cost of climate harm if society chose to treat delayed mitigation and externalized damages as punishable economic injury.
B. Analytical Differences Between the Frameworks
1. Audience and institutional use
Framework 1 is primarily relevant to:
fiscal policy analysts
macroeconomists
central banks
public-health planners
federal agencies conducting benefit-cost analysis
Framework 2 is more relevant to:
litigators
state attorneys general
municipal plaintiffs
tort scholars
climate-justice advocates
2. Philosophical foundation
Framework 1 measures systemic drag, welfare erosion, and hidden social cost. It asks: What is climate change costing the country in real economic and human terms right now?
Framework 2 measures culpability, deterrence, and social restitution. It asks: What would climate damages look like if society priced not only the injury itself, but also the institutional misconduct that helped produce and intensify it?
3. Risk allocation
Framework 1 reveals the extent to which climate change already functions as a hidden national tax on households, businesses, and governments. Framework 2 goes further by reallocating that burden conceptually back toward those who knowingly profited while imposing climate costs on others.
V. Policy, Legal, and Economic Implications
A. Macroeconomic Policy
The first implication is that GDP alone is no longer an adequate climate accounting tool. A country can rebuild after a flood, spend more on medical care, or borrow more for disaster relief, and those expenditures may still appear as positive economic activity in national accounts even as the underlying social condition worsens.
Incorporating macro-welfare climate accounting into federal analysis would improve:
Office of Management and Budget benefit-cost analysis
federal adaptation planning
public-health prioritization
insurance and housing policy
long-run fiscal projections
A climate burden of roughly $2.06 trillion in 2025, or about $6,050 per person, implies that climate change already functions as a material macroeconomic drag on the United States.
B. Climate Litigation and Tort Reform
The second implication is legal. The justice framework provides a conceptual bridge between aggregate climate economics and climate liability. If climate damages are increasingly litigated through state, municipal, and public-nuisance actions, a framework that translates economic harm into a deterrence-oriented damages structure may become increasingly relevant.
This does not mean courts should automatically adopt a 3x multiplier in climate litigation. Rather, it suggests that climate damages can be conceptualized not merely as diffuse acts of nature, but as partly socialized harms linked to historic patterns of concealment, delay, and cost externalization.
C. Socioeconomic Equity
A third implication concerns equity. If the annual climate burden is framed as $17,600 per person under a justice-based model, the economics of adaptation, resilience spending, green infrastructure, household subsidies, and climate restitution look very different. The scale of the burden implies that aggressive decarbonization and resilience investment may be economically justified not merely as environmental policy, but as partial relief from a large and regressive climate tax.
VI. Limitations
Several limitations should be acknowledged.
A. Framework 1 limitations
The macro-welfare framework is a synthetic accounting model rather than a single-source official estimate. Its economic burden baseline aggregates multiple categories of loss that are themselves subject to uncertainty, overlap, and incomplete attribution. The CWAF component similarly relies on bounded welfare estimates rather than a single fully observed national health ledger.
B. Framework 2 limitations
The justice framework is explicitly normative. It is not a standard welfare-economic estimate and should not be confused with a measured national-income loss. Its treble-damages logic is best understood as a legal-economic thought experiment grounded in deterrence and accountability rather than as a conventional national-accounts statistic.
C. Attribution limitations
Not every harmful event in 2025 can be cleanly attributed to climate change, and climate-health pathways remain unevenly measured across disease categories, geographies, and populations. As with all climate-damages accounting, results depend partly on attribution choices, valuation assumptions, and the treatment of overlap among categories.
VII. Conclusion
A. Restatement of Main Findings
This study develops a dual accounting of the 2025 U.S. climate burden.
Under the Macroeconomic and Welfare Framework, climate change imposed an estimated burden of:
$1.50T + $0.56T = $2.06T
equivalent to roughly:
$2.06T / 340M = $6,059 ≈ $6,050 per person
or:
4 × $6,050 = $24,200 for a family of four
Under the Economic and Social Justice Framework, applying a treble-damages logic to the $1.5 trillion economic burden yields:
$1.5T + 3($1.5T) = $6.0T
equivalent to roughly:
$6.0T / 340M = $17,647 ≈ $17,600 per person
or:
4 × $17,600 = $70,400 for a family of four
B. Final Synthesis
Climate change now functions in the United States as both an immediate economic tax and a profound social injustice. The first framework measures what the country is losing in output, health, welfare, and resilience. The second asks what those losses would look like if climate harm were treated not merely as misfortune, but as a large-scale social injury intensified by delayed action, externalized damages, and institutional failure.
The gap between $2.06 trillion and $6.0 trillion is therefore not a contradiction. It reflects two different but complementary questions:
What is climate change costing the United States right now?
What should climate damages cost if accountability and deterrence are taken seriously?
C. Future Research Directions
Future work should extend this framework in at least four directions:
State-level and metropolitan climate-tax estimates, especially for high-risk regions facing acute insurance, flood, heat, or wildfire stress
Sector-specific justice multipliers, particularly for fossil-fuel litigation and public-finance exposure
Improved climate-health attribution models, especially for smoke exposure, heat mortality, chronic disease aggravation, and infectious disease pathways
Dynamic multi-year climate ledgers that track the compounding interaction of direct disaster losses, welfare erosion, and legal liability over time
Appendix A. Summary Tables
A1. Framework 1: Macro-Welfare Burden
Component
Aggregate Cost
Per Capita
Economic burden baseline
$1.50 trillion
$4,400
Climate Welfare Accounting Framework (CWAF)
$0.56 trillion
$1,650
Total Framework 1 burden
$2.06 trillion
$6,050
A2. CWAF Raw Component Structure
CWAF Pillar
Low
Central
High
Mortality cost
$225B
$375B
$562.5B
Life expectancy loss cost
$40B
$80B
$140B
Morbidity / quality-of-life cost
$100B
$180B
$280B
Total welfare cost (raw component sum)
$365B
$635B
$982.5B
Note: The raw central sum of $635B is conservatively adjusted downward in the CWAF headline estimate to approximately $560B to account for overlap risk across mortality, life-year loss, and morbidity channels.
U.S. Environmental Protection Agency. (2010). Guidelines for Preparing Economic Analyses. National Center for Environmental Economics, U.S. EPA, Washington, DC. Available at: EPA Guidelines for Preparing Economic Analyses
Social cost of carbon, climate damages, and climate-economy valuation
Interagency Working Group on the Social Cost of Greenhouse Gases, United States Government. (2021). Technical Support Document: Social Cost of Carbon, Methane, and Nitrous Oxide Interim Estimates under Executive Order 13990. Washington, DC. Available at: Interagency Working Group Technical Support Document
Rennert, K., Errickson, F., Prest, B. C., Rennels, L., Newell, R. G., Pizer, W., Kingdon, C., Wingenroth, J., Cooke, R., Parthum, B., Smith, D., Cromar, K., Diaz, D., Moore, F. C., Müller, U. K., Mendelsohn, R., Anthoff, D., Rose, S., & Waldhoff, S. (2022). “Comprehensive evidence implies a higher social cost of CO₂.” Nature, 610, 687–692.
Carleton, T. A., Jina, A., Delgado, M. T., Greenstone, M., Houser, T., Hsiang, S., Hultgren, A., Jisu, K., McCusker, K., Nath, I., Rising, J., Rode, A., Seo, H. K., Viaene, A., Yuan, J., & Zhang, A. T. (2022). “Valuing the global mortality consequences of climate change accounting for adaptation costs and benefits.” The Quarterly Journal of Economics, 137(4), 2037–2105.
U.S. climate impacts, health burden, and national assessment context
U.S. Global Change Research Program. (2023). Fifth National Climate Assessment. Washington, DC: U.S. Global Change Research Program. Available at: https://nca2023.globalchange.gov/
Romanello, M., Di Napoli, C., Green, C., Kennard, H., Lampard, P., Scamman, D., Walawender, M., Ali, Z., et al. (2024). “The 2024 report of the Lancet Countdown on health and climate change: facing record-breaking threats from delayed action.” The Lancet. (Use the final journal citation details/DOI exactly as published in the version you relied on.)
A newly surfaced U.S. military intelligence debriefing from a downed F-15 pilot has ignited debate within defense and intelligence circles after describing what appears to be a highly synchronized Iranian drone formation operating as a single coordinated system during combat operations over Iran in April.
According to a report published June 23, 2026, the pilot — who later ejected and was recovered after being shot down for the second time in the conflict — observed what he described as an anomalous aerial structure before going down, raising questions about whether Iran has demonstrated a new level of autonomous drone coordination.
The “Jellyfish” Formation
Intelligence sources familiar with the debriefing say the pilot described the drone configuration as resembling a “jellyfish” in structure: a larger grouping of drones positioned above with smaller units suspended beneath, forming what appeared to be a layered, interconnected system.
Rather than behaving as independent aircraft, the drones reportedly moved in tight synchronization, acting “completely as one cohesive unit.” The pilot described flying into what felt like a densely packed “minefield of drones,” characterizing the encounter in stark and highly unusual terms.
The pilot allegedly referred to the formation as “real alien sh*t,” reflecting both the visual complexity and the unexpected coordination observed in the engagement.
If accurate, the sighting could represent a significant leap in Iranian drone warfare capability, potentially indicating advanced swarm networking that allows multiple UAVs to maintain rigid spatial geometry while executing coordinated maneuvers. Such behavior would imply a high level of autonomy, distributed control systems, and real-time coordination far beyond Iran’s publicly understood drone doctrine.
Strategic Implications
Iran’s established drone doctrine has historically emphasized low-cost mass deployment, particularly through delta-wing Shahed-style systems designed to saturate air defenses through volume rather than coordination.
If the “jellyfish” formation reflects a real capability rather than a perceptual artifact, it would suggest a marked shift toward networked autonomous swarm warfare, where drones operate as a dynamically coordinated system rather than dispersed expendable assets.
Such a capability would represent a potentially significant evolution in regional airpower dynamics — moving from mass attrition tactics toward structured, adaptive, and possibly semi-autonomous airspace denial systems.
Estimating the Per-Person Economic Burden of Extreme Weather, Insurance Destabilization, Climate Inflation, and Health Impacts
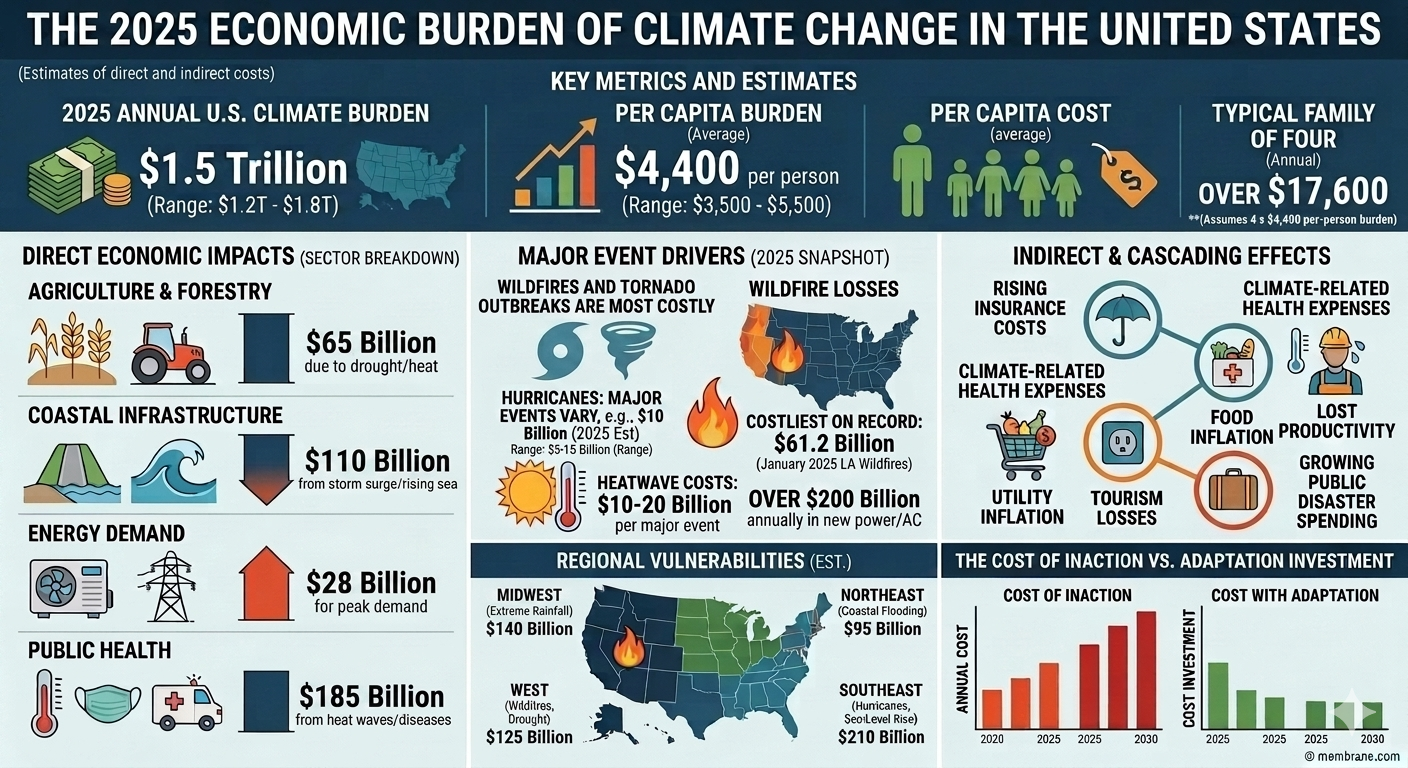
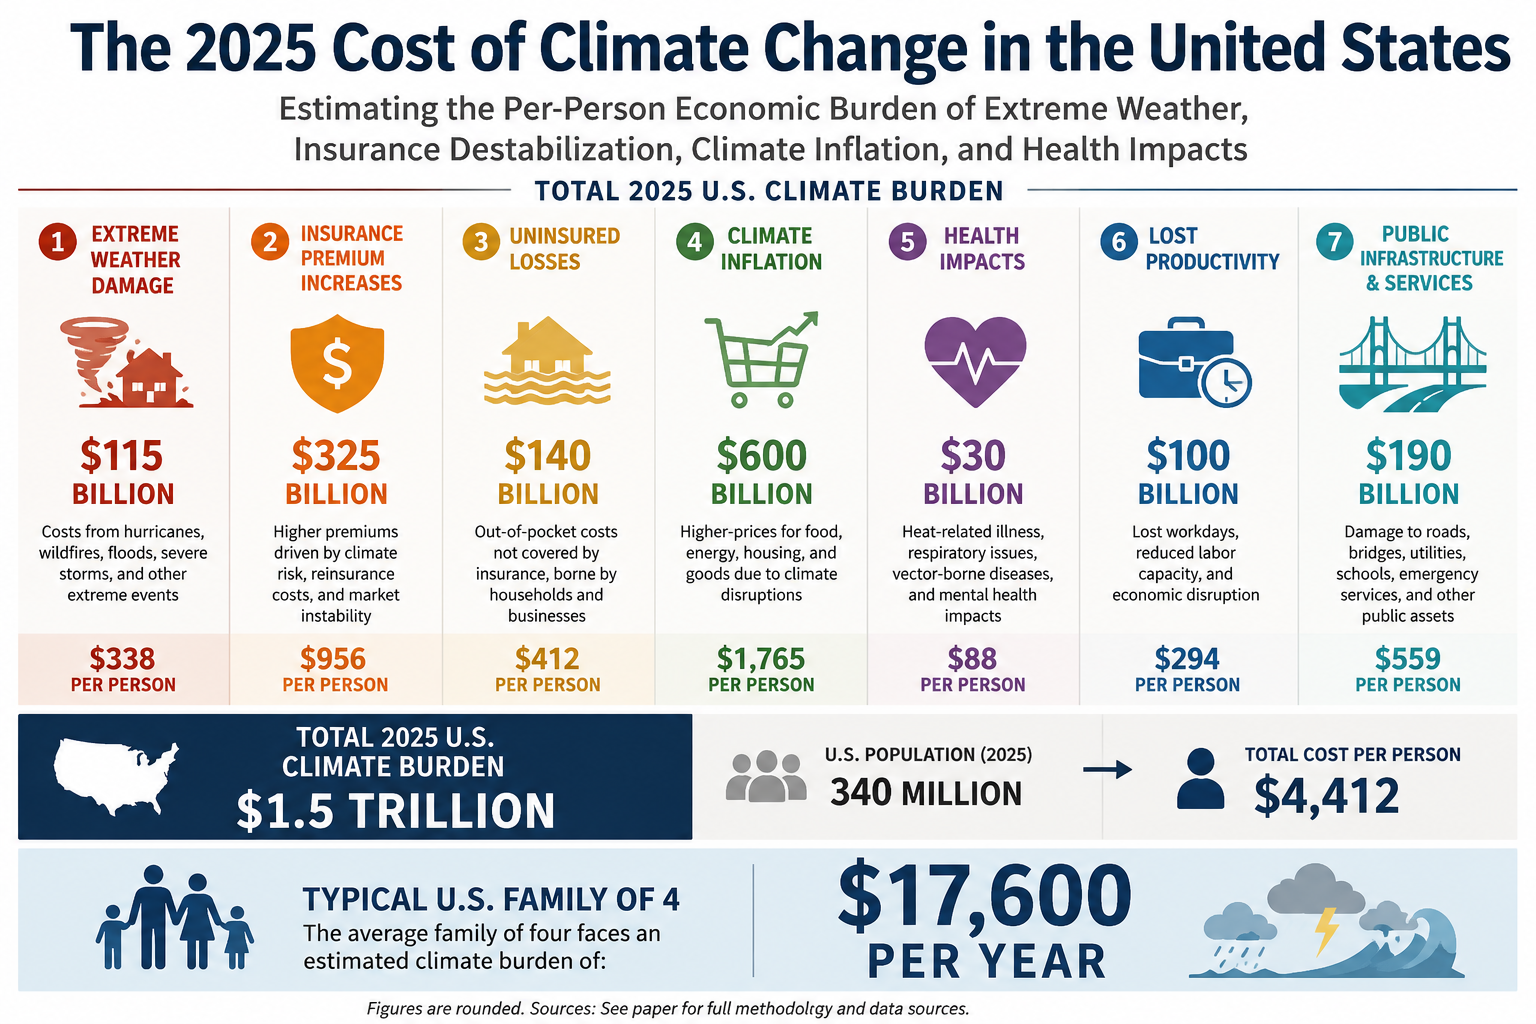
A reasonable all-in estimate for the 2025 economic burden of climate change on the United States is about $1.5 trillion, or roughly $4,400 per person. For a family of four, the implied annual burden is roughly $17,600.That burden extends far beyond direct disaster losses and includes rising insurance costs, climate-related health expenses, food and utility inflation, lost productivity, tourism losses, and growing public disaster spending.
By Daniel Brouse and Sidd Mukherjee
Abstract
Climate change in the United States is no longer best understood solely as an environmental problem or a tally of disaster losses. It has become a broad economic burden imposed on households, businesses, insurers, healthcare systems, and governments through multiple overlapping channels. In 2025, this burden extended far beyond direct storm, wildfire, flood, and heat damage. It also appeared in rising property-insurance costs, housing-market instability, climate-driven health expenses, higher utility bills, food inflation, tourism losses, public disaster spending, and reduced labor productivity.
This paper presents a bottom-up estimate of the all-in 2025 economic cost of climate change in the United States, with the goal of approximating the average cost per person when both direct and indirect burdens are considered. Because no official ledger exists for “total climate costs,” the analysis aggregates seven major categories of climate-related economic burden: (1) direct disaster damages, (2) property insurance and real-estate destabilization, (3) healthcare and health-insurance costs, (4) climate-driven inflation in food, utilities, and supply chains, (5) tourism and recreation losses, (6) government expenditures and public borrowing strain, and (7) productivity losses and business interruption.
Using a U.S. population of approximately 340 million, the paper estimates a 2025 climate burden of roughly $1.5 trillion, with a plausible range of $1.2 trillion to $1.8 trillion. On a per-person basis, this implies an average cost of approximately $4,400 per American in 2025, with a conservative range of $3,500 to $5,500 per person. For a family of four, the implied annual burden is roughly $17,600.
The core conclusion is that climate change now functions as a diffuse but powerful economic tax on American life. It raises insurance premiums, erodes home values, inflates electricity and food costs, worsens public-health burdens, strains local and federal budgets, and lowers productivity. Even when households are not directly hit by a flood, wildfire, or hurricane, they increasingly pay for climate change through the price system, the insurance system, the healthcare system, and the tax system. Climate change in the United States is therefore not just a future risk; it is already a major annual cost center embedded in the daily economy.
1. Introduction
Public discussion of climate change in the United States often focuses on dramatic physical events: hurricanes, floods, wildfires, heatwaves, droughts, and billion-dollar disasters. While those events are important, they capture only part of the actual economic burden climate change now imposes. The larger story is that climate disruption has begun to function as a system-wide cost escalator. It increases insurance premiums, weakens housing markets, strains public infrastructure, raises electricity demand, amplifies health expenses, disrupts supply chains, and inflates food prices. In short, climate change is no longer merely a source of episodic disaster losses. It is increasingly a permanent drag on household finances and national economic stability.
This distinction matters because the official accounting of climate damages remains incomplete. Annual disaster-loss tallies typically capture only direct physical damage: insured losses, destroyed structures, infrastructure repair, and some immediate business interruption. They generally do not capture the full downstream cost of heat-related illness, wildfire smoke exposure, insurance market retreat, declining property values in flood-prone communities, higher grocery bills caused by weather-related crop disruption, or the fiscal burden of repeated emergency appropriations. The result is that climate change is often underestimated as an economic force because the damage is fragmented across categories that are normally tracked separately.
The goal of this paper is to estimate the average cost per person in the United States due to climate change in 2025, including both direct and indirect costs. Rather than looking only at disaster damages, the paper uses a broader economic framework that includes the channels through which climate risk is already transmitted into everyday life. These channels include property insurance and housing destabilization, healthcare costs, health-insurance pressure, climate-driven inflation, lost tourism revenue, public fiscal strain, and lost productivity.
The premise is simple: if climate change is now affecting the economy through multiple systems at once, then measuring its burden requires more than adding up burned homes and flooded roads. It requires asking how much climate disruption is already embedded in the bills Americans pay, the risks they insure, the taxes they fund, the wages they lose, and the wealth they fail to preserve.
This paper estimates that the total 2025 climate burden on the United States was approximately $1.5 trillion, or roughly $4,400 per person. That estimate is necessarily approximate, because some categories—especially climate-related inflation and property-value impairment—cannot be measured with perfect precision. But even under conservative assumptions, the results point in the same direction: climate change is already costing the average American several thousand dollars per year, whether or not they realize it.
2. Methodology: A Bottom-Up Estimate of the 2025 Climate Burden
There is no single official database that reports the “total cost of climate change” for a given year in the United States. Any attempt to estimate that figure must therefore combine multiple categories of loss and cost transmission. The central methodological challenge is to build a broad estimate without double-counting the same damage in multiple places.
To address that, this paper separates climate costs into seven major categories and treats each as an incremental climate-attributable burden rather than as a total category expenditure. The categories are:
Direct disaster damages
Property insurance and real-estate destabilization
Healthcare and health-insurance costs
Climate-driven inflation in food, utilities, and supply chains
Tourism and recreation losses
Government expenditures and fiscal strain
Productivity losses and business interruption
The logic is not that all food inflation, all insurance inflation, or all healthcare spending is caused by climate change. Rather, the question is: what share of these burdens in 2025 can plausibly be attributed to climate disruption? The estimate therefore focuses on the incremental climate component of each category.
Using a U.S. population of 340 million, the paper translates each category’s national cost into a per-person burden. The final total is presented as a range, with a central estimate used for the headline figure.
3. Direct Disaster Damages: The Visible but Incomplete Baseline
The most visible component of climate cost is direct disaster damage: destroyed homes, burned neighborhoods, damaged roads, downed power lines, emergency response costs, and insured losses from floods, storms, wildfires, and other extreme events. These costs are widely reported because they are dramatic, immediate, and often insurable.
For 2025, a reasonable national baseline for direct disaster damages is approximately $115 billion. This reflects the year’s major climate-related disasters, including catastrophic wildfires, severe storms, flooding, and other billion-dollar events. That total is useful because it anchors the analysis in a concrete measure of visible physical damage.
But direct disaster losses are only the beginning of the story. They do not include most health impacts from wildfire smoke and extreme heat, much of the uninsured or underinsured damage absorbed by households, long-term property-value erosion in high-risk areas, or the broad inflationary effects of weather disruption on food and energy. Disaster losses therefore function here as a baseline floor, not a complete accounting of climate cost.
Using a population of 340 million, $115 billion in direct losses translates to roughly:
($115 billion) / (340 million) ≈ $338 per person
That figure is significant, but it is also misleadingly small if treated as the total climate burden. The rest of the paper shows why.
4. Property Insurance and Real-Estate Destabilization
4.1 Insurance premiums as climate transmission mechanisms
One of the clearest ways climate change now enters household budgets is through the property insurance market. As wildfire risk, hurricane losses, inland flooding, and severe convective storms intensify, insurers have raised premiums sharply, tightened underwriting standards, reduced coverage, or exited some markets entirely. These changes are not merely administrative adjustments. They are a direct financial transmission of climate risk into household cash flow.
By 2025, homeowners across the United States were already facing significantly higher insurance costs than they paid only a few years earlier. National average homeowners insurance premiums had risen sharply since 2021, outpacing wage growth and standard inflation. In high-risk states, the increases were much more severe. This means climate change is no longer just a future threat to homeownership. It is already a monthly budget issue.
To estimate the climate-driven premium burden, this paper assumes that a substantial portion of recent premium growth reflects climate-related risk repricing. With approximately 86 million owner-occupied households in the United States, even a few hundred dollars of annual climate-attributable premium increase per household produces tens of billions of dollars in national burden.
A rough estimate of the incremental 2025 climate-driven homeowners insurance burden is approximately $47 billion.
4.2 The “protection gap” and uninsured losses
Premium increases are only part of the cost. The larger and more dangerous issue is the protection gap: the widening difference between total physical losses and the portion actually covered by insurance. As climate disasters intensify, insurers increasingly protect themselves by raising deductibles, limiting coverage, or leaving risky markets altogether. The losses do not disappear. They are simply transferred to homeowners, renters, local governments, state residual insurance pools, and federal taxpayers.
This means a major disaster can impose large economic costs even when insurance coverage appears to exist on paper. Deductibles, exclusions, underinsurance, and uninsured property losses all create direct household financial stress. Local governments may also absorb part of the burden through emergency repairs, temporary housing, and infrastructure response.
For 2025, this paper estimates the protection gap and related uninsured burden at roughly $100 billion to $180 billion.
4.3 Property value impairment and housing-market destabilization
Climate change also erodes housing wealth through a slower mechanism: property repricing. Homes exposed to repeated flooding, wildfire smoke, chronic coastal inundation, or rapidly rising insurance costs become harder to insure, harder to finance, and harder to sell. Even if a home is not destroyed, the expected future cost of owning it can rise enough to depress its market value.
This effect matters because American household wealth is deeply tied to home equity. When climate risk begins to reduce resale value or increase carrying costs, the result is not merely a “real-estate issue.” It becomes a balance-sheet problem for households and a tax-base problem for municipalities.
Because these losses are diffuse and difficult to observe in real time, they are often excluded from climate accounting. Yet they are economically real. This paper conservatively assigns $100 billion to $170 billion in 2025 property-value impairment and housing-market friction costs attributable to climate exposure.
4.4 Total property and housing burden
Combining premium increases, protection-gap losses, and property-market destabilization, the total 2025 property insurance and real-estate climate burden is estimated at:
$250 billion to $400 billion
On a per-person basis, that implies:
($250 billion) / (340 million) ≈ $735 per person
to
($400 billion) / (340 million) ≈ $1,176 per person
This is one of the largest and most direct climate burdens already visible in the household economy.
5. Healthcare and Health Insurance Costs
Extreme weather does not stop at property damage. It also leaves a major financial footprint in the healthcare system. Climate-related health burdens include emergency-room visits during heatwaves, hospitalizations from smoke exposure, respiratory and cardiovascular stress during wildfire events, injuries during storms and floods, mental-health impacts from displacement and repeated disaster exposure, and rising claims associated with climate-sensitive disease patterns.
Extreme heat is especially important because it is already one of the deadliest weather-related hazards in the United States. It contributes to dehydration, kidney stress, cardiovascular strain, respiratory distress, pregnancy complications, and dangerous workplace conditions. Wildfire smoke adds another layer of harm by exposing millions of people to fine particulates and toxic compounds that can worsen asthma, heart disease, and lung injury.
These health burdens create costs through several channels:
direct medical treatment,
increased emergency-room utilization,
public-health response,
higher health-insurance claims,
employer healthcare costs,
lost workdays and reduced labor capacity.
The financial burden of these impacts is not fully visible in standard disaster-loss reporting because many of the costs are absorbed later through hospitals, insurers, employers, Medicare, Medicaid, and household medical bills. In effect, climate change raises healthcare costs not only by causing acute disasters, but by amplifying the baseline disease and treatment burden associated with heat and air pollution.
This paper estimates the incremental 2025 climate-related health and health-insurance burden at approximately:
$100 billion to $180 billion
Per person, that implies roughly:
$294 to $529 per person
A central estimate of $140 billion is reasonable for 2025, particularly given the scale of smoke exposure, heat stress, and extreme-weather-related healthcare disruptions.
6. Climateflation: Food, Utilities, and Supply-Chain Costs
6.1 Climate change as a hidden tax on household consumption
One of the most important and least appreciated channels of climate cost is inflation. Climate change increasingly acts as a hidden tax on everyday life by raising the cost of food, electricity, logistics, and consumer goods. This is not because climate change explains all inflation. It does not. But it does increase price pressure through several pathways:
drought and flood damage to crops,
livestock heat stress,
water shortages,
higher cooling demand,
power-grid strain,
storm-related transport disruption,
warehouse and refrigeration costs,
spoilage and inventory loss,
interruptions to rail, trucking, and river transport.
These pressures feed into the price system even for households that never experience a direct disaster. Climate change therefore affects family budgets not just through insurance or emergency repairs, but through recurring monthly bills for groceries, utilities, and goods whose supply chains are increasingly exposed to weather disruption.
6.2 Utility cost increases from heat
Persistent summer heatwaves raise electricity demand as homes, offices, warehouses, and hospitals rely more heavily on air conditioning. Utilities must manage higher peak demand, more stressed transmission systems, and sometimes reduced efficiency of generation and delivery infrastructure during extreme heat. These costs are passed on through higher rates, fuel adjustments, and capacity charges.
A reasonable estimate for the 2025 climate-attributable utility burden is $60 billion to $100 billion.
6.3 Food inflation and agricultural volatility
Food prices are especially vulnerable to climate disruption. Droughts, floods, heatwaves, and shifting seasonal conditions affect crop yields, planting schedules, water availability, livestock productivity, storage costs, and transport reliability. When these disruptions occur across multiple regions or commodity groups, the effect compounds. The result is not just one bad harvest, but persistent volatility across the food system.
This paper conservatively estimates that $250 billion to $350 billion of the 2025 consumer food-price burden can be attributed to climate-related agricultural and supply-chain disruption.
6.4 Supply-chain and logistics pass-through
Climate disruption also raises costs through business interruption, transportation delays, warehouse cooling expenses, spoilage, shipping rerouting, and inventory risk. These are eventually passed on to consumers and businesses across the economy.
For 2025, this paper assigns $180 billion to $250 billion to the broader supply-chain and logistics burden associated with climate disruption.
6.5 Total climateflation burden
Combining utilities, food inflation, and logistics pass-through, the total 2025 climateflation burden is estimated at:
$500 billion to $700 billion
Per person, that equals roughly:
$1,470 to $2,059 per person
This makes climateflation the single largest category in the 2025 climate burden estimate.
7. Tourism and Recreation Losses
Climate change also imposes substantial costs on local and regional economies that depend on tourism and outdoor recreation. Extreme heat, wildfire smoke, coastal flooding, beach erosion, poor snow conditions, storm damage, and unpredictable seasonal patterns all reduce tourism demand and disrupt recreation-dependent businesses.
Examples include:
park closures due to wildfire or heat,
canceled outdoor festivals and events,
lower visitation to smoke-affected regions,
shortened or erratic ski seasons,
damage to coastal tourism infrastructure,
lost restaurant, hotel, and service-sector revenue in climate-affected destinations.
These losses may seem secondary compared with insurance or health costs, but in many regions they are economically important. A canceled tourism season can mean lost wages, reduced sales-tax revenue, weakened hotel occupancy, and stress on small businesses already operating with narrow margins.
For 2025, this paper estimates the climate-related tourism and recreation burden at:
$20 billion to $40 billion
Per person, that is approximately:
$59 to $118 per person
8. Government Expenditures and Fiscal Strain
Taxpayers also bear a major share of the climate burden through public spending and public finance. Disaster relief, emergency housing, infrastructure repair, wildfire suppression, flood control, insurance backstops, and local recovery grants all require funding. These costs may be spread across federal, state, and local budgets, but they are ultimately part of the economic burden climate change imposes on the public.
In addition to direct spending, climate risk can increase the cost of borrowing for local governments. Municipal bond investors and credit-rating agencies increasingly evaluate physical climate vulnerability when assessing long-term fiscal risk. Communities facing repeated flooding, wildfire exposure, or insurance-market stress may face higher borrowing costs for roads, water systems, schools, and other routine infrastructure.
The public climate burden therefore has two components:
direct fiscal spending on response, repair, and recovery, and
higher structural financing costs for climate-exposed jurisdictions.
This paper estimates the 2025 public-sector climate burden at:
$80 billion to $120 billion
Per person, that equals roughly:
$235 to $353 per person
9. Productivity Losses and Business Interruption
A final major category is the cost of lost work, reduced productivity, and interrupted business activity. Extreme heat reduces labor output, especially in construction, agriculture, warehousing, delivery, transportation, and other outdoor or non-climate-controlled sectors. Wildfires and smoke events can shut down worksites and keep customers home. Floods and storms interrupt logistics, force evacuations, close schools, and disrupt childcare arrangements that allow people to work.
These losses matter because they spread climate costs through the labor market even when no major asset is destroyed. A family may lose income because a parent misses work during a flood recovery or because a heatwave reduces available hours. A small business may lose revenue because smoke or road closures keep customers away. A local economy may lose millions in output because transport links or utility systems fail during extreme weather.
This paper estimates the 2025 productivity and business-interruption burden at:
$120 billion to $220 billion
Per person, that equals approximately:
$353 to $647 per person
10. Summary Table: The 2025 Climate Burden in the United States
Category
Estimated 2025 U.S. climate cost
Per person
Direct disaster damages
$115 billion
$338
Property insurance + real-estate destabilization
$250–$400 billion
$735–$1,176
Healthcare + health insurance
$100–$180 billion
$294–$529
Climateflation (food, utilities, supply chains)
$500–$700 billion
$1,470–$2,059
Tourism + recreation losses
$20–$40 billion
$59–$118
Government expenditures + fiscal strain
$80–$120 billion
$235–$353
Productivity losses + business interruption
$120–$220 billion
$353–$647
11. Central Estimate
Using the midpoint of each category yields the following 2025 estimate:
This implies a total 2025 U.S. climate burden of approximately $1.5 trillion.
Dividing by a U.S. population of 340 million:
$1.5 trillion ÷ 340 million ≈ $4,412 per person
Rounded to the nearest hundred dollars:
Average 2025 climate cost per person in the United States: approximately $4,400
A reasonable conservative range is $3,500 to $5,500 per person.
For a family of four, that implies a total annual burden of approximately:
4 × $4,400 = $17,600
12. Discussion: Climate Change as an Economic Tax on American Life
The most important implication of this analysis is that climate change is already functioning as a diffuse economic tax on American life. It is not merely a matter of future risk or isolated disaster recovery. It now affects the economy through the insurance system, the housing system, the healthcare system, the utility system, the food system, and the tax system.
Most Americans will not experience the climate burden as a single line item. They will experience it as a set of pressures that appear unrelated at first glance:
a higher homeowners insurance premium,
a larger health-insurance renewal,
an unusually high summer electric bill,
more expensive groceries,
rising local taxes for infrastructure repair,
difficulty selling a flood-prone property,
missed work after a smoke event or flood,
a vacation canceled by heat, fire, or storm damage.
Taken separately, these costs may seem manageable or even invisible. Taken together, they form a substantial and growing transfer of wealth away from households and toward damage control, adaptation, emergency response, and loss absorption.
The burden also falls unevenly. Households in coastal areas, wildfire corridors, heat-prone cities, drought-exposed agricultural regions, and flood-prone inland communities often bear a much larger share than the national average. Lower-income households are especially vulnerable because they have less capacity to absorb rising insurance costs, medical bills, evacuation expenses, or repeated utility shocks. In that sense, climate change is not only an environmental stressor and an economic stressor. It is also a force that can widen inequality by imposing the heaviest burden on those with the thinnest financial buffers.
13. Conclusion
This paper estimates that the 2025 cost of climate change in the United States was approximately $1.5 trillion, equal to roughly $4,400 per person or $17,600 for a family of four. A conservative range of $3,500 to $5,500 per person captures the uncertainty in the estimate while still underscoring the scale of the burden.
The key point is not the false precision of any single number. It is the recognition that climate change now imposes a broad, recurring, and deeply embedded economic burden on the United States. Direct disaster damages remain important, but they are only one part of the story. The larger burden increasingly arrives through rising insurance costs, real-estate destabilization, health expenses, climate-driven inflation, tourism losses, public fiscal strain, and lost productivity.
In other words, climate change is no longer simply something Americans pay for after a disaster. It is something they are already paying for every month—through their premiums, utility bills, grocery receipts, taxes, healthcare costs, and weakened property values. The economic question is no longer whether climate change is expensive. It is how much of the American cost of living is now being quietly shaped by it.
Sources List
1. U.S. Billion-Dollar Disaster Data (Core Economic Loss Foundation)
5. Macroeconomic & Integrated Climate Damage Literature
Kopits, E. et al. (2025). Economic Impacts of Climate Change in the United States: Integrating and Harmonizing Evidence from Recent Studies. https://arxiv.org/abs/2509.00212
President Donald Trump announced that the United States and Iran have reached what he described as a “great settlement” that could bring an end to the current conflict and lead to a formal agreement as early as this weekend.
According to Trump, the breakthrough came after intense negotiations and recent military pressure. He characterized the development as a major diplomatic victory and suggested that Iran had ultimately agreed to terms favored by the United States.
Iranian officials, however, have offered a different account. According to their statements, the framework under discussion is largely the same memorandum of understanding that Tehran reportedly proposed weeks earlier. Iranian sources describe the arrangement as a temporary 60-day agreement that includes a ceasefire in Lebanon and the release of billions of dollars in previously frozen Iranian assets.
The differing narratives have fueled skepticism among analysts, policymakers, and observers across the political spectrum. While supporters of the administration view the announcement as a potentially significant step toward de-escalation, critics argue that the details remain unclear and that multiple previous declarations of imminent diplomatic breakthroughs have failed to produce lasting agreements. In fact, with each previous announcement, Iran appeared to strengthen its negotiating position and gain additional leverage.
“Climate-driven changes in Earth’s rotation may be contributing to navigational uncertainties that negatively affect battlefield outcomes and increase the risk of civilian casualties in contemporary conflicts.”
by Daniel Brouse and Sidd Mukherjee
Abstract
Climate change is increasingly altering the physical dynamics of Earth itself. Accelerating ice-sheet loss, sea-level rise, and large-scale redistribution of mass are changing the planet’s rotation rate, shifting its axis of rotation, and introducing increasingly nonlinear behavior into Earth system processes. Recent studies indicate that climate-driven ice melt is lengthening Earth’s day by approximately 1.33 milliseconds per century, making climate change a dominant driver of long-term rotational change. Beyond the slowing of rotation, the acceleration and third derivative (“jerk”) of these changes may represent a more significant concern because they reduce predictability within systems that depend on precise measurements of time, position, and motion. The consequences extend beyond geophysics into GPS accuracy, satellite operations, spacecraft navigation, autonomous systems, and potentially military guidance technologies. This paper examines the emerging science of climate-driven rotational change and places it within the broader context of accelerating Earth-system feedback loops and nonlinear climate dynamics.
Introduction
Earth’s rotation has never been perfectly constant. Variations occur naturally through interactions among the atmosphere, oceans, mantle, core, tides, and cryosphere. Historically, these fluctuations have remained within ranges that can be modeled and predicted through established geophysical processes.
Anthropogenic climate change is introducing a new forcing mechanism into this system. Accelerated melting of glaciers and polar ice sheets is redistributing trillions of tons of mass from high latitudes toward the oceans. This redistribution alters Earth’s moment of inertia and changes the speed and orientation of the planet’s rotation.
While changes in rotational velocity have attracted growing scientific attention, the acceleration and higher-order derivatives of those changes may prove even more significant. The third derivative, commonly referred to as “jerk,” measures how rapidly acceleration itself is changing. Increasing jerk-behavior is often a hallmark of nonlinear systems approaching new states of instability or unpredictability.
The significance of these changes extends far beyond the length of the day. Modern civilization depends upon precise timing, positioning, navigation, and reference-frame stability. Small changes in Earth’s rotational behavior can cascade through technologies that form the foundation of the modern world.
Climate Change and Earth’s Rotational Slowdown
In 2024, researchers from ETH Zurich, NASA’s Jet Propulsion Laboratory, and collaborating institutions demonstrated that climate change has become an increasingly dominant influence on Earth’s rotation. Their work showed that melting ice sheets redistribute mass from the poles toward lower latitudes, increasing Earth’s moment of inertia and slowing the planet’s rotation in a manner analogous to a spinning figure skater extending their arms.
A March 2026 analysis published in the Journal of Geophysical Research: Solid Earth quantified the effect, estimating that climate-driven ice melt is lengthening Earth’s day by approximately 1.33 milliseconds per century. While seemingly small, this represents a measurable and accelerating alteration of one of the planet’s most fundamental physical properties.
Researchers further concluded that the climate-driven component of Earth’s rotational slowdown now exceeds many natural long-term influences and may represent the most rapid climate-related rotational change observed in millions of years.
Polar Motion and the Changing Shape of Earth
The effects of ice-sheet loss are not limited to rotational speed.
As glaciers and ice sheets melt, the redistribution of water mass changes Earth’s shape and alters the position of its rotational axis. Research published in Geophysical Research Letters found that global warming has accelerated the movement of Earth’s rotational pole since the 1990s.
Several mechanisms contribute to this phenomenon:
Redistribution of meltwater toward lower latitudes.
Gravitational migration of ocean mass.
Centrifugal redistribution of water toward the equatorial bulge.
Glacial Isostatic Adjustment (GIA), in which land previously compressed by massive ice sheets slowly rebounds upward as ice disappears.
Together, these processes alter both Earth’s moment of inertia and the orientation of its spin axis. The result is a planet whose rotational geometry is changing more rapidly than at any point during the modern observational era.
The Third Derivative: Jerk-Behavior in the Earth System
Velocity measures change.
Acceleration measures changing velocity.
Jerk measures changing acceleration.
In engineering, aerospace systems, and control theory, jerk is often more important than velocity because it determines how predictable a system remains under changing conditions.
Earth’s rotational system now appears to be exhibiting measurable jerk-behavior driven by climate-induced mass redistribution. This means that not only is Earth slowing, but the rate at which it is slowing is itself changing.
Such behavior introduces challenges for predictive models because assumptions based upon previous rates of change become increasingly unreliable. Systems must be updated more frequently, and uncertainty grows as the underlying dynamics become increasingly nonlinear.
The emergence of measurable jerk-behavior may represent one of the clearest physical indicators that climate change is influencing fundamental planetary-scale processes.
Earth Orientation Parameters and Navigation Systems
Modern navigation depends on the precise relationship between celestial and terrestrial coordinate systems.
The International Celestial Reference Frame (ICRF) provides a stable astronomical reference framework based on distant quasars. The International Terrestrial Reference Frame (ITRF) defines geographic coordinates fixed to Earth’s surface.
Earth Orientation Parameters (EOPs) connect these systems.
Organizations such as the International Earth Rotation and Reference Systems Service (IERS) continuously monitor changes in:
Length of day
Polar motion
Axial orientation
Precession
Nutation
As climate-driven changes accelerate, EOP calculations become increasingly important. Even centimeter-scale errors in Earth’s reference frame can propagate into navigation errors measured in hundreds of meters across interplanetary distances.
The growing variability in Earth’s rotation increases the complexity of maintaining accurate coordinate transformations between space-based and Earth-based systems.
GPS, Spacecraft, and Inertial Navigation
Global Positioning System (GPS) satellites rely upon extremely precise timing and rotational models.
Unexpected changes in Earth’s orientation can create discrepancies between modeled and actual positions. These discrepancies must be corrected through continual updates to Earth orientation parameters.
The same challenge affects:
Satellite tracking
Spacecraft navigation
Astronomical observations
Geodesy
Autonomous transportation systems
Long-range communication networks
Inertial Navigation Systems (INS) face an additional challenge because they operate by integrating acceleration and rotational measurements relative to Earth itself.
As Earth’s rotational characteristics evolve, assumptions embedded within inertial guidance algorithms require more frequent recalibration. Small errors can accumulate over long distances and extended operational periods.
Sea-Level Rise Commitments and Long-Term Rotational Change
The rotational changes observed today are unlikely to stabilize quickly.
Research on the Greenland Ice Sheet has demonstrated that substantial future melting is already committed due to past greenhouse gas emissions. A study led by Jason Box and colleagues concluded that even if emissions ceased immediately, Greenland alone is committed to producing at least 27 centimeters of global sea-level rise.
Subsequent analyses suggest that realistic outcomes may substantially exceed this minimum estimate.
This committed melting implies continued redistribution of mass for decades and potentially centuries. As a result, climate-driven changes in Earth’s rotation, polar motion, and reference-frame stability are likely to continue long after greenhouse gas emissions peak.
The rotational consequences therefore represent not merely a current phenomenon but a long-term geophysical response that may unfold over generations.
Climate Feedback Loops and Nonlinear Dynamics
Understanding Earth’s changing rotation requires understanding the broader climate system in which it occurs.
Climate change is not a simple linear process. It is a dynamic system characterized by numerous interacting feedback loops, including:
Each feedback influences the others through interconnected physical, biological, and social systems.
These interactions create nonlinear responses in which relatively small disturbances can trigger disproportionately large outcomes. The accelerating changes observed in Earth’s rotation may therefore be viewed as one manifestation of a broader planetary trend toward increasing systemic instability and complexity.
Defense and Strategic Implications
Modern military and aerospace systems depend heavily on precision navigation.
Long-range missiles, autonomous drones, hypersonic vehicles, spacecraft, and surveillance platforms all rely upon accurate reference frames and rotational models.
As Earth orientation becomes more variable, maintaining precision requires increasingly sophisticated updates and corrections.
Climate-driven changes in Earth’s rotation may be contributing to navigational uncertainties that negatively affect battlefield outcomes and increase the risk of civilian casualties in contemporary conflicts. As rotational variability increases, the growing complexity of Earth orientation modeling presents an emerging strategic challenge for navigation-dependent systems, including long-range guided munitions, autonomous drones, satellite operations, and other precision-targeting technologies.
Further research is needed to quantify these effects under operational conditions.
Conclusion
Climate change is altering not only Earth’s atmosphere, oceans, and ecosystems but also the planet’s physical rotation.
Accelerated melting of glaciers and ice sheets is slowing Earth’s rotation, shifting its axis, changing its shape, and introducing increasing levels of acceleration and jerk-behavior into planetary dynamics.
Recent research suggests that climate-driven rotational changes are now occurring at rates unprecedented in millions of years. These changes are becoming increasingly relevant to GPS systems, spacecraft navigation, Earth orientation modeling, geodesy, and other technologies dependent upon extreme precision.
Viewed within the larger framework of interacting climate feedback loops and nonlinear Earth-system dynamics, the changing rotation of Earth may represent one of the most fundamental indicators that anthropogenic climate change is affecting the physical mechanics of the planet itself.
Box, J. E., Colgan, W., et al. (2022). Greenland Ice Sheet Climate Disequilibrium and Committed Sea-Level Rise. Nature Climate Change.
Dill, R., Soja, B., Chen, J., et al. (2024). The Increasingly Dominant Role of Climate Change on Length of Day. Proceedings of the National Academy of Sciences, 121(28).
ETH Zurich Geodesy and Geodynamics Group. Research on Earth Rotation, Climate Change, and Earth Orientation Parameters.
International Earth Rotation and Reference Systems Service (IERS). Earth Orientation Parameters Technical Bulletins.
NASA Jet Propulsion Laboratory (JPL). Climate-Driven Changes in Earth Rotation and Polar Motion.
Wang, J., et al. (2021). Climate-Driven Polar Motion Since the 1990s. Geophysical Research Letters.
Apparent Biodiversity Gains as Indicators of Systemic Ecological Collapse
Daniel Brouse and Sidd Mukherjee May 24, 2026
Abstract
Recent climate-driven ecological research has revealed a critical paradox: local biodiversity may temporarily increase even as global extinction risk accelerates. A major study published in Science examining the climate-induced redistribution of more than 60,000 plant species found that while some regions may experience short-term increases in local plant diversity due to species migration, overall extinction risk continues to rise substantially under all warming scenarios.
This paper examines those findings through the framework of the Nonlinear Acceleration Hypothesis, which proposes that climate destabilization compresses ecological transition timescales through interacting feedback systems, threshold failures, and cascading ecosystem reorganization.
We argue that apparent increases in local biodiversity do not represent ecosystem stability, but rather transient states of systemic strain preceding broader ecological restructuring and collapse. The observed acceleration of climate-driven range shifts supports a growing body of evidence that Earth-system transitions are occurring faster, more nonlinearly, and more synchronously than traditional linear climate assumptions predicted.
Introduction
Traditional ecological and climate models have often assumed that ecosystems would gradually adapt to warming through species migration and redistribution. Under this framework, climate-driven range shifts were frequently interpreted as evidence of ecological resilience.
However, recent empirical evidence increasingly challenges that assumption.
A landmark study published in Science titled Climate-induced range shifts support local plant diversity but don’t reduce extinction risk analyzed projected redistribution patterns for over 60,000 plant species globally. The researchers found that although local biodiversity may temporarily increase in some regions as species migrate into newly favorable climates, extinction risk still rises substantially overall.
This distinction is critically important.
The findings suggest that increasing local species richness during climate destabilization may not reflect resilience at all, but rather rapid ecosystem reorganization under accelerating environmental stress.
This phenomenon aligns closely with the Nonlinear Acceleration Hypothesis:
Under nonlinear forcing conditions, environmental systems do not respond proportionally or gradually. Instead, interconnected feedback loops amplify instability, compress transition timescales, and accelerate systemic change.
The Illusion of Biodiversity Stability
One of the study’s most important conclusions is that local biodiversity gains can coexist with increasing global ecological instability.
At first glance, rising species richness appears beneficial. New species entering warming regions may create the appearance of ecological adaptation or recovery.
However, ecosystems are not merely collections of independent species. They are highly interconnected functional systems built through long evolutionary co-adaptation.
Rapid species migration disrupts these relationships simultaneously:
pollinator synchronization weakens,
soil microbial interactions destabilize,
predator-prey dynamics reorganize,
nutrient cycling shifts,
and hydrological balances change.
In nonlinear systems physics, this represents a transient destabilization phase rather than stable adaptation.
The appearance of increasing complexity may therefore mask accelerating systemic fragility beneath the surface.
This mirrors patterns observed in other nonlinear collapse systems, including financial bubbles, infrastructure failures, and ecological tipping points, where apparent surface activity temporarily expands even as structural resilience deteriorates.
Climate Velocity and Compressed Ecological Timescales
The study fundamentally reflects the growing problem of climate velocity — the rate at which climatic zones are shifting geographically across Earth’s surface.
Under stable climatic conditions, species redistribution typically unfolds over centuries or millennia. Evolutionary adaptation, ecosystem restructuring, and species migration historically occurred on relatively slow geological timescales.
Today, those transitions are unfolding within decades.
This compression of ecological adjustment intervals represents one of the clearest signatures of nonlinear climate acceleration.
The central issue is not simply whether species can move geographically. The deeper issue is whether biological adaptation, ecosystem synchronization, and ecological restructuring can occur rapidly enough to maintain systemic stability.
Increasingly, evidence suggests they cannot.
Once forcing rates exceed adaptive capacity, ecological systems begin transitioning toward threshold-driven instability.
Ecosystem Reorganization as a Feedback System
The study also reinforces a broader principle emerging throughout climate science: ecosystem destabilization itself amplifies climate destabilization.
As ecological systems weaken:
carbon sinks deteriorate,
drought resilience declines,
wildfire susceptibility rises,
soil carbon storage weakens,
ozone damage intensifies,
and atmospheric instability increases.
These feedbacks are not isolated.
They interact simultaneously and reinforce one another.
and additional atmospheric carbon accelerates warming further.
This represents a classic positive-feedback cascade.
The climate system is therefore transitioning from a state dominated primarily by direct anthropogenic emissions toward one increasingly influenced by self-reinforcing Earth-system feedbacks.
Why Range Shifts Do Not Eliminate Extinction Risk
Perhaps the most important conclusion of the study is that species migration alone does not prevent extinction risk.
Even where migration occurs successfully, newly assembled ecosystems may remain highly unstable due to disrupted functional relationships.
In effect, species movement does not guarantee ecosystem persistence.
The core problem is not simply warming itself, but the accelerating rate of environmental change.
Under nonlinear forcing, systems frequently fail not because adaptation is impossible in theory, but because adaptation cannot occur rapidly enough to keep pace with accelerating disruption.
The Nonlinear Acceleration Hypothesis
The observed dynamics strongly support the Nonlinear Acceleration Hypothesis, which proposes that climate destabilization operates through interacting reinforcing feedback systems that compress ecological and climatic transition timescales.
and accelerating warming further intensifies ecological stress.
The resulting system behaves nonlinearly:
Small increases in forcing can therefore trigger disproportionately large ecosystem responses once thresholds are crossed.
Importantly, nonlinear systems rarely collapse uniformly or gradually.
They often exhibit periods of apparent stability immediately before rapid reorganization occurs.
The temporary increase in local biodiversity documented in the study may therefore represent not resilience, but a precursor to accelerating ecological transition.
Conclusion
The Science study on climate-driven plant range shifts provides important empirical support for the growing recognition that climate destabilization is unfolding through nonlinear ecosystem reorganization rather than gradual equilibrium adjustment.
The findings demonstrate that:
local biodiversity gains can mask systemic fragility,
ecosystem transitions are accelerating geographically,
extinction risk remains high despite species migration,
and climate-driven ecological restructuring is already underway globally.
Most importantly, the research reinforces a central insight of nonlinear systems theory:
Apparent adaptation can coexist with accelerating systemic failure.
The climate crisis is therefore not simply a problem of rising temperatures alone. It is an increasingly interconnected process of ecological destabilization, biosphere reorganization, weakening resilience, and reinforcing feedback amplification occurring simultaneously across Earth systems.
The critical scientific challenge is no longer merely forecasting direct human emissions.
It is understanding how rapidly Earth’s own ecological and climatic feedback systems may accelerate destabilization once critical thresholds are crossed.
References
Science. Climate-induced range shifts support local plant diversity but don’t reduce extinction risk. DOI: 10.1126/science.aea1676