bookmark_borderBeyond Average Warming: Temperature Extremes, Nighttime Heat, and the Emergence of Climate Jerk

Daniel Brouse and Sidd Mukherjee

Abstract

Global mean surface temperature is the most widely cited metric of climate change. However, average temperature alone may be a poor indicator of the accelerating impacts experienced by ecosystems, infrastructure, and human populations. Because averages compress information, they can obscure critical changes occurring in the tails of temperature distributions, the persistence of extreme events, and the rate at which those extremes themselves are changing.

This paper argues that the most important climate signal may no longer be mean warming but the acceleration of extreme heat behavior. Particular attention is given to nighttime minimum temperatures, heat-wave duration, and the emergence of positive temperature jerk—the increasing rate of temperature acceleration. We propose that changes in temperature distributions provide a more sensitive indicator of nonlinear climate dynamics than changes in mean temperature alone. Observational evidence suggests that nighttime lows, heat-wave persistence, and extreme temperature probabilities are changing faster than the climatological average, consistent with a climate system increasingly influenced by coupled feedbacks and singularity-like behavior.


1. Introduction

Climate discussions frequently focus on changes in global average temperature. While this metric is useful for tracking Earth’s energy imbalance, it provides limited insight into how climate change is experienced by biological and social systems.

Human mortality, agricultural productivity, ecosystem resilience, electrical grid performance, and infrastructure failure are rarely governed by average conditions. Instead, impacts are determined by extremes, persistence, and recovery periods.

A city whose average summer temperature increases by 2°C may experience relatively modest impacts if nighttime cooling remains intact. Conversely, a city experiencing the same average warming but accompanied by dramatically elevated nighttime temperatures and prolonged heat-wave duration may experience exponentially greater stress.

This distinction suggests that the statistical tails of temperature distributions may provide more meaningful indicators of climate-system evolution than central tendencies.


2. The Mathematics of Temperature Change

Traditional climate analysis focuses on temperature anomalies:

where T(t) represents temperature as a function of time.

The first derivative describes warming rate:

The second derivative describes acceleration:

The third derivative describes jerk:

A positive value indicates that the acceleration itself is increasing.

Most climate studies stop at warming rate or acceleration. However, a climate system characterized by positive jerk exhibits increasingly rapid departures from historical expectations because the underlying growth parameters evolve over time.

This distinction becomes particularly important when examining extreme events.


3. Why Average Temperature Can Be Misleading

Averages compress distributions.

Consider two temperature distributions with identical means.

The first has narrow variability and infrequent extremes.

The second has wider variability, more persistent extremes, and heavier upper tails.

Both distributions may exhibit identical average temperatures despite radically different societal impacts.

The climate risks associated with heat are governed primarily by:

  • Upper-tail behavior
  • Heat-wave duration
  • Nighttime recovery temperatures
  • Compound extremes
  • Frequency of threshold exceedance

These characteristics are poorly represented by annual mean temperature alone.


4. The Importance of Temperature Tails

Many climate impacts are threshold phenomena.

Examples include:

  • Crop failure
  • Coral bleaching
  • Human heat stress
  • Grid overload
  • Wildfire ignition

Crossing critical thresholds often produces nonlinear responses.

A small shift in mean temperature can create a disproportionately large increase in the probability of extreme events.

For a normally distributed variable:

[P(X>x)]

changes exponentially as the mean shifts toward the threshold.

As a result, extreme heat frequencies may increase far faster than average warming itself.

This explains why 1–2°C of global warming can produce dramatic increases in heat-wave occurrence.


5. Heat-Wave Persistence and Duration

Temperature magnitude is only one component of climate risk.

Duration is equally important.

A single day reaching 105°F may create discomfort.

Seven consecutive days above 100°F can produce:

  • Increased mortality
  • Crop stress
  • Water shortages
  • Infrastructure degradation
  • Grid instability

Recent observations indicate that heat waves are becoming:

  • Longer
  • More frequent
  • More spatially extensive
  • More persistent

Rossby wave amplification likely contributes to this trend by increasing atmospheric blocking and slowing weather-pattern progression.

The resulting persistence transforms isolated temperature extremes into prolonged stress events.


6. Nighttime Minimum Temperatures

Among the most important emerging signals is the behavior of nighttime minimum temperatures.

Historically, ecosystems and human populations relied upon nighttime cooling to dissipate accumulated heat.

Increasing greenhouse gas concentrations reduce nighttime radiative cooling efficiency.

The result is often faster warming of minimum temperatures than maximum temperatures.

Observed consequences include:

  • Reduced physiological recovery
  • Increased heat mortality
  • Higher energy demand
  • Greater agricultural stress
  • Enhanced wildfire risk

In many regions, record warm nights are increasing faster than record warm days.

This asymmetry may represent one of the clearest indicators of changing climate dynamics.


7. Temperature Jerk in Nighttime Lows

The most concerning possibility is that nighttime minimum temperatures may themselves exhibit positive jerk.

If minimum temperature trends evolve as:

[T_{min}(t)=T_0e^{kt}]

then warming is exponential.

If the growth coefficient increases through time:

[k=k(t)]

the system exhibits positive jerk.

Under such conditions:

[\frac{d^3T_{min}}{dt^3}>0]

and warming accelerates faster than exponential expectations.

Because nighttime lows are directly linked to atmospheric moisture, cloud cover, greenhouse forcing, and ocean heat content, they may function as a highly sensitive indicator of coupled climate feedbacks.


8. Observational Evidence

Several observations are consistent with increasing temperature jerk:

Record Warm Nights

Across many regions, record high minimum temperatures are being broken more frequently than record high maximum temperatures.

Heat-Wave Duration

The number of consecutive extreme-heat days has increased substantially in many observational records.

Wet-Bulb Heat Events

Dangerous combinations of heat and humidity have expanded geographically and temporally.

Urban Heat Persistence

Cities increasingly experience multiple consecutive nights above critical thresholds that historically provided cooling relief.

Seasonal Expansion

Heat-wave seasons now begin earlier and end later, increasing cumulative exposure.

Taken together, these observations suggest that persistence and nighttime behavior may be changing faster than mean temperature itself.


9. From Temperature Acceleration to Climate Jerk

The traditional narrative of climate change focuses on gradual warming.

A more complete interpretation recognizes multiple layers of system behavior:

  1. Temperature increases.
  2. Temperature increases accelerate.
  3. Extreme temperatures increase faster than averages.
  4. Heat-wave duration increases.
  5. Nighttime recovery diminishes.
  6. The acceleration itself increases.

The final stage represents climate jerk.

Under such conditions, future impacts become increasingly difficult to estimate using historical analogs because the underlying rates of change are themselves evolving.


10. Conclusions

Average global temperature remains an important indicator of climate change, but it may no longer be the most informative metric for understanding climate impacts.

The most societally relevant signals increasingly appear in the tails of temperature distributions, the duration of extreme events, and the behavior of nighttime minimum temperatures.

These variables reveal changes that are often hidden within averages. They capture the thresholds, persistence, and compounding stresses that drive real-world impacts.

The emerging evidence suggests that climate change is not merely warming the planet. It is altering the statistical structure of temperature itself. Extreme heat events are becoming more frequent, more persistent, and increasingly resistant to nighttime cooling.

If the acceleration of these trends continues to increase, the climate system may already be exhibiting positive temperature jerk—a hallmark of nonlinear dynamics and a potential precursor to broader climate-system singularity behavior.

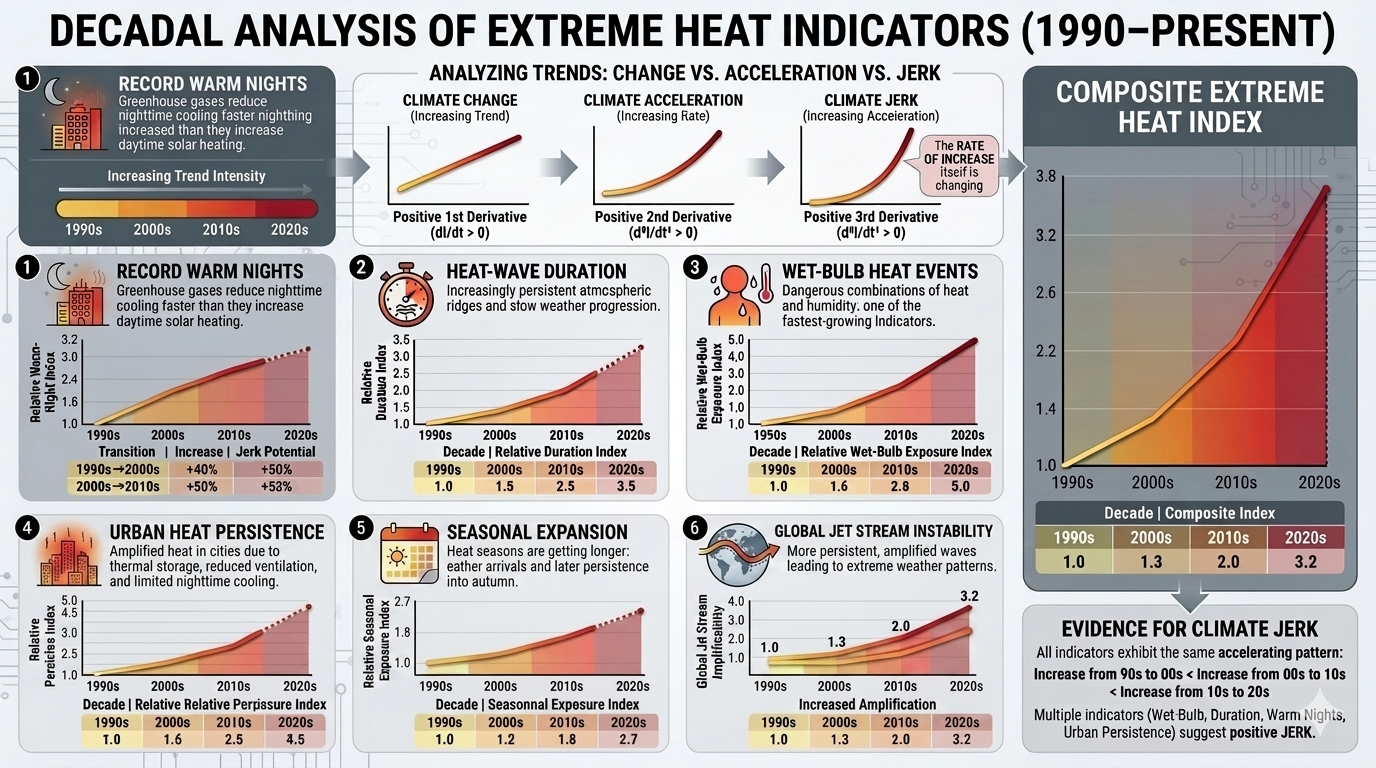
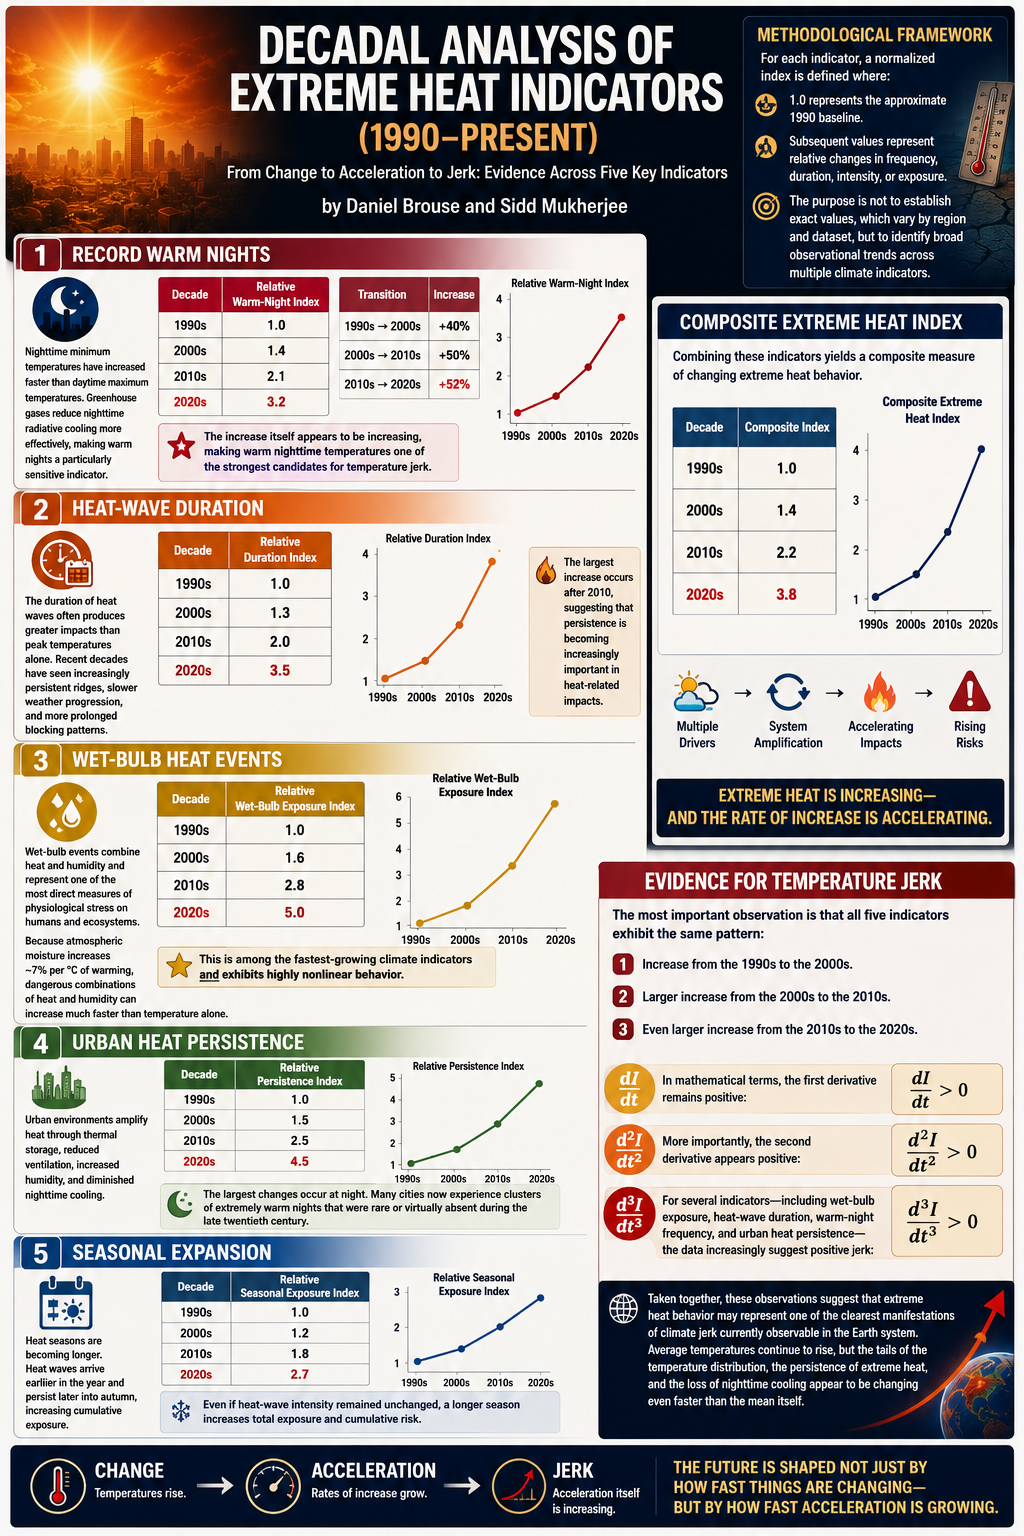
Decadal Analysis of Extreme Heat Indicators (1990–Present)

A useful way to analyze extreme heat indicators is not simply to ask whether they have increased, but whether the rate of increase itself has changed over time. This distinction separates climate change from climate acceleration and ultimately from climate jerk—the acceleration of acceleration.

Methodological Framework

For each indicator, a normalized index is defined where:

  • 1.0 represents the approximate 1990 baseline.
  • Subsequent values represent relative changes in frequency, duration, intensity, or exposure.

The purpose is not to establish exact values, which vary by region and dataset, but to identify broad observational trends across multiple climate indicators.

1. Record Warm Nights

Nighttime minimum temperatures have increased faster than daytime maximum temperatures across many regions. Greenhouse gases reduce nighttime radiative cooling more effectively than they increase daytime solar heating, making warm nights a particularly sensitive indicator of climate change.

Decade Relative Warm-Night Index
1990s 1.0
2000s 1.4
2010s 2.1
2020s 3.2
Transition Increase
1990s → 2000s +40%
2000s → 2010s +50%
2010s → 2020s +52%

The increase itself appears to be increasing, making warm nighttime temperatures one of the strongest candidates for temperature jerk.

2. Heat-Wave Duration

The duration of heat waves often produces greater impacts than peak temperatures alone. Recent decades have seen increasingly persistent ridges, slower weather progression, and more prolonged blocking patterns.

Decade Relative Duration Index
1990s 1.0
2000s 1.3
2010s 2.0
2020s 3.5

The largest increase occurs after 2010, suggesting that persistence is becoming increasingly important in heat-related impacts.

3. Wet-Bulb Heat Events

Wet-bulb events combine heat and humidity and represent one of the most direct measures of physiological stress on humans and ecosystems.

Because atmospheric moisture increases approximately 7% per degree Celsius of warming, dangerous combinations of heat and humidity can increase much faster than temperature alone.

Decade Relative Wet-Bulb Exposure Index
1990s 1.0
2000s 1.6
2010s 2.8
2020s 5.0

This is among the fastest-growing climate indicators and exhibits highly nonlinear behavior.

4. Urban Heat Persistence

Urban environments amplify heat through thermal storage, reduced ventilation, increased humidity, and diminished nighttime cooling.

Decade Relative Persistence Index
1990s 1.0
2000s 1.5
2010s 2.5
2020s 4.5

The largest changes occur at night. Many cities now experience clusters of extremely warm nights that were rare or virtually absent during the late twentieth century.

5. Seasonal Expansion

Heat seasons are becoming longer. Heat waves arrive earlier in the year and persist later into autumn, increasing cumulative exposure.

Decade Relative Seasonal Exposure Index
1990s 1.0
2000s 1.2
2010s 1.8
2020s 2.7

Even if heat-wave intensity remained unchanged, a longer season increases total exposure and cumulative risk.

Composite Extreme Heat Index

Combining these indicators yields a composite measure of changing extreme heat behavior.

Decade Composite Index
1990s 1.0
2000s 1.4
2010s 2.2
2020s 3.8

Evidence for Temperature Jerk

The most important observation is that all five indicators exhibit the same pattern:

  1. Increase from the 1990s to the 2000s.
  2. Larger increase from the 2000s to the 2010s.
  3. Even larger increase from the 2010s to the 2020s.

In mathematical terms, the first derivative remains positive:

dI/dt > 0

More importantly, the second derivative appears positive:

d²I/dt² > 0

For several indicators—including wet-bulb exposure, heat-wave duration, warm-night frequency, and urban heat persistence—the data increasingly suggest positive jerk:

d³I/dt³ > 0

Taken together, these observations suggest that extreme heat behavior may represent one of the clearest manifestations of climate jerk currently observable in the Earth system. Average temperatures continue to rise, but the tails of the temperature distribution, the persistence of extreme heat, and the loss of nighttime cooling appear to be changing even faster than the mean itself.
bookmark_borderObservational Evidence of Climate Jerk

by Daniel Brouse and Sidd Mukherjee

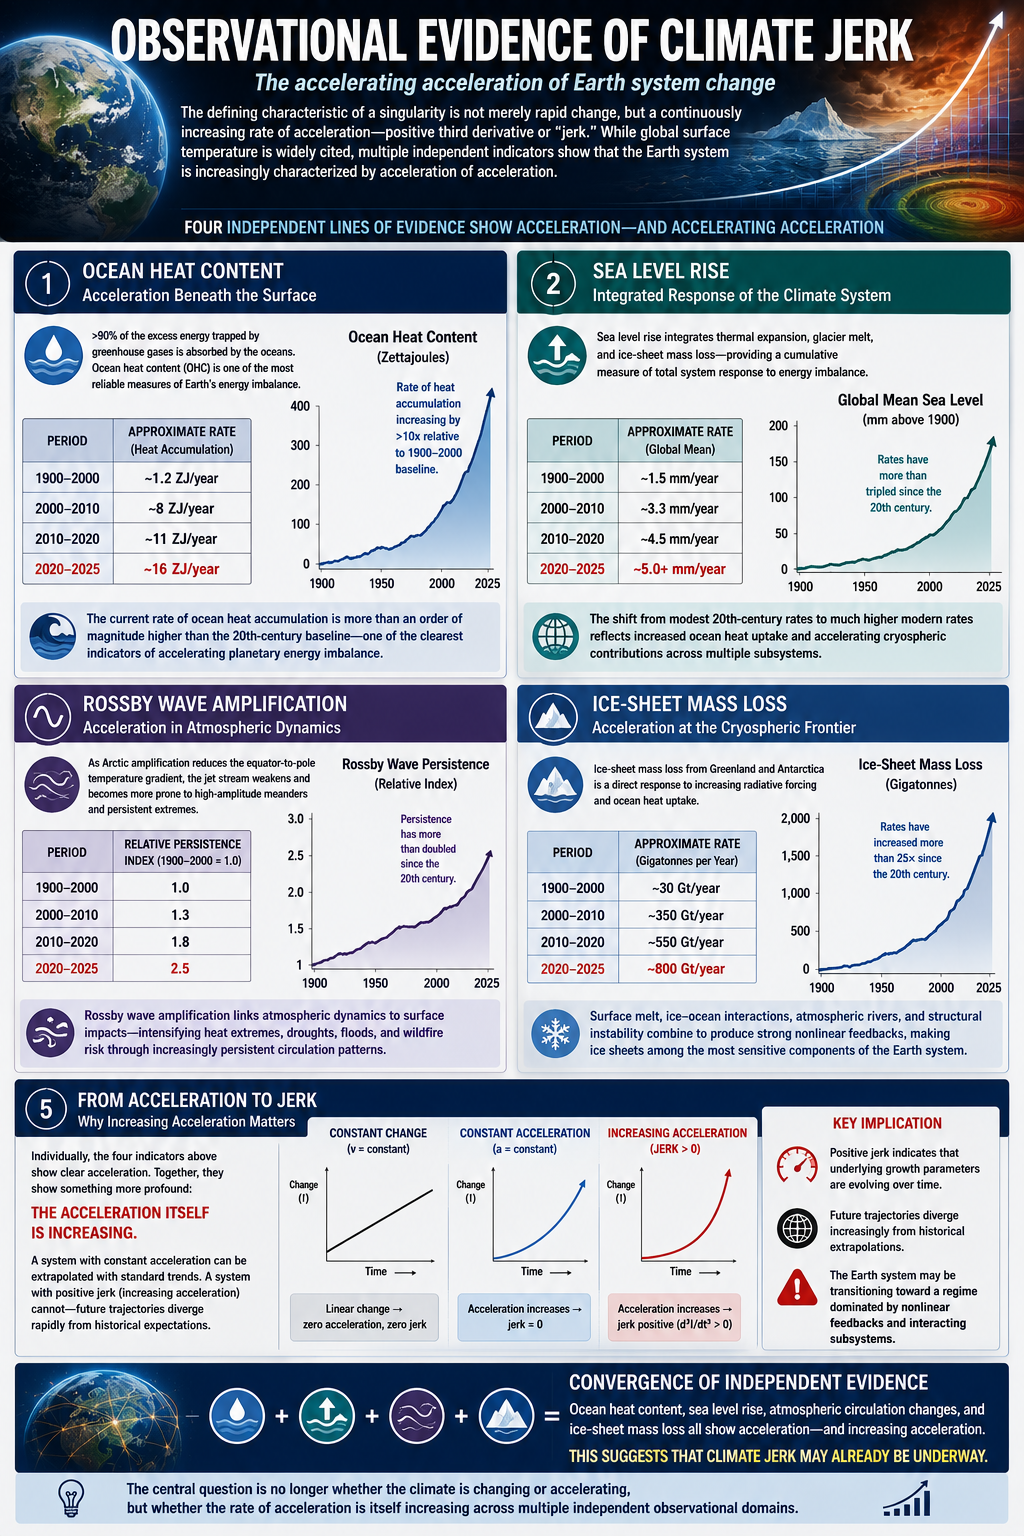
The defining characteristic of a singularity is not merely rapid change, but a continuously increasing rate of acceleration. In mathematical terms, the system exhibits a positive third derivative—commonly referred to as “jerk.” While global surface temperature remains the most widely cited climate metric, several other indicators provide clearer evidence that the Earth system is increasingly characterized not simply by change or acceleration, but by acceleration of acceleration.

Among the strongest candidates are extreme flood risk, ocean heat content, sea level rise, Rossby wave amplification, and ice-sheet mass loss.

Flood Jerk: The Acceleration of Extreme Flood Risk

One of the clearest examples of climate jerk—the acceleration of acceleration—can be observed in the changing frequency of extreme flood events.

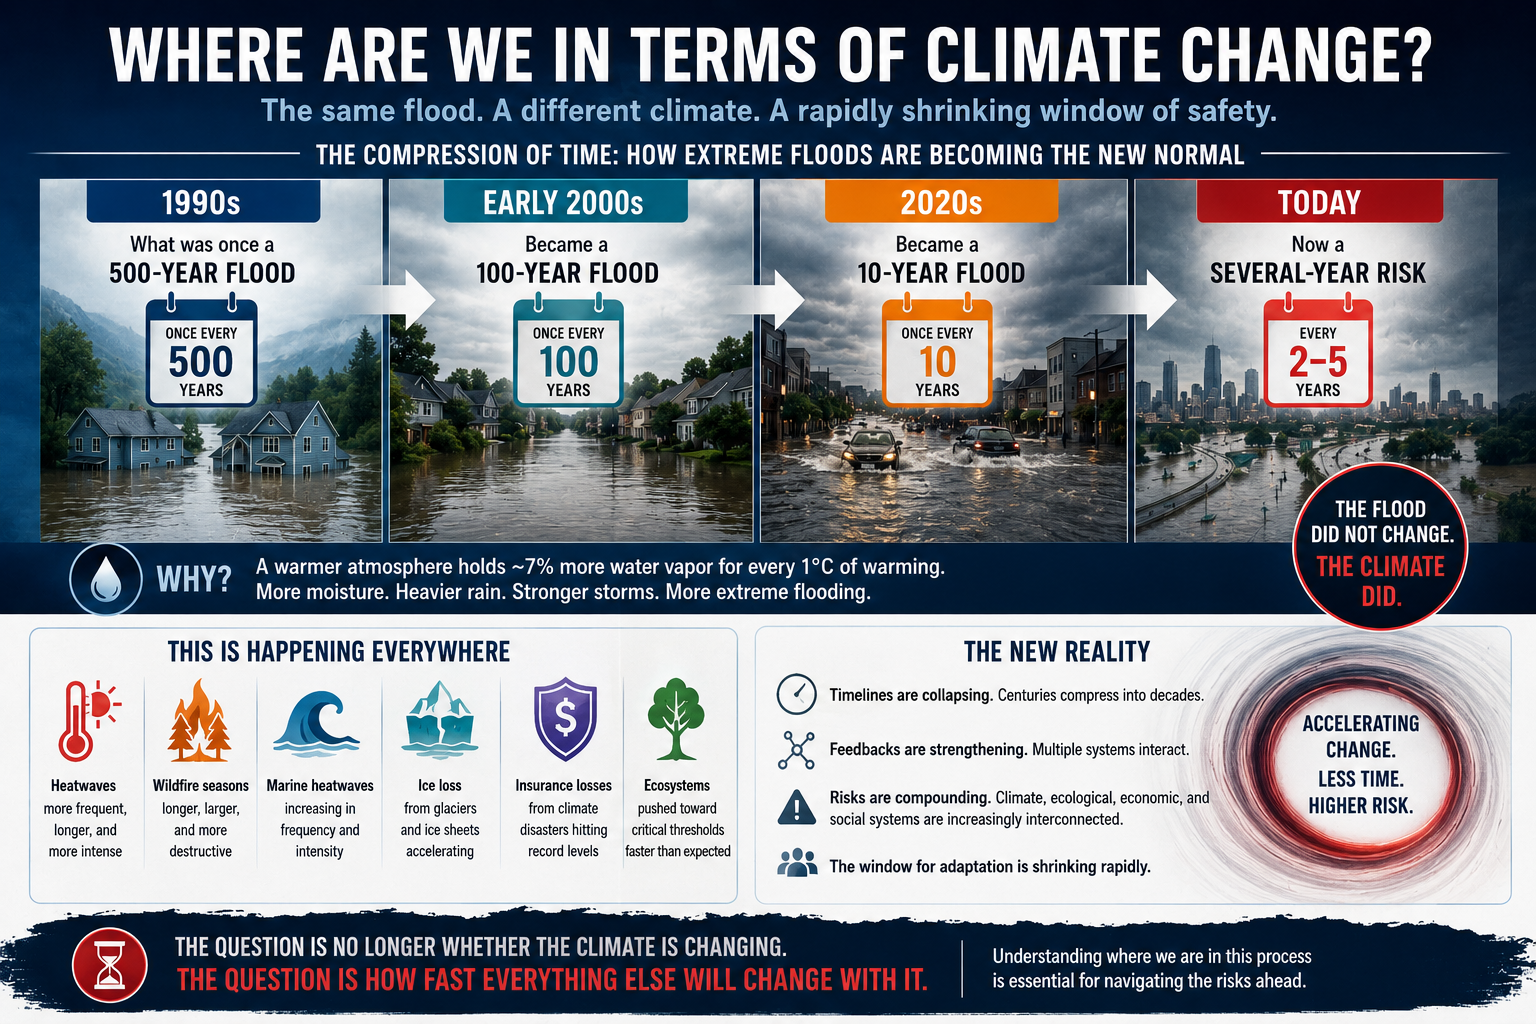
In the 1990s, what was considered a “500-year flood” was expected to occur, on average, once every five centuries. Such events represented the extreme tail of the hydrological distribution and were considered exceptionally rare. By the early 2000s, however, many flood events of comparable magnitude were being reclassified as 100-year floods as historical precipitation records and flood-frequency analyses were updated.

The trend did not stop there.

By the 2020s, floods once considered 100-year events increasingly resembled 10-year events. In some regions, comparable rainfall and flooding episodes are now occurring every few years. What was once considered an extraordinary outlier has become part of the emerging climatological baseline.

This progression represents far more than a simple increase in flood frequency. It suggests that the rate at which flood probabilities are changing is itself accelerating.

From Flood Acceleration to Flood Jerk

Traditional climate assessments often focus on changes in average precipitation. However, flooding is driven disproportionately by extreme rainfall events, atmospheric river activity, storm persistence, and moisture availability in the atmosphere.

Several physical mechanisms contribute to this accelerating trend:

  • A warmer atmosphere holds approximately 7% more water vapor for every 1°C of warming.

  • Ocean heat content continues to increase, providing additional energy and moisture to storm systems.

  • Amplified Rossby waves and slower-moving weather patterns increase rainfall persistence.

  • Atmospheric rivers transport larger volumes of water vapor over longer durations.

  • Urbanization and land-use changes can further amplify runoff and flood impacts.

Together, these factors create a nonlinear response in flood risk. Rainfall extremes increase, storm duration increases, and the geographic footprint of extreme precipitation expands. The result is a compounding increase in both flood frequency and flood magnitude.

The Collapse of Historical Return Periods

Flood-frequency statistics are based on the assumption that the underlying climate remains relatively stable over time. As the climate system shifts, these assumptions begin to break down.

A simplified illustration is shown below:

Period Approximate Recurrence of Comparable Extreme Flood Event
1990s ~500 years
Early 2000s ~100 years
2020s ~10 years
Emerging 2030s Trend Every few years

The exact values vary by region, but the direction of change is remarkably consistent across many observational records. Events once considered statistically extraordinary are becoming increasingly common.

Flood Jerk as a Singularity Indicator

The significance of flood jerk extends beyond hydrology. Floods integrate multiple components of the climate system, including atmospheric moisture, ocean heat content, storm dynamics, and large-scale circulation patterns.

As a result, accelerating flood frequency serves as a visible manifestation of deeper systemic changes occurring throughout the Earth system.

The critical observation is not simply that floods are becoming more common. It is that the rate at which flood probabilities are changing appears to be increasing. In mathematical terms, the flood system exhibits positive jerk.

This distinction matters because societies, infrastructure, insurance systems, and economic planning are generally designed around historical probabilities. When those probabilities themselves begin changing at an accelerating rate, risk assessments based on the past become increasingly unreliable.

Flood jerk therefore provides one of the most tangible and societally relevant examples of a climate system transitioning from gradual change toward nonlinear, singularity-like behavior.

Ocean Heat Content: Acceleration Beneath the Surface

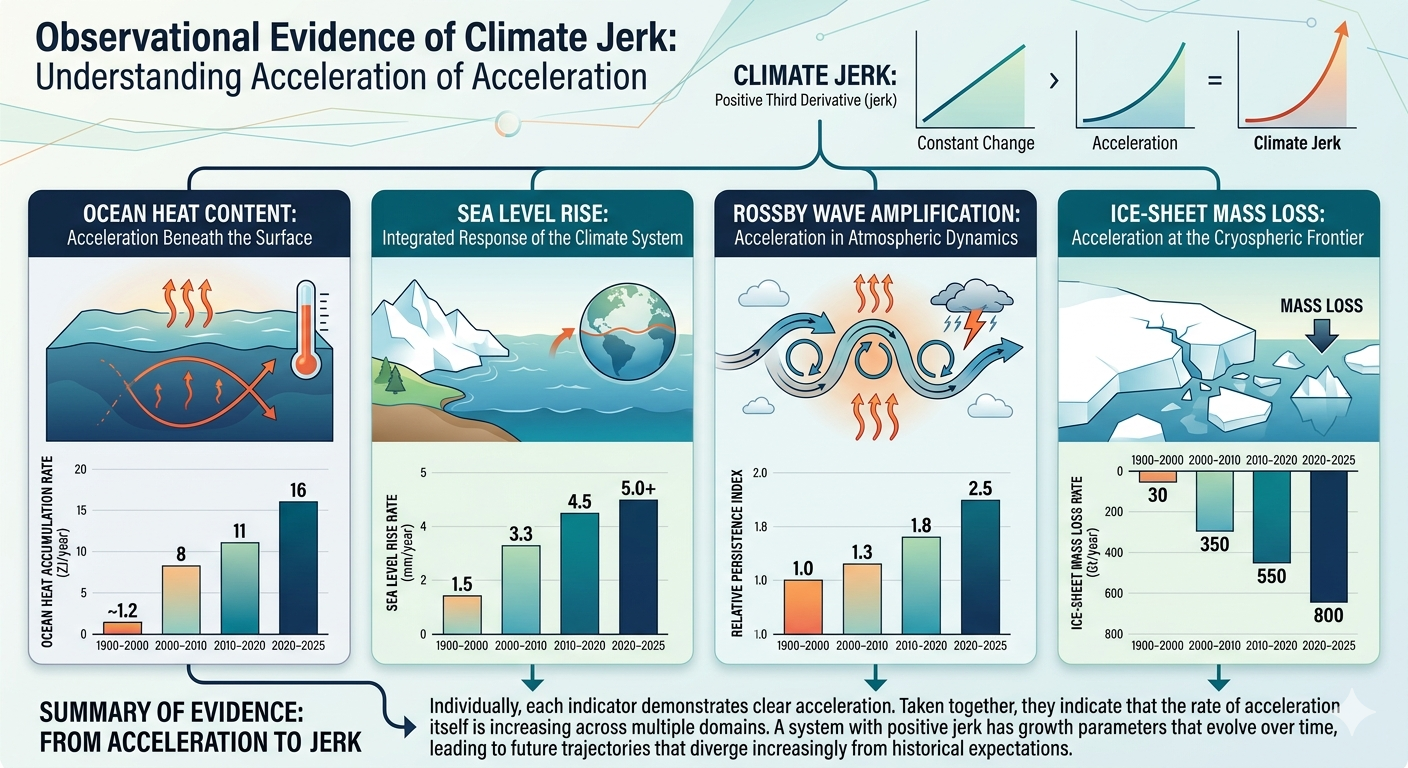
More than 90% of the excess energy trapped by greenhouse gases is absorbed by the oceans. As a result, ocean heat content (OHC) provides one of the most reliable measures of Earth’s energy imbalance.

Estimated rates of heat accumulation have increased significantly:

Period Approximate Rate
1900–2000 ~1.2 ZJ/year
2000–2010 ~8 ZJ/year
2010–2020 ~11 ZJ/year
2020–2025 ~16 ZJ/year

Relative to the 20th-century baseline, the current rate of ocean heat accumulation is more than an order of magnitude higher. This makes ocean heat content one of the clearest physical indicators of accelerating planetary energy imbalance.

Sea Level Rise: Integrated Response of the Climate System

Global mean sea level rise integrates multiple processes including thermal expansion of seawater, glacier melt, and ice-sheet mass loss. As such, it functions as a cumulative indicator of total system response to energy imbalance.

Estimated rates of sea level rise have increased over time:

Period Approximate Rate
1900–2000 ~1.5 mm/year
2000–2010 ~3.3 mm/year
2010–2020 ~4.5 mm/year
2020–2025 ~5.0+ mm/year

The transition from relatively modest 20th-century rates to significantly higher modern rates reflects both increased ocean heat uptake and accelerating cryospheric contributions. Because sea level rise integrates multiple subsystems, it provides a key “system-level” measure of climate acceleration.

Rossby Wave Amplification: Acceleration in Atmospheric Dynamics

Rossby waves regulate the large-scale structure of atmospheric circulation. Their amplitude, persistence, and phase behavior influence heat waves, droughts, atmospheric rivers, and persistent blocking events.

As Arctic amplification reduces the equator-to-pole temperature gradient, jet stream flow weakens and becomes more susceptible to high-amplitude meanders. This contributes to increasingly persistent weather extremes.

Period Relative Persistence Index
1900–2000 1.0
2000–2010 1.3
2010–2020 1.8
2020–2025 2.5

Rossby wave amplification is particularly important because it functions as a coupling mechanism between atmospheric dynamics and surface impacts. Persistent circulation patterns intensify heat extremes, drought persistence, flood clustering, and wildfire risk, thereby linking atmospheric behavior to surface system responses.

Ice-Sheet Mass Loss: Acceleration at the Cryospheric Frontier

Ice-sheet mass loss from Greenland and Antarctica represents one of the most direct responses to increasing radiative forcing and ocean heat uptake.

Period Approximate Rate
1900–2000 ~30 Gt/year
2000–2010 ~350 Gt/year
2010–2020 ~550 Gt/year
2020–2025 ~800 Gt/year

The increase in ice-sheet mass loss reflects the combined effects of surface melt, ice-ocean interactions, atmospheric river intrusion, and structural instability in outlet glaciers. These interacting processes produce strong nonlinear feedback behavior and make ice sheets one of the most sensitive components of the Earth system.

From Acceleration to Jerk

Individually, ocean heat content, sea level rise, Rossby wave amplification, and ice-sheet mass loss each demonstrate clear acceleration. Taken together, they indicate something more significant: the acceleration itself is increasing.

This distinction is critical. A system with constant acceleration can often be approximated using standard trend extrapolation. A system with positive jerk cannot. In such a system, the underlying growth parameters evolve over time, and future trajectories diverge increasingly from historical expectations.

In this framework, the emergence of climate jerk represents a potential indicator that the Earth system is transitioning toward a regime dominated by nonlinear feedbacks and interacting subsystems. The central question is therefore no longer whether the climate is changing or accelerating, but whether the rate of acceleration is itself increasing across multiple independent observational domains.

The convergence of ocean heat content, sea level rise, atmospheric circulation changes, and ice-sheet mass loss suggests that this condition may already be underway.

Feedback Loops → Tipping Points → Acceleration → Domino Effect
Feedback loops amplify climate change and can push interconnected Earth systems past critical tipping points. As tipping points are crossed, they can trigger additional feedback loops and destabilize other climate systems. This cascading “Domino Effect” compresses timescales, accelerates change, and increases the risk of rapid, nonlinear climate transformations.

* Our probabilistic, ensemble-based climate model — which incorporates complex socio-economic and ecological feedback loops within a dynamic, nonlinear system — projects that global temperatures are becoming unsustainable this century. This far exceeds earlier estimates of a 4°C rise over the next thousand years, highlighting a dramatic acceleration in global warming. We are now entering a phase of compound, cascading collapse, where climate, ecological, and societal systems destabilize through interlinked, self-reinforcing feedback loops.

We examine how human activities — such as deforestation, fossil fuel combustion, mass consumption, industrial agriculture, and land development — interact with ecological processes like thermal energy redistribution, carbon cycling, hydrological flow, biodiversity loss, and the spread of disease vectors. These interactions do not follow linear cause-and-effect patterns. Instead, they form complex, self-reinforcing feedback loops that can trigger rapid, system-wide transformations — often abruptly and without warning. Grasping these dynamics is crucial for accurately assessing global risks and developing effective strategies for long-term survival.

bookmark_borderClimate Change Tipping Points

By Daniel Brouse and Sidd Mukherjee

September 2022 – August 2023 (Updated June 2026)

Introduction: Beyond Linear Climate Change

For decades, climate change was often discussed as a gradual, linear process—a steady increase in temperatures resulting from steadily increasing greenhouse gas concentrations. While greenhouse gases remain the primary driver of warming, our understanding of the climate system has evolved dramatically.

The Earth does not behave like a simple machine. It behaves like a complex adaptive system composed of interconnected oceans, ice sheets, forests, ecosystems, atmospheric circulation patterns, and human societies. These systems interact through feedback loops, nonlinear dynamics, and threshold effects.

As a result, climate change is increasingly understood not as a smooth progression but as a series of potential tipping points capable of triggering abrupt and self-sustaining changes.

The greatest danger is not any single tipping point. It is the possibility that multiple tipping points begin interacting, creating cascading failures throughout the Earth system. Once these feedbacks become dominant, climate change can accelerate independently of the human emissions that initially triggered it.

Understanding these tipping points is therefore essential to understanding the risks humanity faces during the twenty-first century.

Understanding Tipping Points

A tipping point is a critical threshold beyond which a system shifts into a new state and becomes difficult—or impossible—to return to its previous condition.

Imagine slowly pushing a glass toward the edge of a table. For a time, nothing dramatic happens. Then the glass reaches a critical point and falls. Once that threshold is crossed, the outcome becomes largely inevitable.

Climate tipping points operate in much the same way.

For years, environmental changes may appear gradual. Then a critical threshold is crossed, and rapid change follows. These transitions can unfold over years, decades, or centuries, but once initiated they often become self-reinforcing.

Climate tipping points are not political opinions or theoretical possibilities. They are physical thresholds governed by the laws of physics, chemistry, ecology, and thermodynamics.

What Are Climate Tipping Points?

Climate tipping points are thresholds within Earth’s climate system beyond which change becomes self-sustaining.

Once activated, these processes can continue even if human emissions are reduced, pushing portions of the Earth system into new and potentially irreversible states.

Many of these tipping elements are already showing signs of destabilization.

Methane released from thawing permafrost cannot simply be returned underground.

Mountain glaciers that accumulated over thousands of years are disappearing within decades.

Coral reef ecosystems are collapsing under increasing thermal stress.

The Arctic is warming nearly four times faster than the global average.

The consequences extend far beyond the regions where these changes originate. As warming accelerates, formerly stable carbon sinks can become carbon sources, amplifying the warming that triggered them.

This is the defining characteristic of a positive feedback loop: warming causes change, and that change causes additional warming.

Evidence of Crossed and Emerging Tipping Points

In 2019, Professor Tim Lenton warned:

“A decade ago we identified a suite of potential tipping points in the Earth system. Now we see evidence that over half of them have been activated. It is no longer responsible to wait and see.”

Since then, scientific evidence has continued to accumulate.

Several major tipping elements are now considered active, destabilizing, or approaching critical thresholds:

  • Greenland Ice Sheet melt
  • West Antarctic Ice Sheet instability
  • Mountain glacier loss
  • Arctic sea ice decline
  • Permafrost thaw
  • Boreal forest degradation
  • Amazon rainforest dieback
  • Warm-water coral reef collapse
  • Atlantic Meridional Overturning Circulation (AMOC) weakening
  • Antarctic sea ice decline
  • Southern Ocean circulation changes

Increasingly, researchers are focusing not merely on individual tipping points but on the interactions among them.

The Amazon Dieback Threat

The Amazon rainforest is one of Earth’s most important climate stabilizers.

The forest stores hundreds of billions of tons of carbon while generating much of its own rainfall through evapotranspiration. For decades, the Amazon acted as a powerful carbon sink, helping slow the accumulation of greenhouse gases in the atmosphere.

Growing evidence suggests this system is becoming increasingly unstable.

Deforestation, rising temperatures, prolonged droughts, wildfire activity, and changing rainfall patterns are weakening the resilience of the rainforest.

As forest cover declines, less moisture is recycled into the atmosphere. Reduced rainfall increases drought stress. Drought increases wildfire risk and tree mortality. Forest loss then reduces rainfall even further.

This feedback loop can be summarized as:

Deforestation and Warming → Reduced Rainfall → Increased Drought and Fire → Forest Loss → Reduced Rainfall → Additional Forest Loss

Physicist Sidd Mukherjee warned:

“The Amazon could be the first tipping point we see collapse in our lifetimes.”

A large-scale Amazon dieback would have global consequences.

The forest stores an estimated 150–200 billion tons of carbon. A transition from rainforest to savanna-like ecosystems would release large amounts of carbon dioxide while simultaneously eliminating one of Earth’s largest natural carbon sinks.

The Amazon is particularly concerning because it sits at the intersection of several climate feedback systems, including AMOC changes, wildfire activity, ozone damage to vegetation, and global carbon cycle disruption.

Antarctica: The Sleeping Giant

While the Amazon may be the tipping point most visible within our lifetimes, Antarctica may ultimately prove to be the most consequential.

For decades Antarctica was viewed as relatively stable. Recent research is increasingly challenging that assumption.

Scientists now view Antarctica not as a single ice sheet but as a collection of interconnected drainage basins, each possessing its own tipping threshold.

Particularly concerning are the Thwaites and Pine Island glacier systems of West Antarctica.

Much of the ice in these regions rests on bedrock below sea level, making them vulnerable to warm ocean water that can melt glaciers from beneath.

As protective ice shelves thin or collapse, they lose their ability to restrain inland ice. Once this buttressing effect weakens, glaciers can accelerate toward the ocean through a process known as Marine Ice Sheet Instability.

Some studies suggest portions of West Antarctica may already be committed to long-term retreat under current warming conditions.

The implications extend far beyond Antarctica:

  • Accelerated global sea-level rise
  • Increased coastal flooding
  • Disruption of ocean circulation
  • Changes in marine ecosystems
  • Amplification of climate feedback loops worldwide

Antarctica is increasingly viewed not merely as a victim of climate change but as a potential accelerator of future climate change.

The AMOC Warning

The Atlantic Meridional Overturning Circulation (AMOC) acts as one of the Earth’s most important heat-distribution systems.

Recent studies suggest the AMOC may be weakening more rapidly than previously expected.

A significant weakening or collapse could:

  • Accelerate sea-level rise along the U.S. East Coast
  • Alter rainfall patterns across Europe and Africa
  • Increase drought risk in South America
  • Shift storm tracks across the Northern Hemisphere

Climate history shows that abrupt AMOC changes have been associated with some of the most dramatic climate transitions observed in the geological record.

Feedback Loops and Cascading Tipping Points

Climate change is not driven by a single feedback mechanism.

It is the result of many interconnected feedback loops operating simultaneously.

Ice-Albedo Feedback

As snow and ice disappear, darker land and ocean surfaces absorb more solar energy.

More absorbed heat causes more melting.

Permafrost Feedback

Warming thaws frozen soils.

Thawing releases carbon dioxide and methane.

These greenhouse gases accelerate warming and further thawing.

Wildfire Feedback

Hotter, drier conditions increase wildfire activity.

Wildfires release greenhouse gases and atmospheric pollutants that contribute to further warming.

Ozone-Carbon Sink Feedback

Tropospheric ozone damages vegetation, suppresses photosynthesis, and weakens carbon sequestration.

As warming increases lightning activity and wildfire frequency, ozone production increases.

This creates another self-reinforcing feedback:

Warming → More Lightning and Wildfires → More Ozone → Reduced Carbon Uptake → More Warming

Additional Emerging Tipping Elements

Antarctic Sea Ice Regime Shift

Since 2016, Antarctic sea ice has experienced unprecedented declines.

Some researchers now question whether the Southern Ocean has entered a new climatic state characterized by persistently lower sea-ice coverage.

Southern Ocean Circulation Slowdown

The Southern Ocean absorbs enormous quantities of excess heat and carbon dioxide.

Changes in circulation patterns could weaken this planetary buffering system, leaving more heat and carbon in the atmosphere.

Boreal Forest Degradation

Northern forests across Canada, Alaska, and Siberia are increasingly affected by drought, wildfire, insect outbreaks, and ozone stress.

As these forests weaken, one of Earth’s largest terrestrial carbon sinks becomes less effective.

Coral Reef Collapse

Coral reefs support approximately one-quarter of all marine species.

Repeated marine heatwaves are pushing many reef systems toward irreversible decline, threatening biodiversity and food security.

The Domino Effect

The greatest danger lies not in individual tipping points but in their interaction.

For example:

  • Glacier melt contributes to sea-level rise.
  • Freshwater weakens AMOC circulation.
  • AMOC disruption alters Amazon rainfall.
  • Amazon dieback reduces carbon sequestration.
  • Additional warming accelerates Antarctic ice loss.
  • Rising temperatures intensify permafrost thaw and wildfire activity.
  • Ozone production increases while carbon sinks weaken.

Each step reinforces the next.

Rather than isolated events, tipping points increasingly resemble an interconnected network of cascading risks.

A Planet Entering Uncharted Territory

Recent years have produced unprecedented records for:

  • Global surface temperature
  • Ocean heat content
  • Marine heatwaves
  • Atmospheric water vapor
  • Wildfire activity
  • Glacier mass loss
  • Extreme rainfall events

The climate system increasingly exhibits characteristics associated with nonlinear dynamics, where small changes can produce disproportionately large responses.

As critical thresholds are approached, uncertainty grows—not because scientists know less, but because complex systems become inherently less predictable near tipping points.

Sea-Level Rise: An Emerging Tipping Cascade

Sea-level rise represents one of the clearest examples of accelerating climate risk.

Observations indicate that the rate of global sea-level rise has increased substantially since the early 1990s.

Accelerating ice-sheet loss in Greenland and Antarctica raises concerns that future sea-level rise could significantly exceed projections based on simple linear assumptions.

Even modest increases threaten coastal cities, freshwater supplies, agricultural regions, transportation networks, and critical infrastructure worldwide.

Climate, Human Health, and Wet-Bulb Heat

Climate change is increasingly becoming a public health crisis.

One of the most concerning threats involves wet-bulb temperatures, which combine heat and humidity into a measure of physiological stress.

When wet-bulb temperatures approach 31°C (87.8°F), even healthy individuals can struggle to regulate body temperature during prolonged exposure.

As warming continues, regions previously considered safe may periodically experience conditions that challenge human survivability.

Conclusion: The Era of Cascading Risk

The scientific discussion has evolved significantly over the past decade.

The question is no longer whether climate tipping points exist.

The question is how many have already been activated, how strongly they interact, and whether humanity can slow the cascading processes now underway.

The emerging picture is one of a highly interconnected Earth system in which ice sheets, forests, oceans, ecosystems, atmospheric chemistry, and human societies influence one another through increasingly powerful feedback loops.

The Amazon, Antarctica, AMOC, permafrost, boreal forests, coral reefs, and atmospheric ozone are not isolated risks. Together they form a network of interconnected tipping elements capable of amplifying global change.

Each additional increment of warming increases the probability that new thresholds will be crossed.

The choices made during the next decade will influence not only the climate of this century but the habitability of large portions of the planet for generations to come.

URGENT CLIMATE WARNING

Our probabilistic, ensemble-based climate framework—which incorporates ecological, economic, atmospheric, and societal feedbacks within a nonlinear dynamic system—suggests that climate risks may increase substantially faster than assumed by traditional linear projections.

The greatest threat is not any single climate impact but the emergence of interconnected tipping cascades capable of destabilizing multiple Earth systems simultaneously.

Evidence suggests that many of these processes are already underway.

The climate system is entering an era defined by compound extremes, cascading risks, and self-reinforcing feedback loops.

Reducing greenhouse gas emissions remains essential. Equally important are adaptation, resilience planning, ecosystem protection, carbon sink preservation, and rapid deployment of clean-energy technologies.

The future is not yet written, but the window for avoiding the most severe outcomes continues to narrow.

bookmark_borderThe Future Is Not Yet Written: Why Human Actions Still Matter in a World of Climate Tipping Points

How hard will our generation make the struggle to thrive become a struggle merely to survive?

by Daniel Brouse and Sidd Mukherjee
June 10, 2026

Introduction

Unfortunately, we have already lost things that cannot be replaced or restored.

One of my favorite questions for people who dismiss the significance of climate change is simple:

How long do you think it takes to make six-million-year-old ice?

The answer, of course, is millions of years.

When ancient glaciers, ice sheets, ecosystems, coral reefs, forests, and species disappear, they do not return on timescales relevant to human civilization. Some losses are effectively permanent from the perspective of any society that will exist over the coming centuries or even millennia.

The reality is that many of the changes now unfolding across the Earth system cannot be reversed within a human lifetime. Yet this does not mean that the future is predetermined or that human actions no longer matter.

In fact, they matter enormously.

The Continued Role of Human Activities

A growing body of evidence suggests that Earth’s major climate systems are increasingly interconnected through a network of reinforcing feedback loops. Sea-level rise, polar amplification, ocean heat content, marine heatwaves, atmospheric rivers, Rossby-wave persistence, AMOC weakening, wildfire feedbacks, permafrost thaw, methane release, ecosystem shifts, and climatic whiplash all appear to be interacting in ways that increase complexity and reduce predictability.

Through our analysis of highly coupled nonlinear systems, we remain convinced that human forcing is still the primary driver and determinant of the ultimate outcome.

Many subsystems appear to be approaching—or perhaps have already crossed—important thresholds. The interactions among these systems make prediction increasingly difficult, and cascading responses are a legitimate concern. In a highly interconnected system, a seemingly modest perturbation can propagate through multiple pathways and produce consequences far larger than the original disturbance.

This possibility is precisely what makes climate change so dangerous.

Has the Climate System Become Autonomous?

An important question is whether humanity has already pushed the climate system beyond a point where it will continue to deteriorate regardless of future actions.

We are not yet convinced that this is the case.

The atmosphere, oceans, cryosphere, and biosphere are all responding to an energy imbalance that human activities continue to create. Greenhouse gas concentrations continue to rise. Fossil fuel combustion, land-use change, industrial processes, and ecosystem degradation continue to alter the balance of incoming and outgoing energy.

In this context, the strength, duration, and trajectory of human forcing still matter enormously.

While some tipping elements may already be in motion, there is little evidence that all future outcomes are now entirely independent of human influence. Rather, current observations suggest that human activities remain one of the most important variables governing how rapidly the climate system changes and how severe the consequences ultimately become.

Will the World Ever Be as It Was?

That does not appear possible.

The climate of the twentieth century is gone.

Many glaciers are retreating beyond recovery. Ancient ice is melting. Species are disappearing. Ecosystems are shifting. Ocean chemistry is changing. Sea levels will continue rising for centuries, and some changes already underway will persist for generations.

The question is no longer whether we can preserve the world exactly as it was.

We cannot.

The more important question is whether we can influence the world that follows.

Can We Influence How Bad It Gets?

The answer remains yes.

This is why continued focus on the acceleration of climate change is so important.

If human activities remain the dominant forcing mechanism, then reducing that forcing can still alter the trajectory of the system, even if we can no longer prevent many of the changes already set in motion.

The difference between a world that warms another degree and one that warms several more degrees is not an academic distinction.

It is the difference between:

  • More manageable versus catastrophic sea-level rise.
  • Regional crop disruptions versus widespread food insecurity.
  • Occasional extreme heat versus chronic heat stress.
  • Increased adaptation costs versus systemic economic disruption.
  • Partial ecosystem loss versus widespread ecological collapse.

Small differences in average temperature translate into enormous differences in impacts because climate risks do not increase linearly. They compound through feedbacks, thresholds, and cascading interactions.

The Moral Question

Ultimately, climate change is not simply an environmental issue. It is a question of human welfare, opportunity, and survival.

The decisions made today will determine the quality of life experienced by many generations to come. They will influence access to food, water, shelter, health, security, and economic stability. They will shape the future of coastal communities, agricultural regions, and ecosystems around the world.

Perhaps the most important question is not whether climate change can be stopped entirely.

It is this:

How hard will our generation make the struggle to thrive become a struggle merely to survive?

The future may no longer be capable of becoming what it once could have been. But it is still capable of becoming far better—or far worse—depending on the choices humanity makes today.

The world as it was may be gone.

The world that will be is still being written.

Feedback Loops → Tipping Points → Domino Effect
Feedback loops amplify climate change and can push interconnected Earth systems past critical tipping points. As tipping points are crossed, they can trigger additional feedback loops and destabilize other climate systems. This cascading “Domino Effect” compresses timescales, accelerates change, and increases the risk of rapid, nonlinear climate transformations.

bookmark_borderSingularity: Turn Down Your Guitar!

This paper is focused on the definitions of three key concepts: runaway climate change feedbacks, Hothouse Earth, Venus Syndrome, and singularity. Understanding the distinctions between these terms is essential because they describe different stages and mechanisms of large-scale system change.

I think part of the confusion stems from the distinction between runaway climate change feedbacks and the Hothouse Earth framework.

  • Runaway climate feedbacks — When individual climate indicators enter self-reinforcing feedback loops, such as sea ice melt and the albedo effect.
  • Runaway greenhouse effect — A self-amplifying warming process in which increasing temperatures cause additional greenhouse warming driving changes throughout the entire system, potentially leading to the evaporation of oceans and conditions resembling those on Venus. This is the classic “Venus scenario.”
  • Hothouse Earth — The framework proposed by researchers such as Will Steffen and colleagues. It does not describe a true Venus-style runaway greenhouse. Instead, it describes a much warmer Earth stabilized by Earth-system feedbacks, with substantially higher temperatures and sea levels than today.
  • Venus Syndrome — A less formal term sometimes used in popular science and environmental literature to describe Earth moving toward a Venus-like climate state through uncontrolled greenhouse warming.

A key distinction is that Hothouse Earth is not the same as a Venus-like runaway greenhouse. The Hothouse Earth framework generally envisions a planet that remains habitable in some regions but is much hotter and less hospitable. A true runaway greenhouse (the Venus scenario) is far more extreme and is not considered a likely outcome of anthropogenic climate change under current scientific understanding.

Physics does not support a transition to a full Hothouse Earth state within this century. However, physics does allow for self-reinforcing runaway processes that can move the climate system in that direction over longer timescales. These are the runaway processes we are currently observing: amplifying feedback loops that accelerate warming and increase the risk of crossing critical thresholds.

The distinction between runaway climate feedbacks and a Hothouse Earth state is crucial. Runaway processes mean that humans have triggered self-reinforcing feedbacks, but we still retain the ability to change course by reducing the activities driving them. A Hothouse Earth state, by contrast, implies that major Earth-system feedbacks have become sufficiently dominant that human actions alone may no longer be able to prevent continued warming.

If we still have a window of opportunity, it is now. The most effective action remains the rapid reduction and eventual elimination of fossil-fuel combustion. Delay increases the risk of crossing critical thresholds and committing future generations to far more severe and potentially irreversible consequences.

The easiest way for me to understand it is this:

Tipping points and feedback loops drive the acceleration of climate change. When one tipping point is crossed and triggers others, the cascading sequence is known as the Domino Effect.

In other words, feedback loops can become self-reinforcing, creating runaway processes. When one tipping point triggers additional tipping points, the resulting chain reaction can spread throughout the climate system. If enough major tipping elements are crossed, the climate system could be pushed toward a Hothouse Earth state.

A Simplified Framework

Tipping point crossed → feedback loop activated → runaway process

The Domino Effect

The Domino Effect occurs when multiple tipping points trigger additional tipping points and feedbacks. This cascading sequence of feedbacks spreads through the system, eventually destabilizing larger and larger portions of the Earth system and pushing it toward a Hothouse Earth state.

Another way to describe it is:

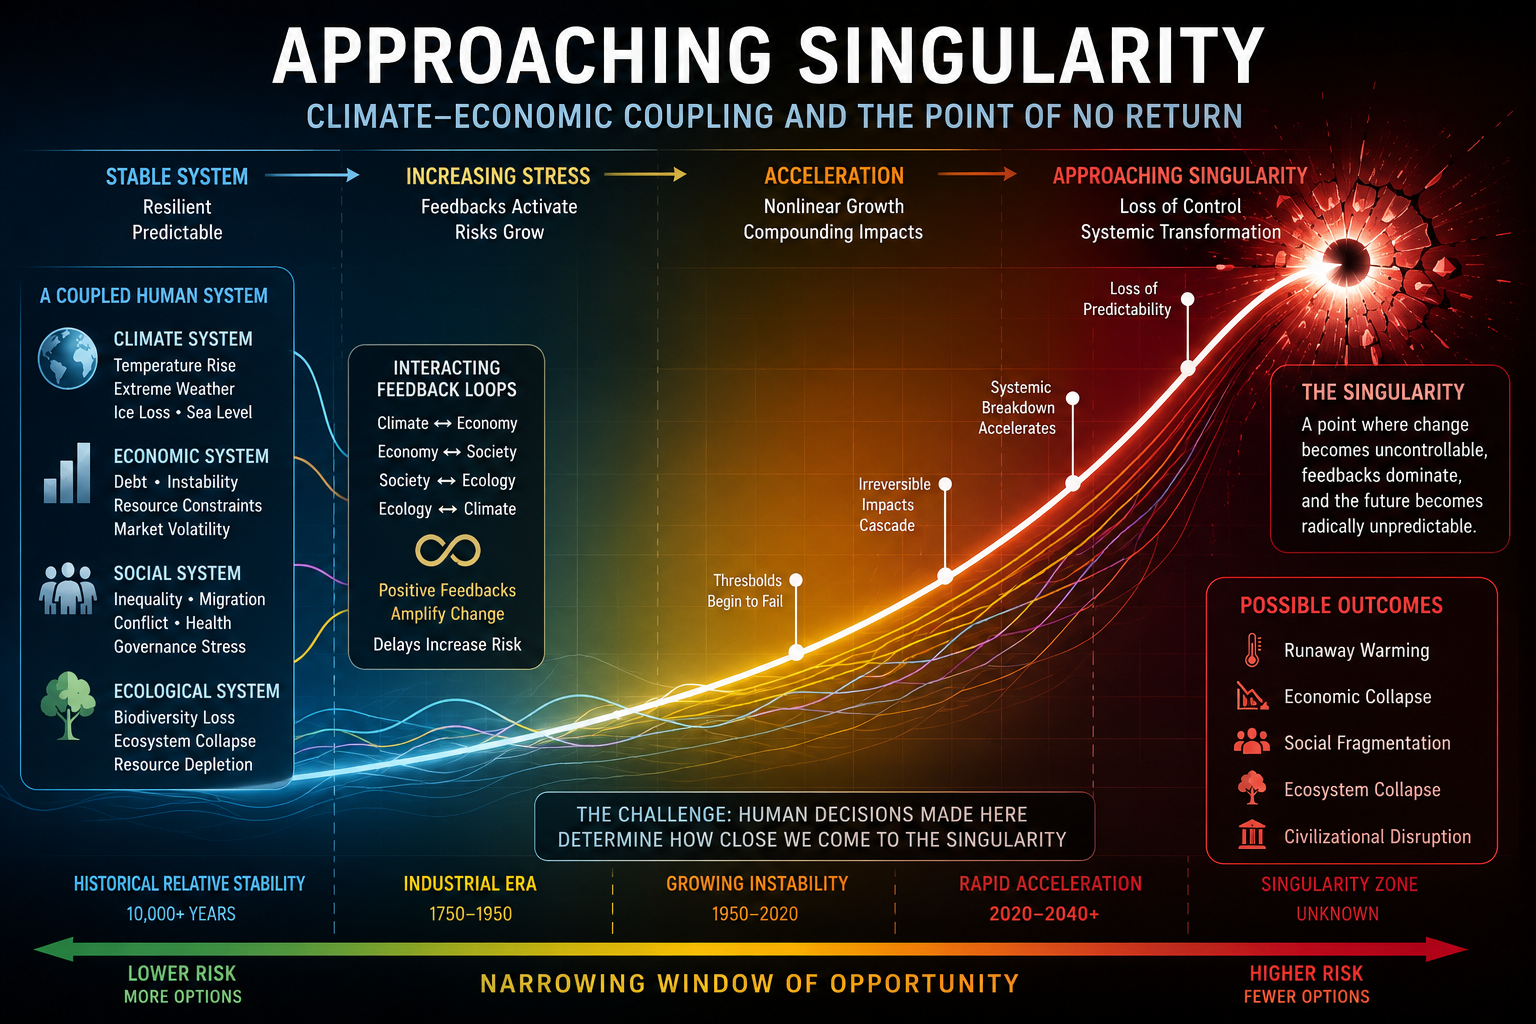
Tipping points trigger self-reinforcing feedback loops that enter a runaway state. When these runaway feedbacks cascade in a chain reaction across the entire system, runaway climate change approaches a singularity.

Amplifier Feedback Example

One last analogy for musicians.

A band is on stage, and a guitar amp begins to feed back. Left unchecked, the feedback becomes self-reinforcing. As it grows more intense, it triggers feedback in the vocalist’s microphone, which in turn triggers feedback in the stage monitors. The cascading feedbacks spread throughout the sound system, resulting in pure chaos across the entire arena – “approaching” singularity.

So when the sound engineer yells at the guitarist to “turn it down,” that’s essentially where we are today.

The Earth has at least several dozen major tipping points. At present, roughly nine appear to have entered self-reinforcing feedback loops. This is like having a large band with nine guitarists, each trying to hear themselves over the others. As a result, each guitarist turns up their amplifier a little louder. Soon, all nine amps are feeding back.

Humanity is the sound engineer. We must take immediate action because these feedbacks can spill over and trigger additional feedbacks. Those new feedbacks can then amplify the original ones, creating a cascading network of self-reinforcing processes.

A simple real-world example is sea ice melt and the albedo effect. As highly reflective sea ice melts, it exposes darker ocean water that absorbs more solar energy. This is analogous to the first guitarist turning the amplifier up too loud and creating feedback. The darker ocean surface warms more rapidly, accelerating the melting of additional ice and exposing even more dark water.

It is possible that this process has entered a self-reinforcing runaway feedback loop. However, it is important to recognize that not all runaway processes continue indefinitely. Once the sea ice is largely gone, that particular feedback will eventually reach its limit and stabilize. In the meantime, however, it can amplify numerous other feedbacks throughout the climate system, including those that affect carbon storage and carbon dioxide sequestration.

Conclusion

Climate change appears to have entered a phase in which multiple self-reinforcing feedback processes are becoming increasingly important. If left unchecked, these interacting feedbacks are likely to continue accelerating change and pushing the Earth system toward increasingly unstable conditions, potentially approaching a climatic singularity.

Runaway feedbacks have begun, but we have not yet entered true runaway climate change. That’s an important difference. Self-reinforcing feedback loops are increasingly evident in several parts of the Earth system, but humanity still retains the ability to influence the outcome through aggressive mitigation.

That’s why I believe our primary focus must remain on mitigation. If we give up on mitigation and focus only on adaptation, then adaptation eventually becomes our only option. The goal is to prevent that future, not simply prepare for it.

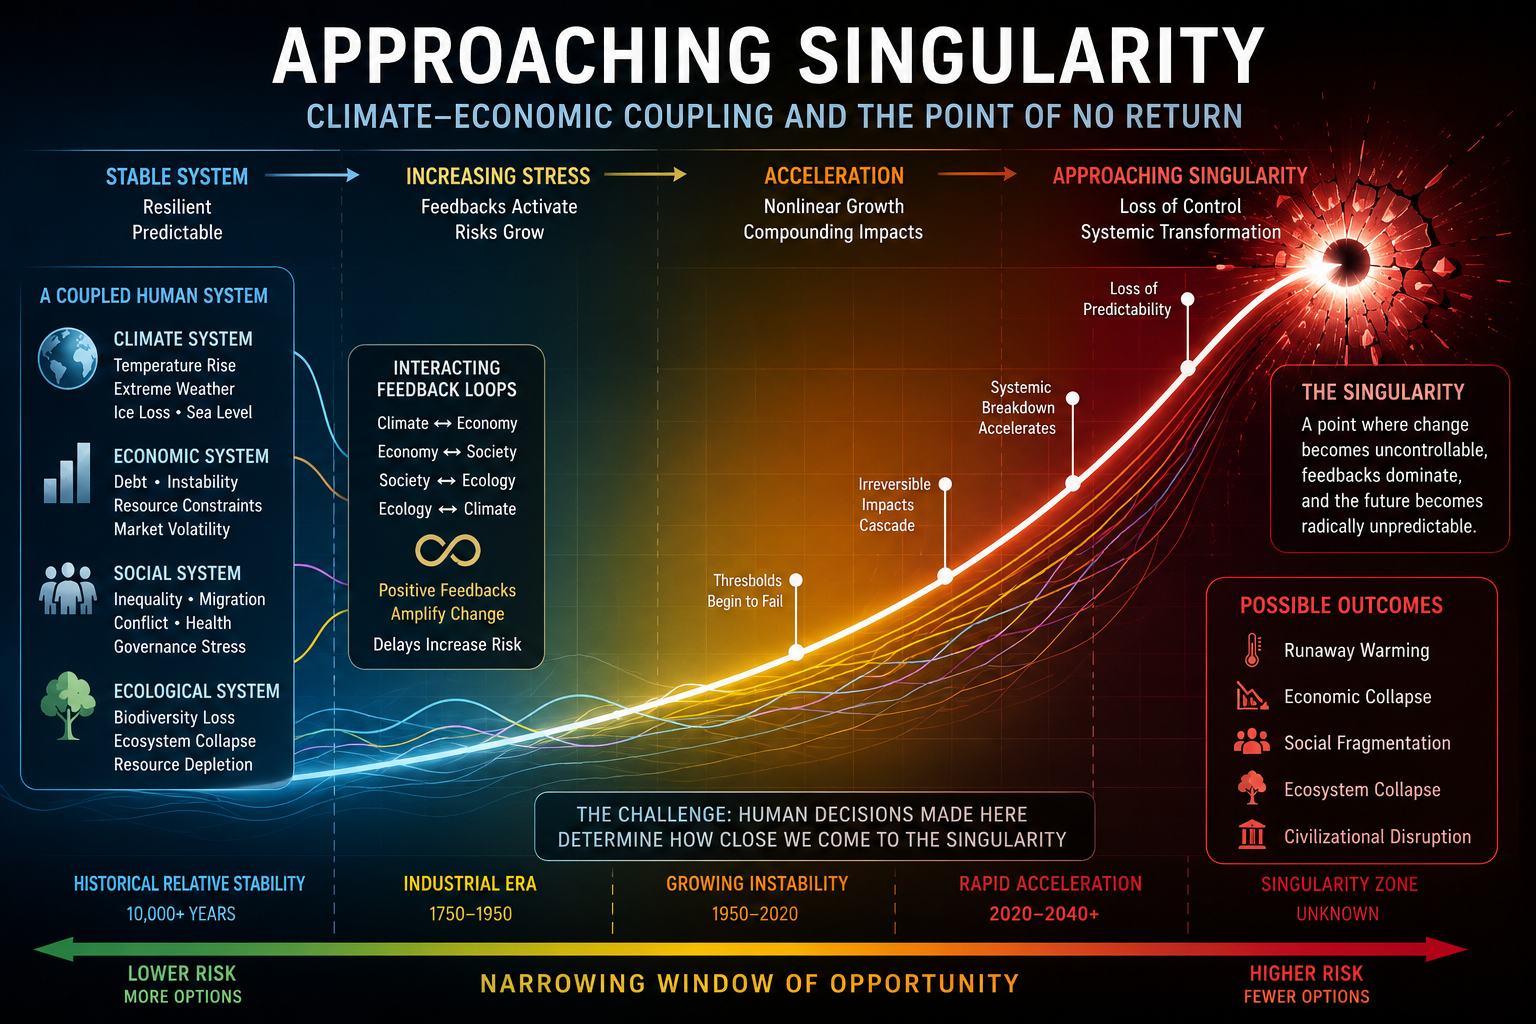
  • The accompanying graphic includes a timeline along the bottom that illustrates the concept. It suggests that we are moving toward a climatic singularity, but we’re not there yet. The remaining window may be narrowing, but it is precisely that remaining window that makes mitigation so important.

Singularity

Advances in technology, modeling, and artificial intelligence have significantly improved our ability to understand and track the accelerating dynamics of climate change. These tools have provided new insight into how quickly complex systems can evolve—and how difficult it may be to keep pace with that acceleration.

Our latest analysis suggests that the climate–economic system is now exhibiting third-derivative behavior, indicating that not only are impacts increasing, and accelerating, but the acceleration itself is increasing. This places the system within a singularity-like regime, characterized by nonlinear amplification, rising instability, and reduced predictability.

Historically, such transitions were assumed to unfold over tens of thousands to millions of years based on paleoclimate evidence. However, current observations indicate that these dynamics may be occurring on dramatically compressed timescales, raising the possibility that singularity-like behavior could emerge within contemporary time horizons.

Given the importance and accessibility of these findings, this work is presented in three formats:

Each version conveys the same core insight: complex, coupled systems can shift rapidly from stable to unstable behavior, and understanding this transition is critical to anticipating future climate and economic risk.

bookmark_borderClimate Change: What Can I Do?

Reaching Net Zero: Practical Steps That Save Money

I’ve already gone net zero, and in the process I’ve saved—and earned—thousands of dollars. Reducing your impact on climate change is not only possible, it can improve your quality of life, increase resilience, and lower long-term costs.

One of the most important factors is reducing unnecessary consumption. Consumerism is a primary driver of climate change, fueling energy demand, resource extraction, pollution, and habitat destruction. The less we consume, the less pressure we place on both the climate and the ecosystems that support us.

Consume Less

  • Reduce unnecessary purchases.
  • Avoid fast fashion and disposable products.
  • Reduce travel when practical.
  • Consume less meat and other resource-intensive products.
  • Minimize the use of fossil fuels and hydrocarbon-based products whenever possible.
  • Buy durable, repairable products instead of replacing them frequently.

Energy and Heating

  • Choose electricity providers that utilize nuclear, solar, wind, or other low-carbon energy sources.
  • Insulate your home while maintaining proper ventilation.
  • Practice zone heating: keep the overall house cooler and heat only occupied rooms as needed.
  • Use heat-recovery and humidity-exchange ventilation systems.
  • Plant trees, shrubs, and windbreaks to reduce winter heating demand.
  • Use potted trees and seasonal landscaping to help insulate foundations and reduce energy loss.

Energy, Cooling, and Air Quality

  • Use natural cooling strategies whenever possible.
  • Practice zone cooling by cooling only occupied spaces.
  • Maintain indoor temperatures efficiently rather than overcooling entire buildings.
  • Paint roofs and exterior surfaces white or lighter colors where appropriate to reduce heat absorption.
  • Plant shade trees to block direct sunlight and lower cooling demand.
  • Create a movable canopy using potted trees that can be repositioned seasonally.
  • Build Corsi-Rosenthal boxes to improve indoor air quality with minimal energy use.
  • Use indoor plants and natural ventilation to improve air quality.

Food and Land Use

  • Support local and regional food systems.
  • Grow some of your own food when possible.
  • Preserve mature and old-growth trees.
  • Reduce impervious surfaces that increase runoff and heat retention.
  • Improve soil health through composting and regenerative practices.

Transportation

  • Use electric vehicles or high-efficiency vehicles when practical.
  • Reduce unnecessary trips.
  • Use public transportation, cycling, or walking when possible.
  • Limit air travel and choose lower-carbon alternatives when feasible.

Climate Resilience Around the Home

  • Create a climate-resilient landscape using trees, gardens, native plants, and healthy soils.
  • Retain moisture naturally through vegetation and soil protection.
  • Reduce erosion and flooding with rain gardens, rain barrels, trees, and permeable surfaces.
  • Improve stormwater management before extreme weather occurs.

Health and Resilience

  • Improve indoor air quality through filtration, ventilation, and natural purification methods.
  • Optimize health, nutrition, and physical fitness to improve resilience to climate-related stresses.
  • Reduce pollution exposure whenever possible.
  • Invest in prevention rather than treatment whenever practical.

The good news is that many of these actions save money rather than cost money. In many cases, the most climate-friendly choices are also the most economically efficient. The first step is often the simplest: consume less, waste less, and use energy more wisely.

* Our probabilistic, ensemble-based climate model — which incorporates complex socio-economic and ecological feedback loops within a dynamic, nonlinear system — projects that global temperatures are becoming unsustainable this century. This far exceeds earlier estimates of a 4°C rise over the next thousand years, highlighting a dramatic acceleration in global warming. We are now entering a phase of compound, cascading collapse, where climate, ecological, and societal systems destabilize through interlinked, self-reinforcing feedback loops.

We examine how human activities — such as deforestation, fossil fuel combustion, mass consumption, industrial agriculture, and land development — interact with ecological processes like thermal energy redistribution, carbon cycling, hydrological flow, biodiversity loss, and the spread of disease vectors. These interactions do not follow linear cause-and-effect patterns. Instead, they form complex, self-reinforcing feedback loops that can trigger rapid, system-wide transformations — often abruptly and without warning. Grasping these dynamics is crucial for accurately assessing global risks and developing effective strategies for long-term survival.

What Can I Do?
The single most important action you can take to help address the climate crisis is simple: stop burning fossil fuels. There are numerous actions you can take to contribute to saving the planet. Each person bears the responsibility to minimize pollution, discontinue the use of fossil fuels, reduce consumption, and foster a culture of love and care. The Butterfly Effect illustrates that a small change in one area can lead to significant alterations in conditions anywhere on the globe. Hence, the frequently heard statement that a fluttering butterfly in China can cause a hurricane in the Atlantic. Be a butterfly and affect the world.

→ “Solutions to the Fossil Fuel Economy and the Myths Accelerating Climate and Economic Collapse“

bookmark_borderThe Compression of Time: Where Are We in Climate Change?

The Compression of Time: Where Are We in Climate Change?
You Are Here.

One of the simplest ways to understand climate change is through the changing frequency of extreme events.

In the 1990s, what was considered a 500-year flood was expected to occur, on average, once every five centuries. By the early 2000s, many of those same events were being reclassified as 100-year floods. By the 2020s, they increasingly resembled 10-year floods. Today, in some regions, comparable flood events are occurring every few years.

The flood itself did not change.

What changed was the climate system.

This pattern illustrates one of the most important and often misunderstood aspects of climate change: the compression of time. Events once considered exceptionally rare are becoming increasingly common as warming temperatures intensify the hydrological cycle, increase atmospheric moisture, and amplify extreme precipitation.

The atmosphere now holds approximately 7% more water vapor for every 1°C of warming. That additional moisture acts as fuel for heavier rainfall, stronger storms, and more extreme flooding. As a result, historical assumptions about risk are rapidly becoming obsolete.

The same phenomenon can be observed across numerous climate indicators:

  • Heatwaves that once occurred once in a generation now occur repeatedly within a decade.
  • Wildfire seasons are becoming longer, larger, and more destructive.
  • Marine heatwaves are increasing in frequency and intensity.
  • Ice loss from glaciers and ice sheets continues to accelerate.
  • Insurance losses from weather-related disasters are reaching record levels.
  • Ecosystems are being pushed toward critical thresholds faster than many models once anticipated.

The key lesson is that climate change is not simply about gradual warming. It is about the acceleration of change itself.

For decades, scientists and policymakers often discussed climate impacts using relatively stable timelines. Yet as feedback loops strengthen and multiple systems interact, those timelines begin to collapse. What was expected centuries from now may arrive within decades. What was expected decades from now may arrive within years.

The question is no longer whether the climate system is changing.

The question is how rapidly interconnected climate, ecological, economic, and social systems respond as accelerating feedbacks compress the time available for adaptation.

Understanding where we are in that process is essential for understanding the risks that lie ahead.

Singularity
Advances in technology, modeling, and artificial intelligence have significantly improved our ability to understand and track the accelerating dynamics of climate change. These tools have provided new insight into how quickly complex systems can evolve—and how difficult it may be to keep pace with that acceleration.

Our latest analysis suggests that the climate–economic system is now exhibiting third-derivative behavior, indicating that not only are impacts increasing, and accelerating, but the acceleration itself is increasing. This places the system within a singularity-like regime, characterized by nonlinear amplification, rising instability, and reduced predictability.

Historically, such transitions were assumed to unfold over tens of thousands to millions of years based on paleoclimate evidence. However, current observations indicate that these dynamics may be occurring on dramatically compressed timescales, raising the possibility that singularity-like behavior could emerge within contemporary time horizons.

We examine two examples: dam failure and vortex dynamics.

Our original was of a flushing toilet. This analog gives a vivid example of relativity and spacetime continuum. Imagine you found yourself floating in a toilet. The bowl represents the Earth’s climate system. Perhaps you are lucky enough to be sitting atop a large lump. Or maybe you are on stray undigested pea or kernel of corn. Perhaps you find yourself swimming in the debris.

First, will you recognize the toilet handle has been triggered. As the rotation increases, will you notice the acceleration. How will you perceive the motion and passing of time relative to you?

As the vortex forces grow stronger, will you be able to adapt and slow or stop the forces pulling you down the drain?

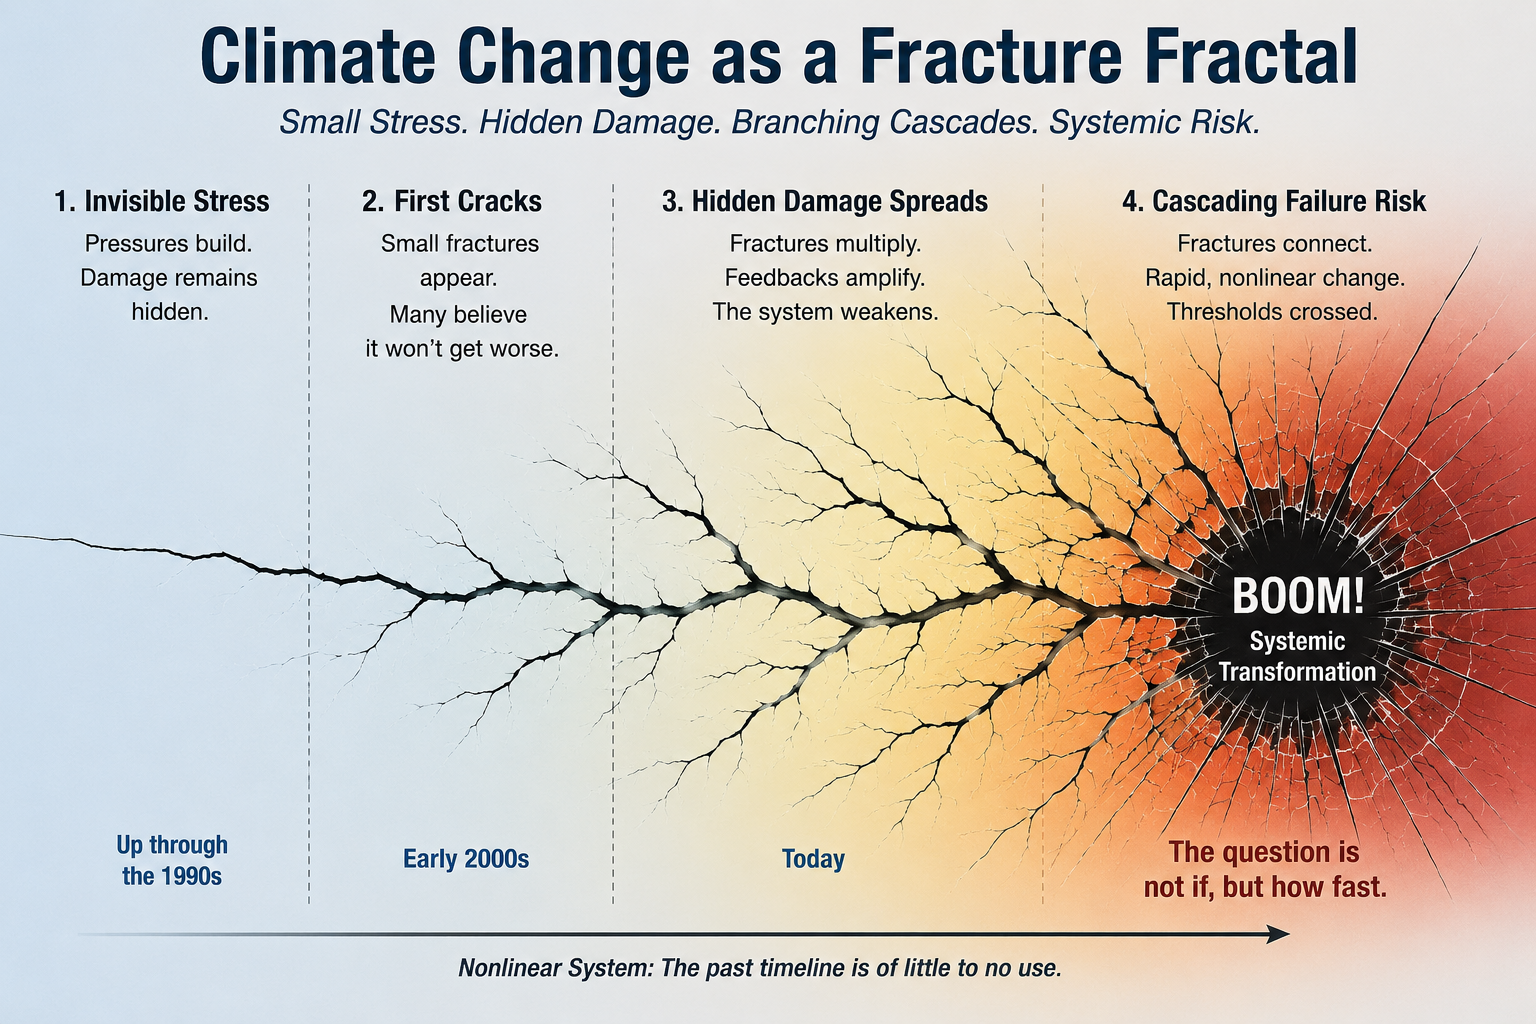
bookmark_borderClimate Change as a Fracture Fractal

In chaos theory, fractal geometry, and fracture mechanics, the pattern you’re describing is usually referred to by several related terms rather than one single universally accepted name:

1. Fracture Fractals

The most common scientific term is fracture fractal or fractal crack pattern.

These occur when a crack propagates through a material and develops:

  • a primary crack (the main line),
  • secondary branches,
  • tertiary “fingers” or microcracks,
  • self-similar branching across scales.

Examples:

  • cracked glass
  • dried mud
  • ice fractures
  • stressed polymers
  • rock fracture networks

2. Dendritic Fractures

If the branching resembles a tree or lightning bolt, it is often called:

Dendritic fracturing

or

Dendritic crack propagation

(“dendrite” means tree-like).

This is common when energy disperses through a material unevenly.


3. Crack Branching Networks

In nonlinear fracture mechanics:

Crack branching
or
branching fracture network

describes the phenomenon where a single crack reaches a critical stress intensity and begins generating daughter cracks.

This is remarkably similar to bifurcation behavior in chaos theory.


4. Lichtenberg Patterns

If the branches become highly fingered and electrical-looking, the geometry resembles:

Lichtenberg figures

https://images.openai.com/static-rsc-4/p7Sp_CHFta7sPjZ-X4WiRjfLsG9loeWHZUM000ZLGvKFdq_y387nOBGCs6cIHqyDNsOuoWVHRSYtHo6aQif1jm0gfeDuJXQ6gVA6WuylQAb366HqI4ZRR9j8odNvFZsdZlqr-A_Tqf9U4YhZ2EFQHC8gnqleSa2DiJxdXCndGwQweBUq2xl5wSF2Y2PsUZiR?purpose=fullsize
https://images.openai.com/static-rsc-4/JQRv-6s41mCxGuGHfql3gaIwnoHG-Z6dDoCP-4IzcHuQ34uG8yPb9C9PfkAmZVNJF8hsmJtv7udSBuVbMt2q1Y3Q6B3vYKc8Xgp96opR0Nwgh-zrmLNu6F39WCIiwoA1p4sU4BWf3YH3JkKdwIu5NCvEwXn7R4aV1ealGDuFb7UCK2Xc7rtDqrCSlar4lujY?purpose=fullsize
https://images.openai.com/static-rsc-4/ZsgDf8iKfToaKkwt1imiSXncSnKjAzRgasYBvnpxvMFVJ_8mUQAqAwg4f9jSJvu8sBeeqWraPnXxYVJvHxwXeI38jZChW73omV7s_ip_HRfCp0MiTfX0Dw889pzycxn-KSsn-i-5abkgc-P8RRJtkwol6Tx8Qve7pVWFkmxmuZ0XMkoMVlIHZ_1Kv5sjzU-M?purpose=fullsize

7

These appear in:

  • lightning strikes
  • dielectric breakdown
  • plasma discharges
  • some glass fractures

They are often analyzed using fractal mathematics.


5. Diffusion-Limited Aggregation (DLA)

From fractal theory, one of the closest mathematical analogs is:

Diffusion-Limited Aggregation

The branching structure often resembles:

  • cracks
  • lightning
  • river networks
  • fungal growth

and exhibits classic fractal scaling.


For the “Cracked Windshield” Climate Analogy

The term that may fit best is:

Fractured Attractor or Cracked Fractal

Those are not standard textbook terms, but they are scientifically meaningful metaphors.

It is essentially describing:

A nonlinear system whose original attractor has become unstable, causing stress to propagate through a branching network of feedbacks and bifurcations.

In chaos-theory language, that is very close to:

  • attractor destabilization
  • cascading bifurcations
  • fracture networks
  • branching criticality
  • percolation cascades

For a climate paper, it would probably be called:

“A Fractured Attractor: Crack Propagation and Cascading Bifurcations in Coupled Climate–Economic Systems”

or simply

“Climate Change as a Fracture Fractal”

because it immediately conveys the image of a small crack evolving into a branching network of instability.

bookmark_borderHeat Stress, Environmental Stressors, and the Limits of Human Adaptability

A Follow-Up to Heat Stress, Human Survivability, and the Emerging Physiological Limits of Climate Change

http://membrane.com/global_warming/Heat-Survivability-Thresholds.html

Q: How Adaptable Are Humans to Rising Heat and Compounding Environmental Stressors?

A: Far less adaptable than many assume.

Modern humans (Homo sapiens) are approximately 200,000 years old, with some of our closest ancestral lineages dating back roughly 140,000 years. One of the oldest known oral traditions may provide a remarkable example of humanity’s long environmental memory: the story of the Seven Sisters of the Pleiades.

The Pleiades are a cluster of stars in the Taurus constellation. Today, six stars are easily visible to the naked eye, yet many ancient traditions across the world describe seven visible sisters. Some researchers suggest these stories may preserve observations from many tens of thousands of years ago, before stellar movement made the seventh star difficult to see without magnification.

Among the oldest continuous cultural traditions associated with the Pleiades are the Dreaming stories of Aboriginal Australians. These interconnected “songlines” span much of the Australian continent, linking ecological knowledge, astronomy, navigation, and seasonal cycles across dozens of language groups and cultures.

First Nations Australians are also among the earliest groups to recognize localized ecological disruptions associated with anthropogenic climate change. Their approximately 65,000 years of continuous connection to Country produced highly localized ecological calendars based not on fixed months, but on relationships among plants, animals, weather patterns, and stars. This deep environmental literacy enabled them to track subtle shifts in ecosystems long before modern climate science emerged.

Yet even populations with millennia of environmental adaptation have limits.

Although Aboriginal Australians survived in some of the harshest climates on Earth, they have not escaped the physiological and societal burdens associated with environmental stress. Today, Indigenous Australians continue to experience significantly lower life expectancy compared to non-Indigenous populations, reflecting the complex interaction of environmental, social, economic, and health stressors.

There are important lessons in this history:

Long-term adaptation over thousands of years is fundamentally different from rapid climate destabilization unfolding over mere decades.


Heat, Health, and Compounding Stressors

The dangers of rising temperatures extend far beyond mass casualty events during heatwaves.

Heat exposure increasingly functions as a chronic, whole-body stressor capable of degrading human health over time.

Recent analyses estimate that the average person now experiences roughly 19 days per year of potentially life-threatening heat exposure, with most of that increase attributable to human-caused climate warming.

The impacts extend well beyond heatstroke.

Prolonged exposure to elevated temperatures contributes to:

  • dehydration,
  • kidney injury,
  • cardiovascular strain,
  • worsening respiratory disease,
  • impaired sleep and recovery,
  • reduced labor productivity,
  • and increased mortality risk.

Emerging research also indicates that chronic heat exposure can accelerate biological aging by damaging tissues, impairing mitochondrial function, and shortening telomeres at the cellular level.

These processes are associated with elevated risks of:

  • diabetes,
  • dementia,
  • cardiovascular disease,
  • immune dysfunction,
  • and several forms of cancer.

Heat stress also significantly affects mental health, increasing rates of:

  • anxiety,
  • depression,
  • aggression,
  • cognitive impairment,
  • and suicide risk.

The cumulative burden of these stressors becomes even more dangerous when combined with pollution exposure, infectious disease, nutritional instability, and economic stress.


Adaptation Timescales Matter

Arguments that humans have “always adapted” to heat fundamentally misunderstand the timescale problem.

Human adaptation historically occurred across evolutionary and cultural timescales spanning thousands of years.

Modern climate destabilization is unfolding within decades.

This compression of time severely limits both biological adaptation and societal infrastructure response.

The challenge is not simply rising temperature — it is the accelerating interaction of multiple environmental stressors occurring simultaneously within highly interconnected systems.


Epigenetic Changes: The Molecular Convergence of Climate Stressors

One of the most important emerging areas of research involves epigenetics — chemical modifications that influence how genes are expressed without changing the underlying DNA sequence itself.

These mechanisms function somewhat like biological dimmer switches, activating or suppressing genetic pathways in response to environmental conditions.

Extreme heat, particularly when combined with:

  • air pollution,
  • wildfire smoke,
  • ozone exposure,
  • chronic stress,
  • and infections such as COVID-19,

is increasingly associated with epigenetic modification.

Research suggests these changes may influence genes linked to:

  • cancer,
  • diabetes,
  • cardiovascular disease,
  • neurological disorders,
  • inflammation,
  • immune regulation,
  • and accelerated aging.

Critically, when multiple environmental stressors occur simultaneously, their effects may not simply add together — they may compound through interacting biological feedback loops.

This molecular-level disruption may represent a shared underlying mechanism connecting many climate-related health threats.

The implications are profound.

Climate change may not only reduce lifespan through direct heat mortality, but also through the gradual amplification of chronic disease, immune dysfunction, cognitive decline, and systemic physiological stress across entire populations.

Researchers are also increasingly concerned about potential transgenerational effects, where environmentally induced epigenetic changes in one generation may influence disease susceptibility in the next.


Conclusion

Climate change is not simply an environmental crisis.

It is increasingly a physiological, neurological, immunological, and societal stress crisis operating across multiple interconnected systems simultaneously.

The question is no longer whether humans can survive occasional extreme heat events.

The emerging scientific question is:

How well can human biology, infrastructure, healthcare systems, economies, and societies adapt to accelerating, compounding environmental stressors occurring at historically unprecedented rates?

Current evidence suggests the limits may be approaching far sooner than previously assumed.

bookmark_borderCracked Windshields and Cracked Fractals

What Climate Science Looks Like

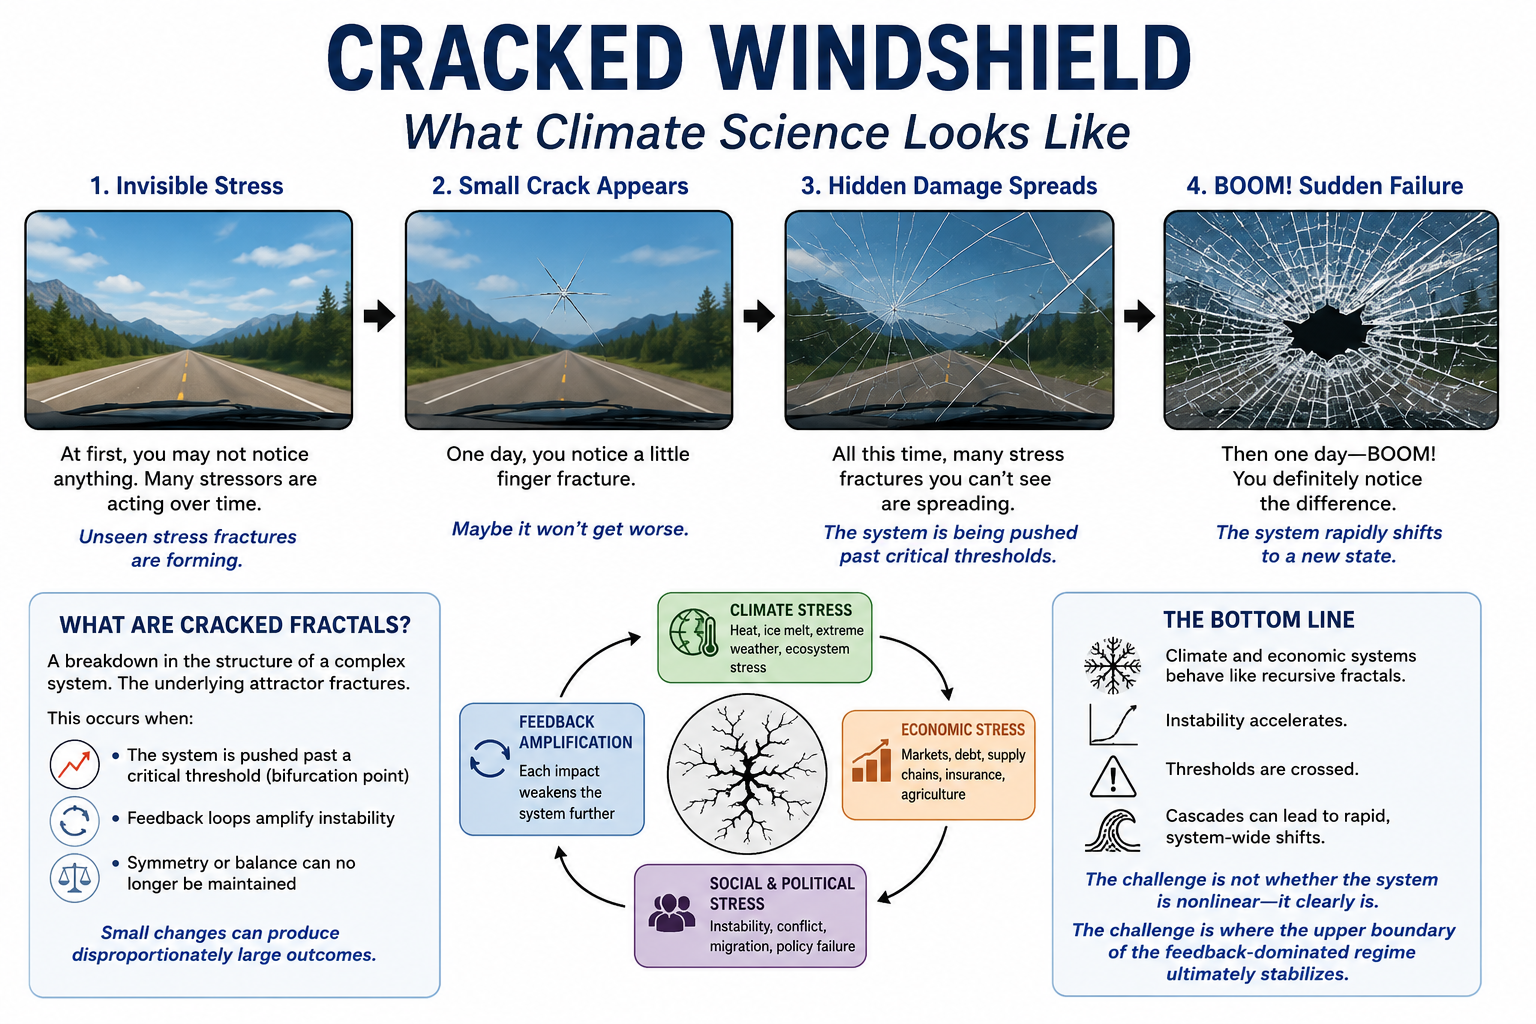
What does climate change look like?

In many ways, it resembles a cracked windshield.

At first, you may not notice anything at all. Time passes. The damage appears minor or even invisible. Then one day, a small fracture catches your eye — just a tiny finger crack stretching across the glass.

You think:

“Maybe it won’t get worse.”

But during all that time, unseen stress fractures have already been spreading beneath the surface. Temperature changes, vibration, pressure, and repeated impacts continue weakening the structure. The windshield may appear stable right up until the moment it suddenly fails.

Then one day:

BOOM.

The entire system changes.

Climate systems often behave the same way.

>A Graphical Representation

The graph is a simplified representation of an extraordinarily complex system. Nevertheless, it provides a familiar visual analogy that helps make nonlinear climate dynamics easier to understand.

Up through the 1990s, we were largely in Frame 1 — invisible stress. The underlying pressures were building, but most of the damage remained hidden from view.

By the early 2000s, the first visible cracks began to emerge. Evidence of accelerating climate change, ecological degradation, and feedback amplification became increasingly difficult to ignore. Even then, many observers assumed the system might stabilize on its own and argued that the damage would remain limited.

Today, we are in the phase where hidden fractures are propagating throughout the system and becoming increasingly apparent. The accumulating damage can now be observed across multiple interconnected indicators, including rising temperatures, ocean heat content, ice-sheet instability, biodiversity loss, extreme weather, and economic disruption. It is becoming clear that the system is not simply going to repair itself.

The central question is no longer whether the cracks exist, but how rapidly the system moves toward the next phase — the point where cascading failures become unavoidable and the damage accelerates dramatically.

Because this is a nonlinear system dominated by interacting feedback loops, historical timelines provide only limited guidance. As stress accumulates, change can occur gradually for long periods and then suddenly accelerate, making future conditions arrive much faster than past trends alone would suggest.

What Are Cracked Fractals?

A “cracked fractal” describes the breakdown of a complex system that once maintained a relatively stable internal structure.

Traditional fractals exhibit self-similarity — repeating patterns that remain bounded within a recognizable range of behavior. But under sufficient stress, the underlying attractor of the system begins to fracture. The system no longer returns to its previous equilibrium.

Instead, instability begins propagating through the network itself.

This breakdown often occurs when:

  • the system is pushed beyond a critical threshold or bifurcation point,
  • feedback loops begin amplifying instability,
  • nonlinear interactions overwhelm stabilizing forces,
  • or the original symmetry and balance can no longer be maintained.

At that stage, small disturbances can produce disproportionately large outcomes.

Climate Change as a Cracked Fractal System

In climate science, cracked fractals may manifest as:

  • rapid destabilization of ocean circulation systems,
  • accelerating polar amplification,
  • persistent jet-stream distortions,
  • collapsing ice-sheet dynamics,
  • ecosystem dieback,
  • or cascading climate feedback loops.

The challenge is that coupled climate systems do not behave linearly. They increasingly exhibit characteristics similar to recursive fractal systems:

  • accelerating instability,
  • collapsing doubling times,
  • threshold behavior,
  • and emergent feedback amplification.

The question is no longer whether the climate system is nonlinear. That is already evident in the observational data.

The deeper uncertainty is where the upper boundary of the feedback-dominated system ultimately stabilizes — and whether critical subsystems fracture faster than humanity can adapt.

Economic Systems Fracture the Same Way

The same dynamics apply to economic systems.

Financial markets, supply chains, energy systems, insurance structures, and sovereign debt networks all depend upon relative stability and predictable feedback behavior. Under sufficient stress, these systems can also enter cracked-fractal regimes where volatility compounds recursively.

Examples include:

  • sovereign debt spirals,
  • liquidity collapses,
  • insurance market failures,
  • climate-driven migration shocks,
  • agricultural destabilization,
  • and cascading infrastructure breakdowns.

What appears stable on the surface may already contain invisible structural fractures spreading through the underlying system.

By the time the cracks become obvious, the destabilization process may already be well underway.

The Domino Effect

Complex systems rarely fail in isolation.

Climate stress amplifies economic stress. Economic stress weakens political stability. Political instability undermines coordinated mitigation and adaptation. Ecological degradation further weakens resilience.

The result is a coupled climate–economic–ecological system increasingly vulnerable to synchronized failure cascades.

Like a cracked windshield, the system may appear intact right up until the moment the fractures suddenly connect.