Daniel Brouse and Sidd Mukherjee
Abstract
Global mean surface temperature is the most widely cited metric of climate change. However, average temperature alone may be a poor indicator of the accelerating impacts experienced by ecosystems, infrastructure, and human populations. Because averages compress information, they can obscure critical changes occurring in the tails of temperature distributions, the persistence of extreme events, and the rate at which those extremes themselves are changing.
This paper argues that the most important climate signal may no longer be mean warming but the acceleration of extreme heat behavior. Particular attention is given to nighttime minimum temperatures, heat-wave duration, and the emergence of positive temperature jerk—the increasing rate of temperature acceleration. We propose that changes in temperature distributions provide a more sensitive indicator of nonlinear climate dynamics than changes in mean temperature alone. Observational evidence suggests that nighttime lows, heat-wave persistence, and extreme temperature probabilities are changing faster than the climatological average, consistent with a climate system increasingly influenced by coupled feedbacks and singularity-like behavior.
1. Introduction
Climate discussions frequently focus on changes in global average temperature. While this metric is useful for tracking Earth’s energy imbalance, it provides limited insight into how climate change is experienced by biological and social systems.
Human mortality, agricultural productivity, ecosystem resilience, electrical grid performance, and infrastructure failure are rarely governed by average conditions. Instead, impacts are determined by extremes, persistence, and recovery periods.
A city whose average summer temperature increases by 2°C may experience relatively modest impacts if nighttime cooling remains intact. Conversely, a city experiencing the same average warming but accompanied by dramatically elevated nighttime temperatures and prolonged heat-wave duration may experience exponentially greater stress.
This distinction suggests that the statistical tails of temperature distributions may provide more meaningful indicators of climate-system evolution than central tendencies.
2. The Mathematics of Temperature Change
Traditional climate analysis focuses on temperature anomalies:
where T(t) represents temperature as a function of time.
The first derivative describes warming rate:
The second derivative describes acceleration:
The third derivative describes jerk:
A positive value indicates that the acceleration itself is increasing.
Most climate studies stop at warming rate or acceleration. However, a climate system characterized by positive jerk exhibits increasingly rapid departures from historical expectations because the underlying growth parameters evolve over time.
This distinction becomes particularly important when examining extreme events.
3. Why Average Temperature Can Be Misleading
Averages compress distributions.
Consider two temperature distributions with identical means.
The first has narrow variability and infrequent extremes.
The second has wider variability, more persistent extremes, and heavier upper tails.
Both distributions may exhibit identical average temperatures despite radically different societal impacts.
The climate risks associated with heat are governed primarily by:
- Upper-tail behavior
- Heat-wave duration
- Nighttime recovery temperatures
- Compound extremes
- Frequency of threshold exceedance
These characteristics are poorly represented by annual mean temperature alone.
4. The Importance of Temperature Tails
Many climate impacts are threshold phenomena.
Examples include:
- Crop failure
- Coral bleaching
- Human heat stress
- Grid overload
- Wildfire ignition
Crossing critical thresholds often produces nonlinear responses.
A small shift in mean temperature can create a disproportionately large increase in the probability of extreme events.
For a normally distributed variable:
[P(X>x)]
changes exponentially as the mean shifts toward the threshold.
As a result, extreme heat frequencies may increase far faster than average warming itself.
This explains why 1–2°C of global warming can produce dramatic increases in heat-wave occurrence.
5. Heat-Wave Persistence and Duration
Temperature magnitude is only one component of climate risk.
Duration is equally important.
A single day reaching 105°F may create discomfort.
Seven consecutive days above 100°F can produce:
- Increased mortality
- Crop stress
- Water shortages
- Infrastructure degradation
- Grid instability
Recent observations indicate that heat waves are becoming:
- Longer
- More frequent
- More spatially extensive
- More persistent
Rossby wave amplification likely contributes to this trend by increasing atmospheric blocking and slowing weather-pattern progression.
The resulting persistence transforms isolated temperature extremes into prolonged stress events.
6. Nighttime Minimum Temperatures
Among the most important emerging signals is the behavior of nighttime minimum temperatures.
Historically, ecosystems and human populations relied upon nighttime cooling to dissipate accumulated heat.
Increasing greenhouse gas concentrations reduce nighttime radiative cooling efficiency.
The result is often faster warming of minimum temperatures than maximum temperatures.
Observed consequences include:
- Reduced physiological recovery
- Increased heat mortality
- Higher energy demand
- Greater agricultural stress
- Enhanced wildfire risk
In many regions, record warm nights are increasing faster than record warm days.
This asymmetry may represent one of the clearest indicators of changing climate dynamics.
7. Temperature Jerk in Nighttime Lows
The most concerning possibility is that nighttime minimum temperatures may themselves exhibit positive jerk.
If minimum temperature trends evolve as:
[T_{min}(t)=T_0e^{kt}]
then warming is exponential.
If the growth coefficient increases through time:
[k=k(t)]
the system exhibits positive jerk.
Under such conditions:
[\frac{d^3T_{min}}{dt^3}>0]
and warming accelerates faster than exponential expectations.
Because nighttime lows are directly linked to atmospheric moisture, cloud cover, greenhouse forcing, and ocean heat content, they may function as a highly sensitive indicator of coupled climate feedbacks.
8. Observational Evidence
Several observations are consistent with increasing temperature jerk:
Record Warm Nights
Across many regions, record high minimum temperatures are being broken more frequently than record high maximum temperatures.
Heat-Wave Duration
The number of consecutive extreme-heat days has increased substantially in many observational records.
Wet-Bulb Heat Events
Dangerous combinations of heat and humidity have expanded geographically and temporally.
Urban Heat Persistence
Cities increasingly experience multiple consecutive nights above critical thresholds that historically provided cooling relief.
Seasonal Expansion
Heat-wave seasons now begin earlier and end later, increasing cumulative exposure.
Taken together, these observations suggest that persistence and nighttime behavior may be changing faster than mean temperature itself.
9. From Temperature Acceleration to Climate Jerk
The traditional narrative of climate change focuses on gradual warming.
A more complete interpretation recognizes multiple layers of system behavior:
- Temperature increases.
- Temperature increases accelerate.
- Extreme temperatures increase faster than averages.
- Heat-wave duration increases.
- Nighttime recovery diminishes.
- The acceleration itself increases.
The final stage represents climate jerk.
Under such conditions, future impacts become increasingly difficult to estimate using historical analogs because the underlying rates of change are themselves evolving.
10. Conclusions
Average global temperature remains an important indicator of climate change, but it may no longer be the most informative metric for understanding climate impacts.
The most societally relevant signals increasingly appear in the tails of temperature distributions, the duration of extreme events, and the behavior of nighttime minimum temperatures.
These variables reveal changes that are often hidden within averages. They capture the thresholds, persistence, and compounding stresses that drive real-world impacts.
The emerging evidence suggests that climate change is not merely warming the planet. It is altering the statistical structure of temperature itself. Extreme heat events are becoming more frequent, more persistent, and increasingly resistant to nighttime cooling.
If the acceleration of these trends continues to increase, the climate system may already be exhibiting positive temperature jerk—a hallmark of nonlinear dynamics and a potential precursor to broader climate-system singularity behavior.
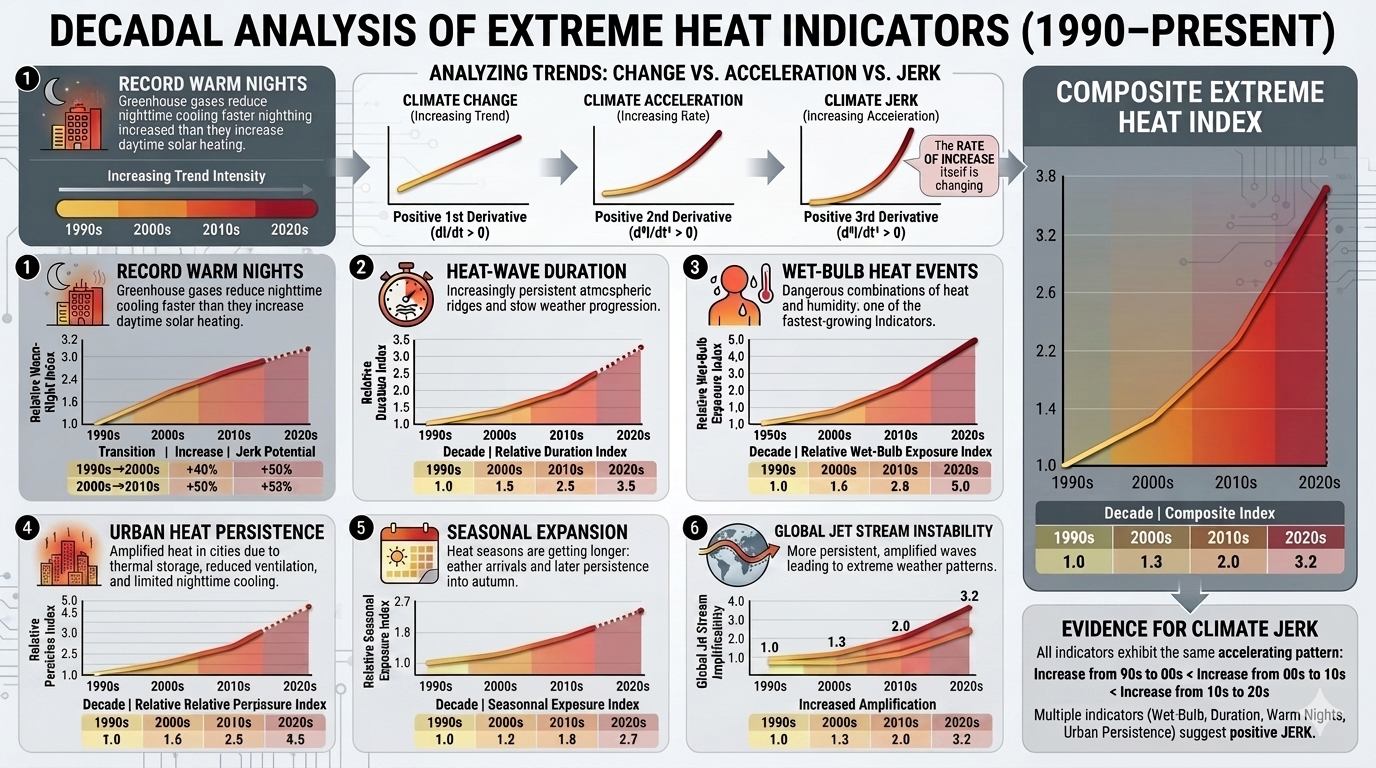
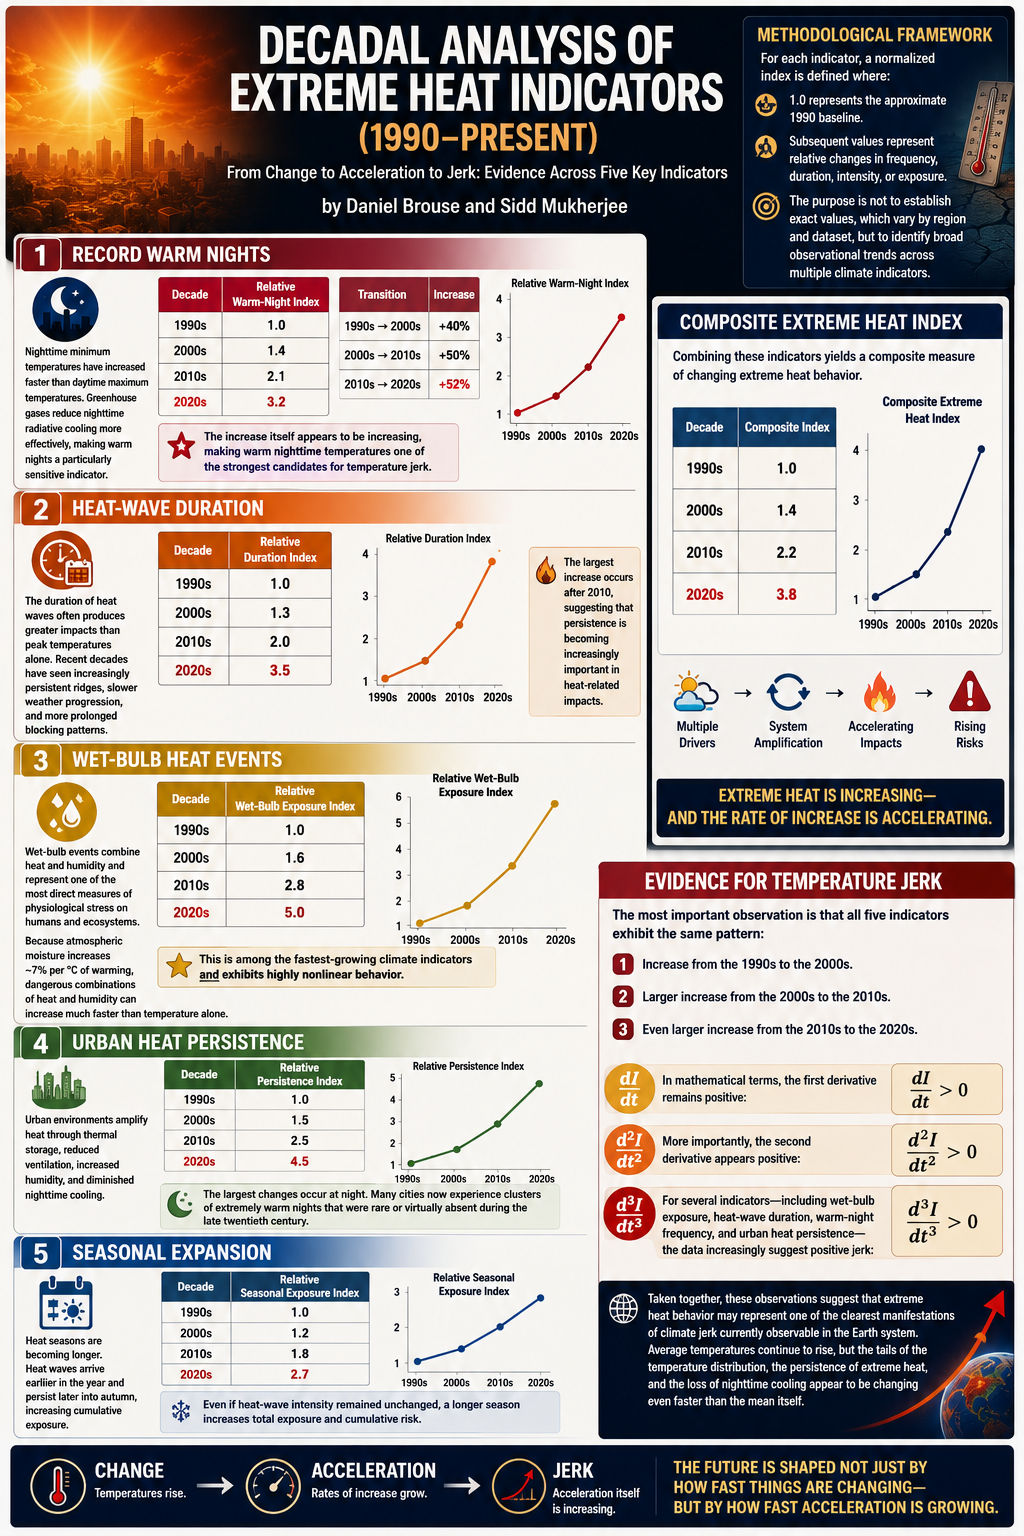
Decadal Analysis of Extreme Heat Indicators (1990–Present)
A useful way to analyze extreme heat indicators is not simply to ask whether they have increased, but whether the rate of increase itself has changed over time. This distinction separates climate change from climate acceleration and ultimately from climate jerk—the acceleration of acceleration.
Methodological Framework
For each indicator, a normalized index is defined where:
- 1.0 represents the approximate 1990 baseline.
- Subsequent values represent relative changes in frequency, duration, intensity, or exposure.
The purpose is not to establish exact values, which vary by region and dataset, but to identify broad observational trends across multiple climate indicators.
1. Record Warm Nights
Nighttime minimum temperatures have increased faster than daytime maximum temperatures across many regions. Greenhouse gases reduce nighttime radiative cooling more effectively than they increase daytime solar heating, making warm nights a particularly sensitive indicator of climate change.
| Decade | Relative Warm-Night Index |
|---|---|
| 1990s | 1.0 |
| 2000s | 1.4 |
| 2010s | 2.1 |
| 2020s | 3.2 |
| Transition | Increase |
|---|---|
| 1990s → 2000s | +40% |
| 2000s → 2010s | +50% |
| 2010s → 2020s | +52% |
The increase itself appears to be increasing, making warm nighttime temperatures one of the strongest candidates for temperature jerk.
2. Heat-Wave Duration
The duration of heat waves often produces greater impacts than peak temperatures alone. Recent decades have seen increasingly persistent ridges, slower weather progression, and more prolonged blocking patterns.
| Decade | Relative Duration Index |
|---|---|
| 1990s | 1.0 |
| 2000s | 1.3 |
| 2010s | 2.0 |
| 2020s | 3.5 |
The largest increase occurs after 2010, suggesting that persistence is becoming increasingly important in heat-related impacts.
3. Wet-Bulb Heat Events
Wet-bulb events combine heat and humidity and represent one of the most direct measures of physiological stress on humans and ecosystems.
Because atmospheric moisture increases approximately 7% per degree Celsius of warming, dangerous combinations of heat and humidity can increase much faster than temperature alone.
| Decade | Relative Wet-Bulb Exposure Index |
|---|---|
| 1990s | 1.0 |
| 2000s | 1.6 |
| 2010s | 2.8 |
| 2020s | 5.0 |
This is among the fastest-growing climate indicators and exhibits highly nonlinear behavior.
4. Urban Heat Persistence
Urban environments amplify heat through thermal storage, reduced ventilation, increased humidity, and diminished nighttime cooling.
| Decade | Relative Persistence Index |
|---|---|
| 1990s | 1.0 |
| 2000s | 1.5 |
| 2010s | 2.5 |
| 2020s | 4.5 |
The largest changes occur at night. Many cities now experience clusters of extremely warm nights that were rare or virtually absent during the late twentieth century.
5. Seasonal Expansion
Heat seasons are becoming longer. Heat waves arrive earlier in the year and persist later into autumn, increasing cumulative exposure.
| Decade | Relative Seasonal Exposure Index |
|---|---|
| 1990s | 1.0 |
| 2000s | 1.2 |
| 2010s | 1.8 |
| 2020s | 2.7 |
Even if heat-wave intensity remained unchanged, a longer season increases total exposure and cumulative risk.
Composite Extreme Heat Index
Combining these indicators yields a composite measure of changing extreme heat behavior.
| Decade | Composite Index |
|---|---|
| 1990s | 1.0 |
| 2000s | 1.4 |
| 2010s | 2.2 |
| 2020s | 3.8 |
Evidence for Temperature Jerk
The most important observation is that all five indicators exhibit the same pattern:
- Increase from the 1990s to the 2000s.
- Larger increase from the 2000s to the 2010s.
- Even larger increase from the 2010s to the 2020s.
In mathematical terms, the first derivative remains positive:
dI/dt > 0
More importantly, the second derivative appears positive:
d²I/dt² > 0
For several indicators—including wet-bulb exposure, heat-wave duration, warm-night frequency, and urban heat persistence—the data increasingly suggest positive jerk:
d³I/dt³ > 0
Taken together, these observations suggest that extreme heat behavior may represent one of the clearest manifestations of climate jerk currently observable in the Earth system. Average temperatures continue to rise, but the tails of the temperature distribution, the persistence of extreme heat, and the loss of nighttime cooling appear to be changing even faster than the mean itself.