bookmark_borderHow Is the Climate Energy Hitting You? — Central England

by Daniel Brouse and Rocky Rex

Central England is providing a very tangible demonstration of what climate energy looks like when it moves through a real landscape.

Not as an abstract temperature anomaly. Not as a number on a graph.

As heatwaves. Drought. Wildfires. Crop losses. Water restrictions. And then sudden, intense rainfall arriving on ground that has been baked hard by weeks of exceptional heat and dryness.

This is hydroclimatic whiplash: the rapid swing between one extreme hydrological condition and another.

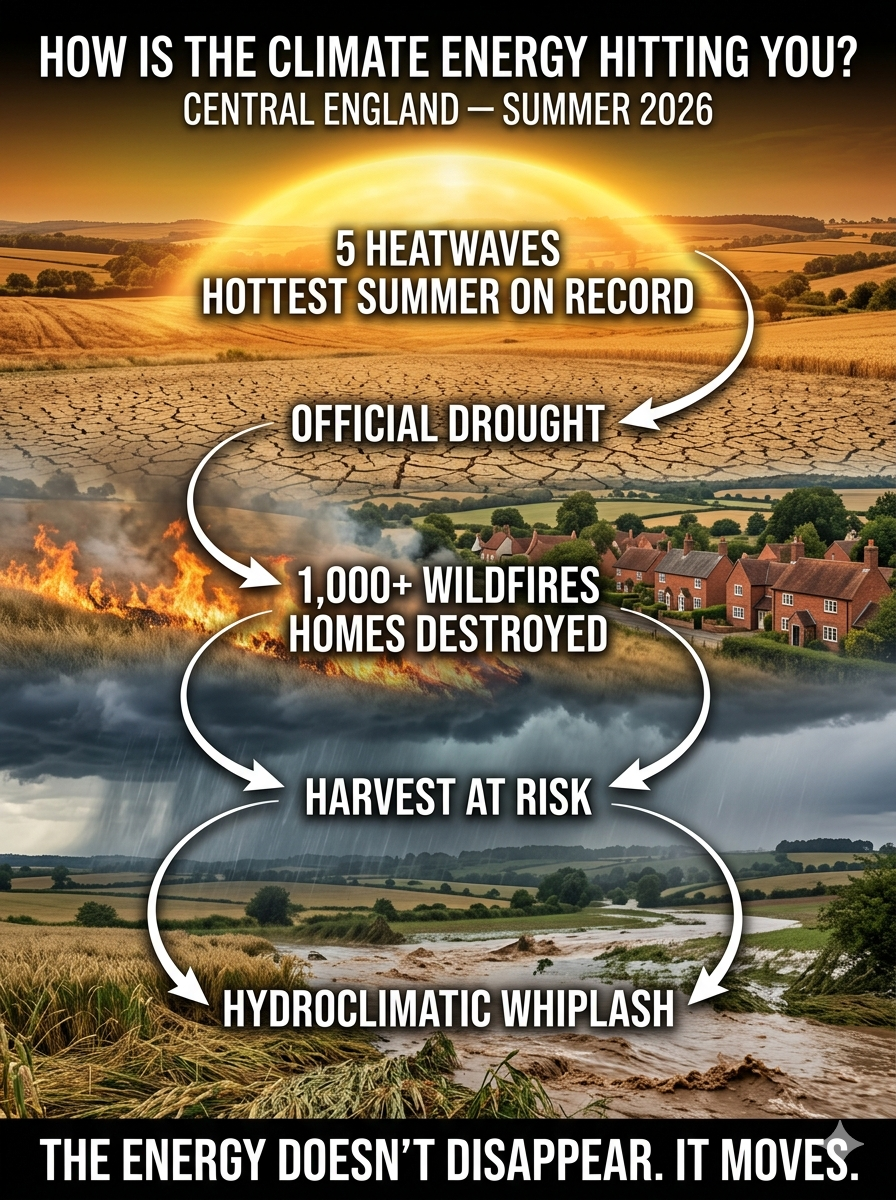
Five Heatwaves — and Counting

Summer 2026 has already delivered a remarkable sequence of heatwaves across the United Kingdom. By August, the country had experienced a fifth heatwave, with the latest episode producing temperatures above 38°C in parts of England. Fire chiefs described the conditions as a sustained and escalating wildfire risk.

The Met Office has indicated that 2026 is on course to become the UK’s hottest summer on record, with the outlook particularly strong for England and Wales.

This isn’t simply five isolated hot spells.

Repeated heatwaves mean the landscape has less opportunity to recover between events. Soil moisture is depleted. Vegetation dries out. Rivers and reservoirs fall. Crops reach critical developmental stages under heat stress. Livestock experience thermal stress. And every subsequent heatwave starts from a more vulnerable baseline.

The energy isn’t disappearing when the thermometer comes back down.

It has already been transferred into the land, atmosphere, vegetation, water system and human infrastructure.

Drought: The Landscape Runs Out of Water

On July 29, the UK government officially declared drought across seven areas of England, including large portions of central, eastern and southern England. The government described much of the region as experiencing “flash drought,” driven by exceptionally low rainfall combined with high temperatures. Rivers were running low, farmers were harvesting early, wildfire risk was increasing and millions of people were facing water restrictions.

The situation continued to deteriorate.

By August, more than two-thirds of England had entered drought conditions. Reservoir storage had fallen to 69% and was declining, while more than 27 million people were living under water restrictions.

Official data for August 7–13 showed England receiving only 6% of its long-term average rainfall for the month to that point. Reservoir storage had fallen to 65.9%, 13.8 percentage points below the long-term average, while five reservoirs were classified as exceptionally low.

That is what a drought looks like when climate energy works through the water cycle.

The problem isn’t merely that it hasn’t rained.

It is that extraordinary heat increases evaporation and atmospheric demand for moisture while rainfall fails to replenish the system.

Then Comes the Deluge

And this is where the story gets particularly interesting.

After weeks of heat and dryness, rainfall doesn’t necessarily mean the drought is over.

When soils become severely dried and hardened, intense rainfall can run across the surface rather than infiltrating efficiently. Heavy showers and thunderstorms can therefore produce flash flooding even while the broader region remains in drought.

That apparent contradiction is becoming increasingly important.

England can simultaneously experience:

Drought underground.

Flooding on the surface.

Low reservoirs.

Overflowing drains.

Dry vegetation.

Rapid runoff.

This is hydroclimatic whiplash.

Recent forecasts and observations have already raised concerns that heavy rainfall following the prolonged drought could generate surface-water flooding without providing enough sustained precipitation to restore depleted soil moisture, groundwater and reservoirs.

A few hours of intense rain is not equivalent to weeks or months of accumulated rainfall.

The water has to be absorbed, stored and retained.

If it arrives too quickly, much of it simply moves downstream.

Wildfire: When the Landscape Becomes Fuel

The drought has also transformed the wildfire environment.

By August 10, firefighters in England and Wales had already responded to 966 wildfires in 2026, including 185 during the first ten days of August alone. July was the busiest month on record for wildfire incidents.

By August 16, the number had reached 1,132 wildfires across the UK—already exceeding the entire 2025 total, with months of the fire season still remaining.

The government eventually issued a national emergency alert warning of a very high wildfire risk across England and Wales.

And this was no longer simply a countryside problem.

In Stourbridge in the West Midlands, a grass fire spread rapidly into residential areas. Nineteen homes were destroyed and another 18 were damaged. Nearly 40 properties were affected.

The lesson is brutally simple:

When the countryside becomes tinder-dry, the boundary between wildfire and urban fire can disappear remarkably quickly.

Agriculture Takes the Hit

Perhaps the most consequential impact will not be visible in the flames.

It will be visible in the harvest.

The Energy and Climate Intelligence Unit’s August analysis found that the 2026 UK arable harvest was on track to become the worst on record. Initial yield estimates were already below the 10-year average for wheat, spring barley and oats.

Then the forecast deteriorated further.

Updated figures released August 14 put UK arable production at just 18.5 million tonnes, below the previous estimate of 19.5 million tonnes and approximately 1.35 million tonnes below the previous record-low harvest in 2020. ECIU estimated that the 2026 harvest could therefore become the smallest on record.

This is what happens when climate energy arrives at the wrong time.

Heat during crop development.

Drought during critical growth periods.

Accelerated maturation.

Reduced soil moisture.

Poor grass growth.

Heat-stressed livestock.

And then, potentially, heavy rainfall arriving after crops have already suffered.

The damage is not necessarily one spectacular event.

It is the accumulation of energy transfers occurring faster than agricultural systems can adapt.

The Climate Energy Doesn’t Disappear

This is the part of the story I think we frequently miss.

When the heatwave ends, we tend to assume the problem has ended.

It hasn’t.

The energy has moved.

Heat increases evaporation.

Evaporation removes water from soils and vegetation.

Dry vegetation becomes fuel.

Drought lowers river flows and reservoirs.

Wildfires transfer enormous amounts of energy into the atmosphere and destroy ecosystems and property.

Then storms can transfer atmospheric moisture into intense rainfall.

That rainfall can become runoff and flooding rather than useful groundwater recharge.

The system keeps moving.

One extreme can help create the conditions for the next.

Heat → drying → drought → wildfire → atmospheric instability → intense rainfall → runoff and flooding.

And then the cycle begins again.

Central England Is the Demonstration

Central England is not experiencing one climate problem.

It is experiencing a cascade.

Five heatwaves.

Official drought.

Record-low rainfall.

Depleted water resources.

Extreme wildfire conditions.

Homes destroyed.

Agricultural losses.

And now the possibility of intense rainfall and flash flooding arriving before the underlying drought has been repaired.

That is the important distinction.

Climate change isn’t simply about making today’s weather “hotter.”

It is about changing the amount of energy available to the climate system and altering how quickly that energy can move between the atmosphere, land, water and living systems.

The result can be greater volatility.

Longer extremes.

More rapid transitions.

And increasingly destructive combinations of events.

Central England is showing us what that looks like.

The question isn’t whether the climate energy is hitting us.

It is.

The question is:

Where does it go next?

And what happens when the next transfer arrives before the system has recovered from the last one?
→ The Hitchhiker’s Guide to Climate Change

bookmark_borderSea-Level Rise: Rubbing Salt in the Wound

by Daniel Brouse and Sidd Mukherjee

How Is Climate Energy Hitting You?

The Jersey Shore Is Sure

Sea-Level Rise: Rubbing Salt in the Wound

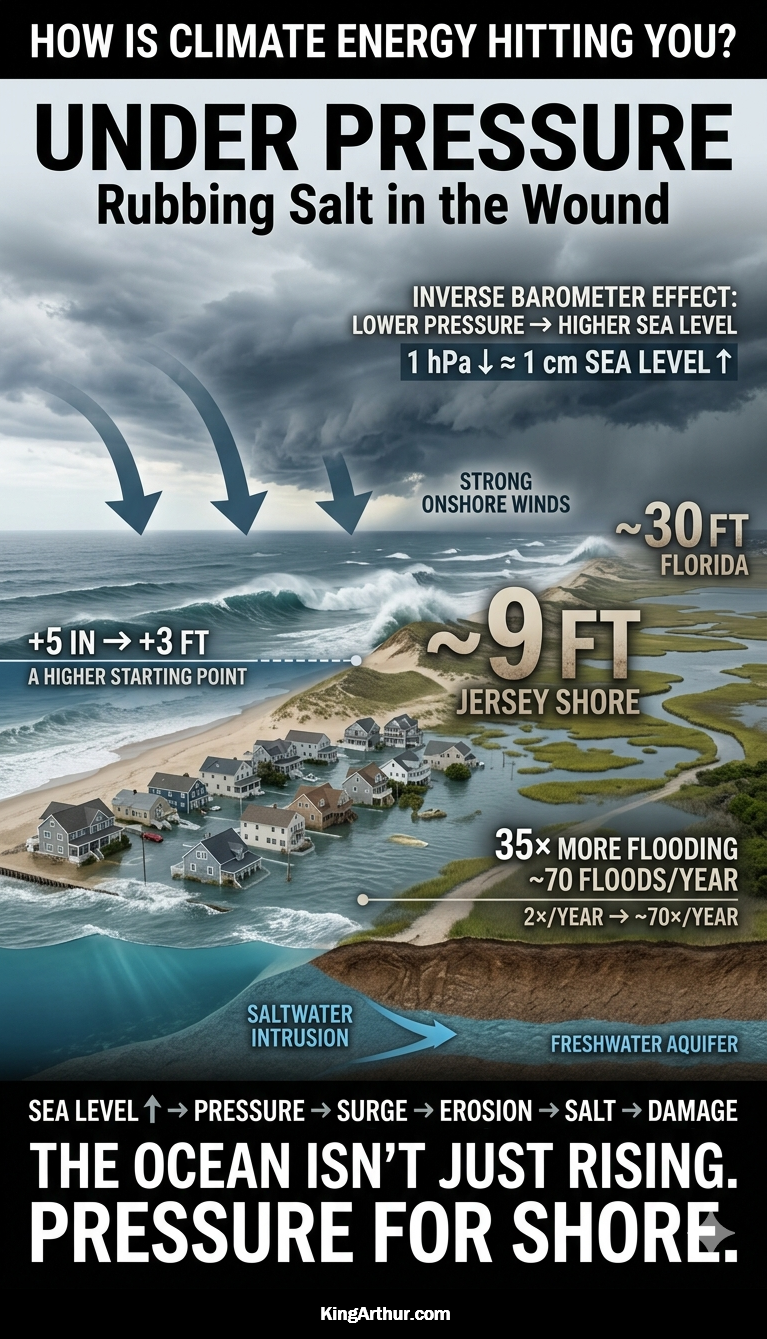
Sea-level rise is not simply a matter of the ocean getting higher. Climate change is altering the physical forces that move water toward and onto the shoreline. Rising seas, changing atmospheric pressure, stronger winds, altered ocean circulation, storm surge, king tides, and saltwater intrusion can interact to turn gradual sea-level rise into a much more immediate coastal threat.

A Real-World Warning: The Wetlands Institute

The experience of The Wetlands Institute in Stone Harbor, New Jersey, provides a striking example of how quickly coastal conditions can change.

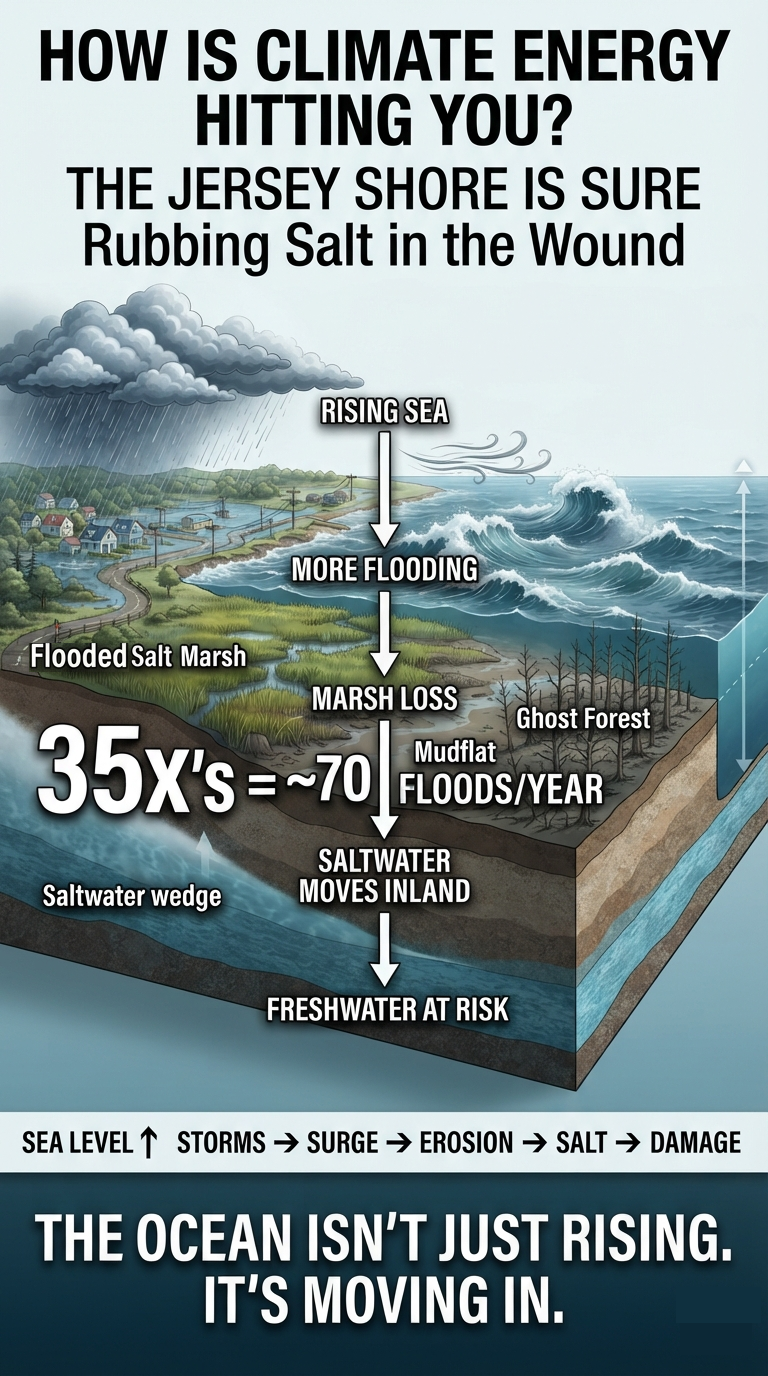
The institute’s Salt Marsh Trail reportedly flooded only a few times a year around 2000. Over the past five years, flooding has averaged nearly 70 times annually. The institute is closing its headquarters on September 7, 2026, to begin a major coastal-resilience transformation.

The response includes raising the Salt Marsh Trail by two to three feet using clean dredged material, temporarily relocating operations and educational programs, and pursuing a broader campaign to replace and elevate the existing campus buildings.

This is more than an inconvenience. Increasingly frequent inundation can fundamentally alter the coastal ecosystem itself.

The Climate Shift

  • Accelerated sea-level rise: Sea levels along parts of the New Jersey coast are rising faster than the global average.
  • Marsh degradation: Repeated inundation can overwhelm salt-marsh vegetation, converting productive marsh into mudflats and eventually open water.
  • Wildlife disruption: More frequent flooding threatens habitats used by marsh-dependent birds and can interfere with diamondback terrapin nesting.
  • Infrastructure exposure: Roads, buildings, trails, drainage systems, and utilities face increasingly frequent flooding even without a major storm.

The critical point is that the climate signal is not experienced as a smooth, uniform rise in water level. It is experienced as more frequent encounters with water.


1. The Inverse Barometer Effect: Atmospheric Pressure Pushes the Ocean

Atmospheric pressure exerts physical force on the ocean surface. When a deep low-pressure system moves over the coast, the reduced atmospheric weight allows the ocean surface to rise.

The approximate relationship is:

A 1-hectopascal (hPa) decrease in atmospheric pressure produces roughly a 1-centimeter rise in sea level.

A very deep storm can therefore raise the local ocean surface substantially before the effects of wind-driven storm surge are even considered.

This is known as the inverse barometer effect.

Climate change does not simply “raise the sea.” It can alter the atmospheric conditions that determine how that elevated ocean is distributed along the coastline at any particular moment.

Inverse Barometer Effect Examples

Storm typeApprox. pressure near coastPressure drop from 1013 hPaInverse-barometer rise
Ordinary coastal storm990–1000 hPa13–23 hPa5–9 in
Strong nor’easter970–985 hPa28–43 hPa11–17 in
Very strong coastal storm950–965 hPa48–63 hPa19–25 in
Sandy-type extreme~945 hPa~68 hPa~27 in / 2.2 ft
Exceptional low-pressure event930–940 hPa73–83 hPa29–33 in / 2.4–2.8 ft

The Combined Impact

The inverse barometer effect combines with wind stress, coastline shape, bathymetry, wave setup, tides, and storm track can produce much larger water-level changes. Hurricane Sandy’s actual coastal water levels were dramatically higher because the pressure effect was combined with enormous wind-driven surge, wave action, tide, and the storm’s exceptionally favorable track. At Sandy Hook, water reached about 8.9 feet above ground level, while the storm produced major surge throughout the central and northern Jersey Shore.

An additional 5 inches to 3 feet of sea-level rise represents a new baseline of climate energy impacting coastal communities. The inverse barometer effect then combines with wind stress, coastline shape, bathymetry, wave setup, tides, and storm track to produce much larger water-level changes. The result can be extreme coastal flooding, with observed water levels reaching roughly 9 feet above ground level along parts of the Jersey Shore and as much as 30 feet in parts of Florida during major storms.


2. Wind and Wave Energy: Turning Pressure Gradients Into Coastal Damage

Atmospheric pressure gradients—the differences between areas of high and low pressure—drive winds.

When those gradients become stronger, winds can become stronger and more persistent. Strong winds transfer energy to the ocean, generating larger waves and increasing wind setup, the piling of water against the coast.

The consequences can include:

  • Higher water levels along exposed shorelines
  • Larger and more destructive waves
  • Increased dune erosion
  • Offshore transport of beach sand
  • Overtopping of coastal defenses
  • Greater storm-surge penetration

The shoreline therefore experiences not only a higher baseline sea level but also increasingly energetic ways of moving that water around.


3. Altered Ocean Circulation: When Water Piles Up

Changes in large-scale atmospheric circulation can alter ocean currents and regional sea levels.

The relationship between the Gulf Stream, the North Atlantic circulation, winds, and coastal sea level is particularly important along the U.S. East Coast. Changes in ocean circulation can redistribute enormous volumes of water, producing dynamic sea-level changes that may differ substantially from the global average.

In simplified terms, when ocean circulation changes, water can accumulate against a coastline rather than being transported away from it.

That means a community can experience a rapid increase in local relative sea level even when the global mean is changing much more slowly.


4. Compound Coastal Flooding: When Everything Arrives Together

The most dangerous coastal flooding occurs when multiple processes reinforce one another.

Imagine a high tide occurring while:

  • Global sea level is already elevated.
  • A low-pressure storm raises the ocean through the inverse barometer effect.
  • Strong onshore winds push additional water toward land.
  • Large waves increase water levels and erode dunes.
  • Heavy rainfall overwhelms drainage systems.
  • Rivers are already elevated and cannot discharge efficiently.

These processes can combine into compound flooding.

The problem is not simply that the water is higher. The problem is that multiple pathways for moving water onto the land are operating simultaneously.

Salt marshes normally provide a natural buffer. But repeated inundation and erosion can eventually overwhelm the marsh itself. Once protective wetlands deteriorate, more wave energy reaches infrastructure, creating a feedback loop of increasing exposure and increasing damage.


Saltwater Intrusion: When the Ocean Moves Underground

Sea-level rise has another consequence that is much less visible than coastal flooding: saltwater intrusion.

Saltwater intrusion occurs when seawater moves into freshwater systems, including groundwater aquifers, rivers, wetlands, agricultural soils, and drinking-water supplies.

Two forces are especially important:

  1. Rising sea level increases the hydraulic pressure and inland reach of seawater.
  2. Drought and reduced groundwater recharge weaken the freshwater pressure pushing outward toward the sea.

Together, these forces can shift the boundary between freshwater and saltwater inland.

Research has projected that saltwater contamination could affect a very large proportion of coastal aquifers by 2100, although the extent varies substantially by geography, aquifer characteristics, groundwater use, and future climate conditions.


How the Saltwater Wedge Moves Inland

Under normal conditions, rainfall replenishes groundwater. Freshwater flows toward the coast and maintains a hydraulic gradient that helps resist seawater intrusion.

Because freshwater is less dense than seawater, a freshwater lens can exist above denser saltwater beneath coastal areas.

But the balance can shift.

1. Underground Aquifer Intrusion

As sea level rises, the hydraulic pressure exerted by seawater increases. At the same time, climate-driven drought and higher temperatures can reduce groundwater recharge in some regions.

Less freshwater flowing toward the ocean means less outward pressure resisting seawater.

The underground saltwater boundary can therefore migrate inland.

This process can occur largely out of sight until a well begins producing water with elevated salinity.

2. Surface and Vertical Infiltration

Storm surge, king tides, and coastal flooding can push seawater onto land.

If that water remains on the surface, it can infiltrate downward through soils and shallow geological formations, contaminating groundwater.

Repeated flooding is especially important because a single event may be temporary, while dozens of inundation events each year can progressively alter soil and groundwater chemistry.

3. The “Highway Effect”

Human modifications to coastal landscapes can provide pathways for seawater to travel inland.

Agricultural drainage ditches, shipping channels, tidal creeks, canals, and other engineered waterways can connect coastal waters with areas that were historically protected by natural terrain.

When sea level rises or storm surge moves inland, these channels can function as highways for saltwater.


The Ecological and Economic Consequences

Saltwater intrusion does not stop at the shoreline.

Ghost Forests

As saltwater enters coastal soils and groundwater, freshwater-dependent trees can die from prolonged salt stress. The result can be stands of dead trees known as ghost forests.

These landscapes provide visible evidence that the boundary between marine and terrestrial ecosystems is moving inland.

Agricultural Damage

Salt deposited on agricultural land can accumulate in the root zone.

Excessive soil salinity interferes with plants’ ability to absorb water and can reduce crop productivity. Persistent salinization can make valuable coastal farmland increasingly difficult—or eventually impossible—to farm without expensive remediation and freshwater management.

Infrastructure Corrosion

Saltwater and brackish groundwater are highly corrosive.

Repeated exposure can accelerate deterioration of underground pipes, electrical infrastructure, concrete, foundations, roads, and other infrastructure.

The damage can occur beneath the surface long before it becomes visually obvious.

Drinking-Water Threats

Coastal communities that depend on groundwater face a particularly serious vulnerability.

Pumping already lowers groundwater levels around wells. If the freshwater table is lowered too far, the hydraulic gradient resisting seawater intrusion weakens further.

This can create another feedback:

More pumping → lower freshwater pressure → greater saltwater intrusion → less usable freshwater.


The Larger Picture: Climate Energy Does Not Disappear

Sea-level rise is one expression of a much larger physical process.

The additional energy accumulating in the climate system does not simply produce a higher average temperature. Energy moves through the atmosphere, ocean, land, ice, and biosphere.

Along the coast, that energy can appear as:

Higher baseline sea level → more frequent tidal flooding → stronger storm impacts → erosion → wetland loss → saltwater intrusion → infrastructure damage → freshwater stress.

The critical distinction is between average conditions and actual events.

A few inches of average sea-level rise may sound modest. But those inches can determine whether a high tide remains below a road or flows across it. They can determine whether a storm surge is absorbed by a functioning marsh or reaches buildings and infrastructure.

The climate system does not deliver its additional energy evenly.

It delivers it through water, wind, waves, heat, storms, erosion, flooding, and ecological disruption.

And along the coast, the ocean is increasingly finding more ways to come ashore—and stay there.

bookmark_borderHow Is the Climate Energy Hitting You?

by Daniel Brouse

What I Did on My Summer Vacation

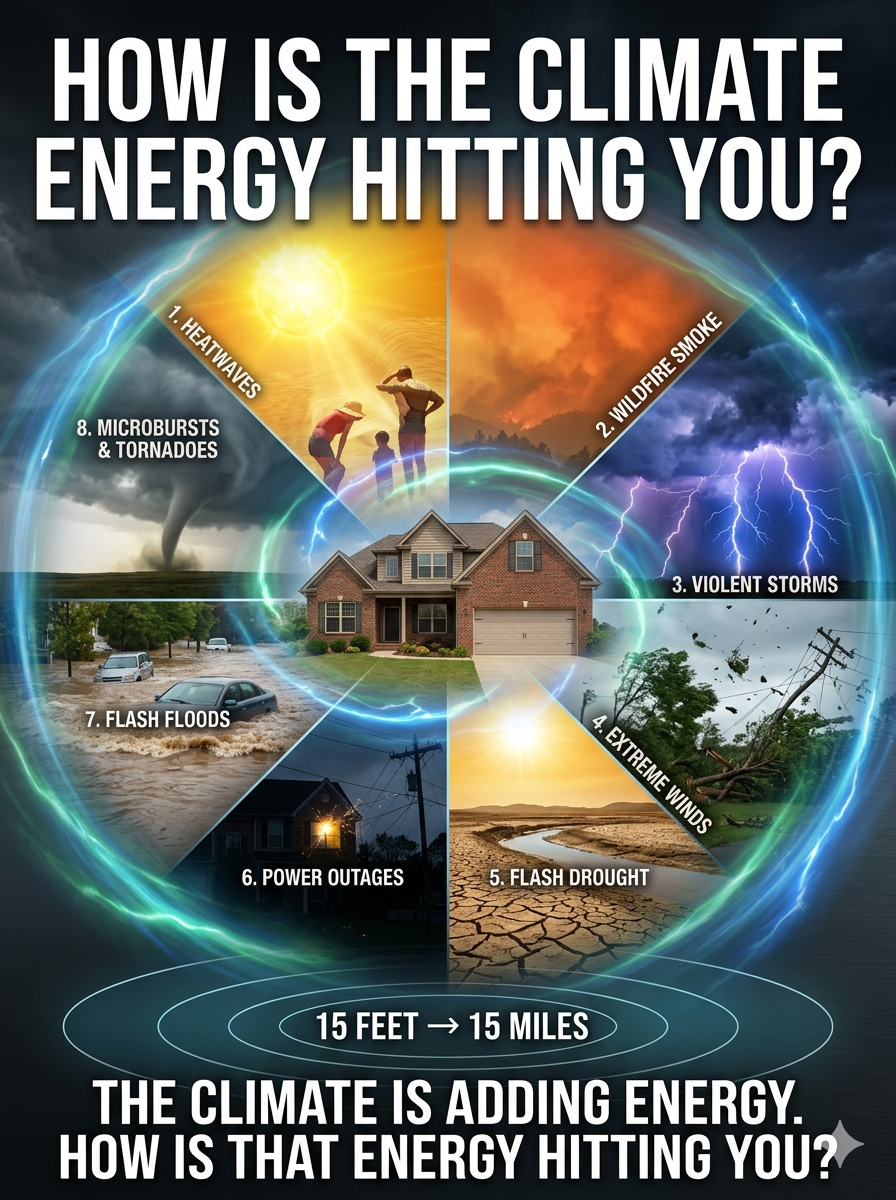
I thought it might be a fun experiment to see how the extreme weather fueled by climate change is impacting you—and me.

I’ll start with “What I Did on My Summer Vacation.”

Within 15 feet of my backdoor, we’ve experienced more violent storms than ever. Events that used to happen once every thirty years seem to be happening right now.

The violent storms at my house have produced only about three inches of rain in total. But a couple of times, when the rain became truly extreme, it was giant p = mv pain rain. Thank the god of physics for friction and wind resistance—or we all might have been dead.

But the rain was the least of it.

The winds and lightning have been even more extreme. Winds have taken down branches and sections of trees on an almost daily basis, creating an unusual amount of chainsaw work for me. Lightning has been nearly daily as well.

We’ve had more power outages in these three months than we normally experience in a dozen years. Fortunately, the local infrastructure was upgraded recently, so most outages have been brief. New technology allows the utility to install breakers along the lines, helping isolate problems and restore power more quickly.

But that has presented a new problem: power surges.

Lights flicker, breakers trip, and electronic equipment gets hit with sudden changes in voltage. I hadn’t really considered surge protection for something as mundane as my room lighting. Now I do.

Another new extreme has been the flash drought.

Even with all these thunderstorms, the new climate atmosphere seems capable of sucking water out of everything—the soil, the plants, even the pool—within days, sometimes within a day, and occasionally within hours.

Overall, it has been one of the worst years for my home garden.

Oh, I almost forgot.

There were six heatwaves.

And then there were the days when the wildfire smoke made the air practically unbreathable. The smoke wasn’t coming from a fire in my backyard, but the atmosphere doesn’t care much about property lines. Wildfires hundreds or thousands of miles away can turn the local air quality into a serious problem.

And this is just what has happened within 15 feet of my backdoor.

For the next installment of this show-and-tell, I’ll expand the circle to the more exciting energy events that have occurred within 15 miles of my house: microbursts and straight-line winds powerful enough to collapse buildings, furious flash floods in town after town, and, of course, tornadoes.

The point isn’t that every storm, heatwave, drought, or wildfire is caused by climate change.

It isn’t.

The point is that the climate system is changing the amount of energy and moisture available to extreme events—and we are increasingly experiencing what that extra energy can do.

So here’s my question:

How is the climate energy hitting you?

bookmark_borderTaking the Temperature of Climate Change

by Daniel Brouse and Sidd Mukherjee

Bend Over

Much of the world is focused on 1.5°C.

One reason the public has become so focused on this number is its simplicity. A 1.5°C (2.7°F) increase sounds like a straightforward, easily understood concept. It also doesn’t sound particularly frightening. After all, what’s the big deal about a couple of degrees of warming? Some people even portray it as potentially beneficial.

Scientists take a very different view.

There are many ways to look at climate change. At the micro level, millions of individual feedbacks are operating throughout the Earth system—between the atmosphere, oceans, ice, land, ecosystems, and human systems. At the macro level, all of those interactions combine to form a single, interconnected climate system.

The critical question is not simply how much the planet warms, but what happens as warming changes the system itself.

Understanding how these feedbacks interact—and, more importantly, how they amplify one another—is at the bleeding edge of climate science. The climate system is not a simple thermostat in which each additional degree produces a proportionally larger but otherwise predictable effect. It is a complex, nonlinear system capable of crossing thresholds and shifting into fundamentally different states.

That is why 1.5°C matters.

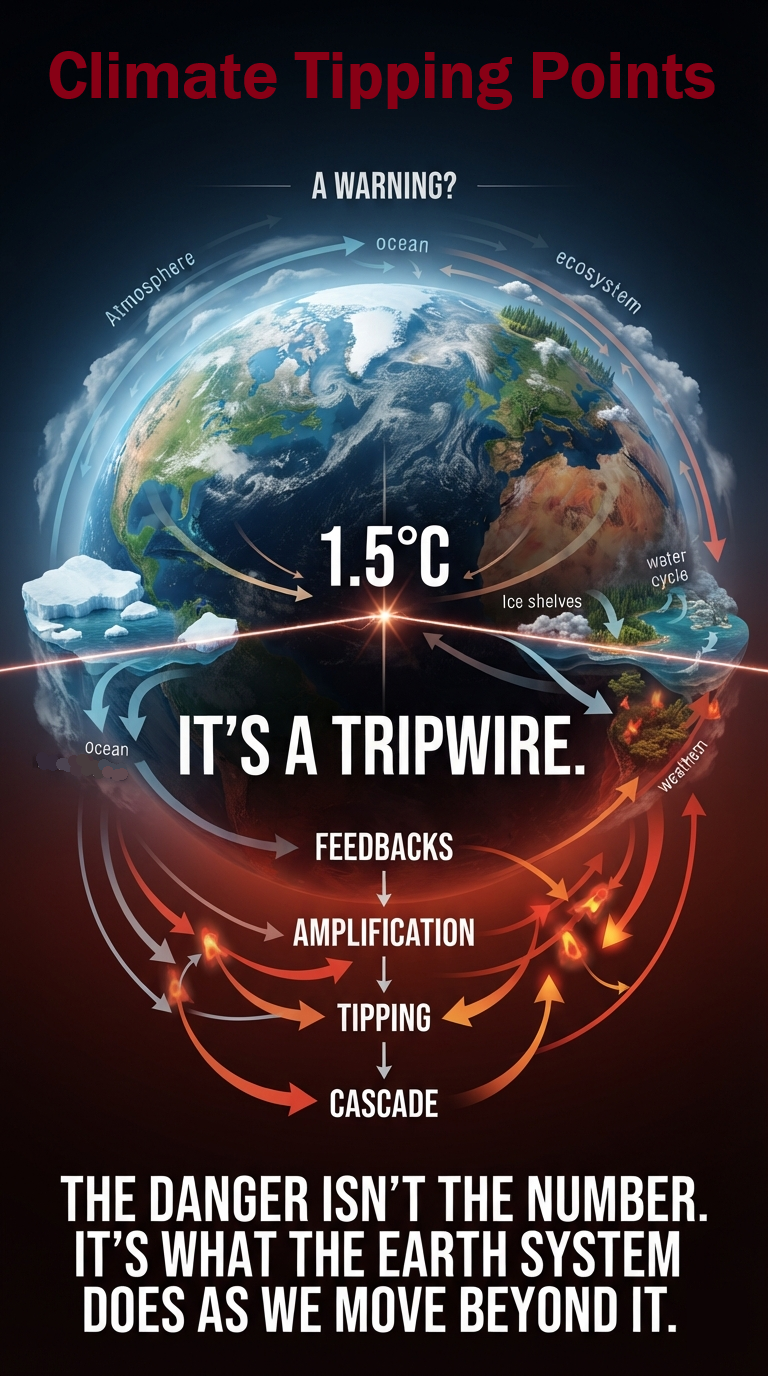
The 1.5°C threshold identified in the Paris Agreement—and the roughly 2°C level generally regarded as an even more dangerous boundary—is not important because the difference between 1.4°C and 1.5°C is somehow magical. These numbers matter because increasing global temperatures raise the probability of triggering major climate tipping points.

And once tipping points begin to activate, the question of whether warming ultimately reaches 2°C, 3°C, or even 4–7°C becomes much less relevant for two fundamental reasons:

First, tipping points can initiate self-reinforcing feedbacks that continue driving change even after the original forcing changes.

Second, the impacts do not necessarily increase gradually with temperature. They can accelerate, compound, and cascade as interconnected systems begin to destabilize.

In other words, 1.5°C is not a destination. It is not merely a warning sign or an alarm. It is a tripwire.

A warning sign tells you that danger is ahead. An alarm tells you that danger may already be present. A tripwire is different: it marks a threshold at which crossing the line can trigger a chain of events that becomes increasingly difficult to control or reverse.

That is the critical distinction that can be lost when climate change is reduced to a single temperature number.

The real danger lies not in the number itself, but in what the Earth system is doing as we move beyond it.

We are not simply adding another fraction of a degree to a static planet. We are increasing the energy entering a dynamic, interconnected system—and that additional energy is altering the very processes that determine how the system responds.

The question, therefore, is not simply, “How many degrees warmer will Earth become?”

The more important question is:

“What happens as we cross the tripwires?”

1. The Ocean Holds Most of the Energy Imbalance

The ocean holds most of the excess energy accumulating in the climate system. A deep-ocean study has revealed that even the deepest layers of the ocean are warming at a measurable rate.

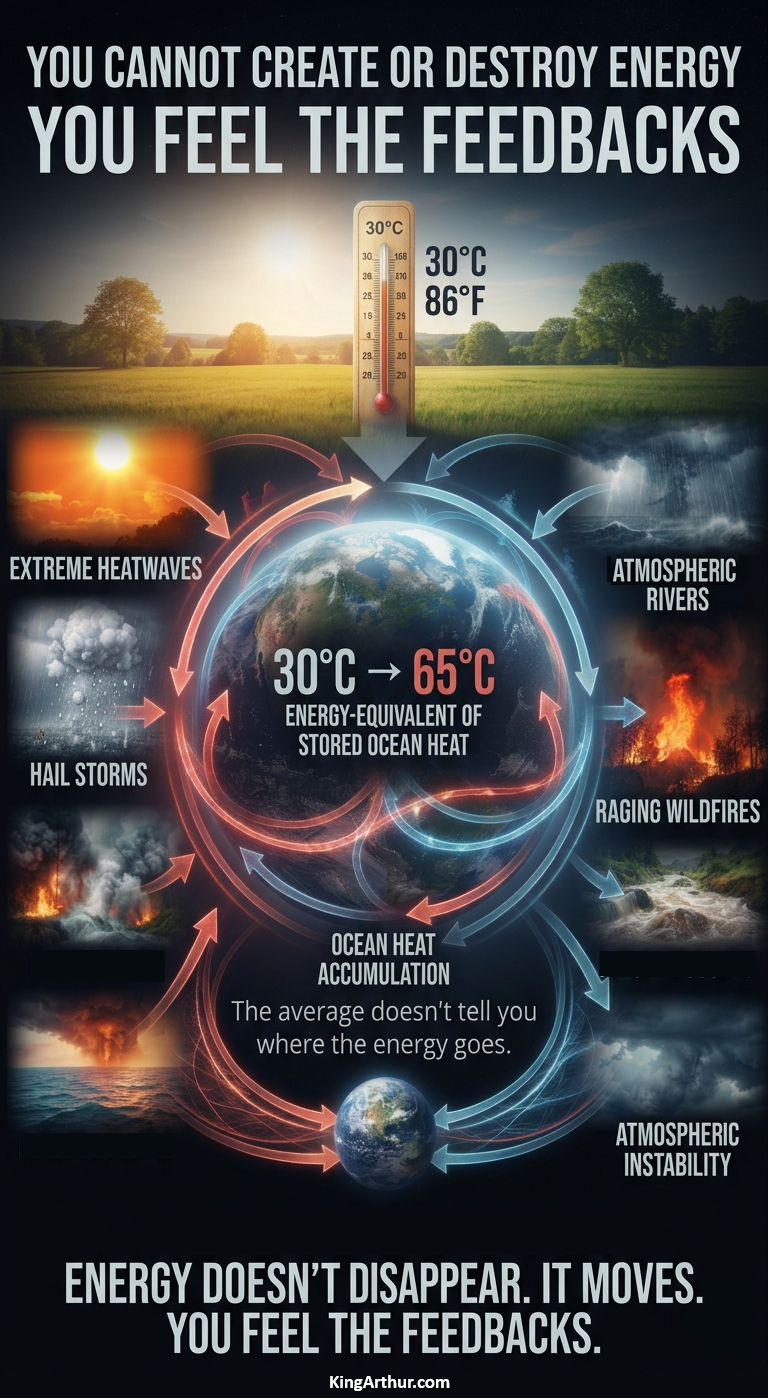
The oceans absorb and store more than 90% of the excess heat trapped by greenhouse gases. In 2025, a tiny increase—one-tenth of a degree—was observed. That seemingly insignificant change represents an enormous amount of additional stored thermal energy. This represents an amount of stored thermal energy roughly equivalent to a 2°C increase in the atmosphere and surface system.

If the accumulated ocean heat were distributed across land surfaces, it would equate to an estimated 35°C increase in land temperatures—a level that would make much of the planet uninhabitable.

This illustrates how the oceans have been masking the full extent of the Earth’s energy imbalance, acting as a temporary thermal buffer while simultaneously undergoing changes of their own, including increased stratification, circulation changes, and ecosystem disruption.

The entire Pacific Ocean is running approximately 1.6°C above its long-term average—roughly six standard deviations above the mean. In climate science, deviations of this magnitude are virtually off the charts, underscoring just how far outside what we would consider normal variability the climate system has moved.

2. Tipping Points Take Over the Coupling and Acceleration

Tipping points can fundamentally change how the climate system responds by coupling positive and negative feedbacks across multiple components of the Earth system.

The overriding concern for humanity should not simply be the average surface temperature. It should be how the millions of interconnected feedbacks within the climate system will respond.

We have a pretty good understanding of some of these feedbacks. For many others, we don’t.

One of the simplest examples is the albedo effect.

The physics of albedo is straightforward: bright, reflective surfaces send a portion of incoming solar energy back into space, while darker surfaces absorb more of it. Less ice means more exposed dark surfaces, more absorbed energy, and therefore more warming.

But the system quickly becomes much more complicated.

How does changing albedo affect cloud formation, particularly over the tropics? And what happens to the climate if those clouds increase—or decrease?

Low clouds are especially important because they can reflect substantial amounts of incoming sunlight back into space. If tropical low clouds diminish, the ocean could absorb significantly more solar energy, accelerating warming.

This is where the bleeding edge of climate science begins.

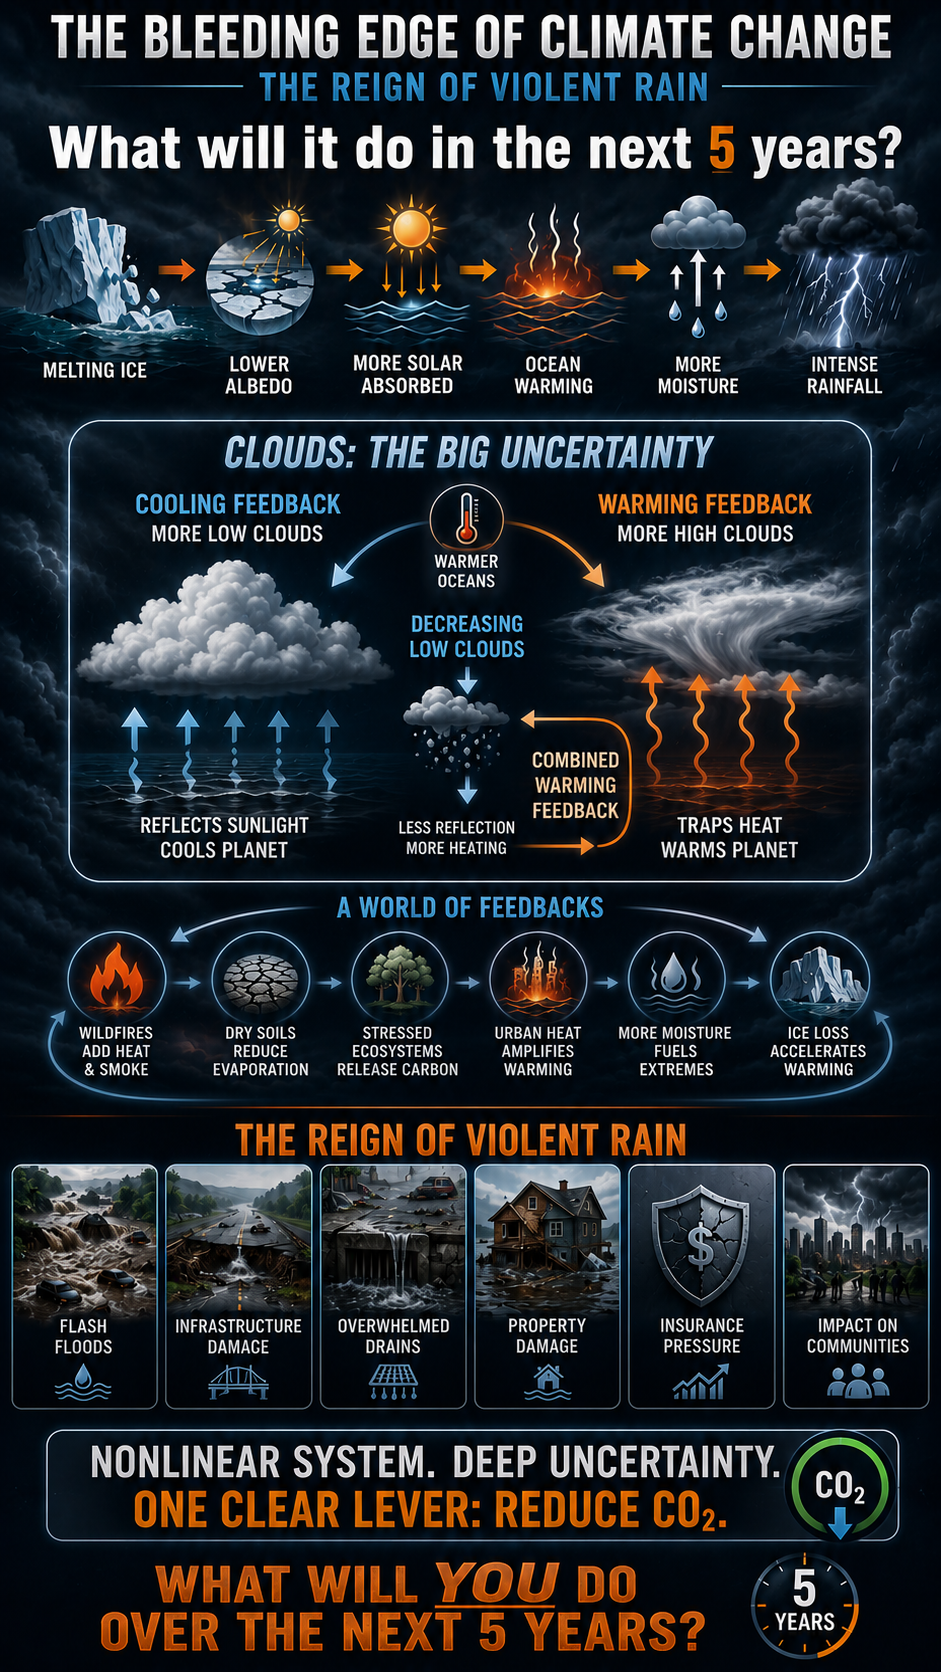
Clouds are arguably the largest remaining uncertainty in our understanding of climate sensitivity. They can reflect incoming solar radiation, producing a cooling effect, while high, thin clouds can allow incoming sunlight through while trapping outgoing heat.

Which effect dominates—and how that balance changes as the planet warms—is one of the great unanswered questions in climate science.

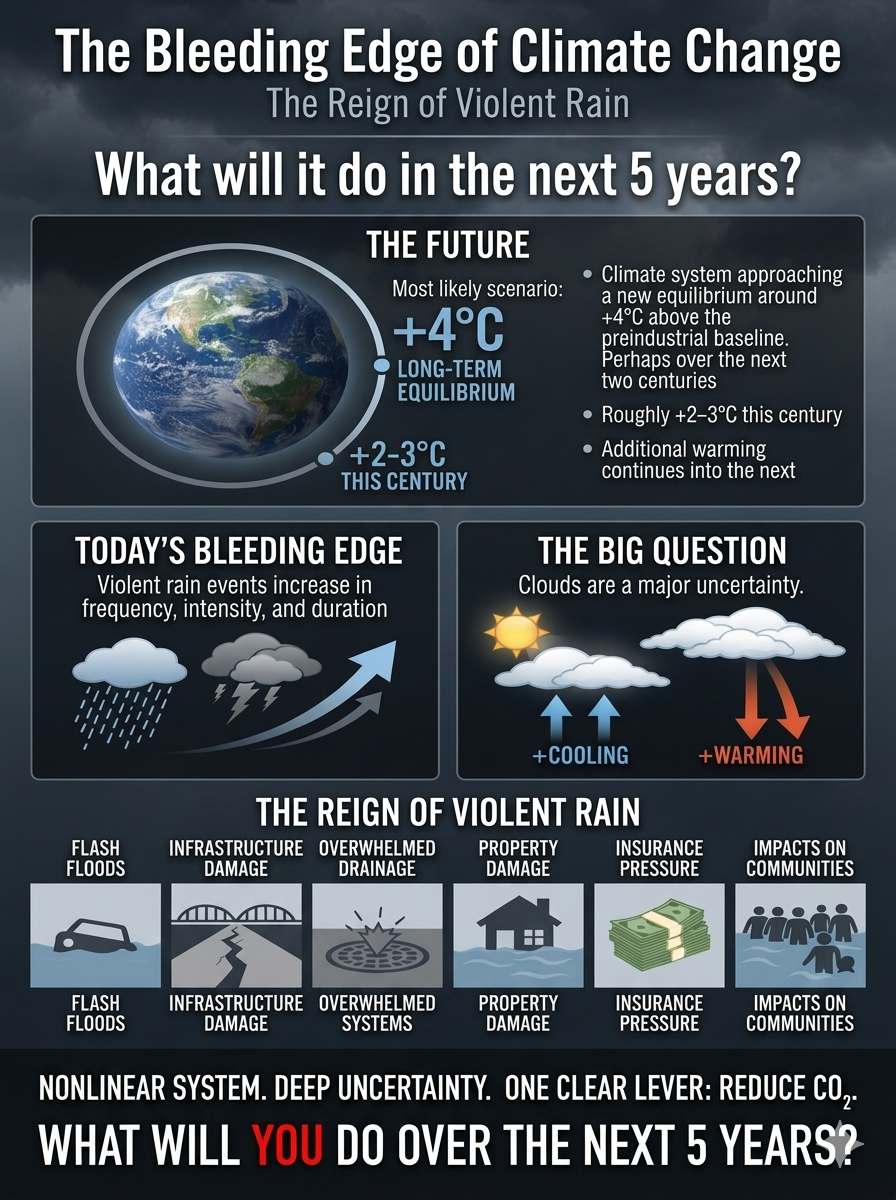
Our expectation is that the climate system could eventually approach a new equilibrium around +4°C above the preindustrial baseline, perhaps over the course of a couple of centuries. That would imply roughly +2–3°C this century, with additional warming continuing into the next.

The important point is that climate change is not a simple linear equation.

It is a massively interconnected system in which a change in one component can alter another, which then feeds back into the first.

Ice affects albedo. Albedo affects heating. Heating affects clouds. Clouds affect radiation. Radiation affects ocean temperatures. Ocean temperatures affect evaporation and atmospheric moisture. And the cycle continues.

Conclusion

What matters most for human habitability is not simply the temperature we measure at the surface. It is the amount of energy remaining in the climate system and how that energy is redistributed.

If the temperature “only” rises 2°C while energy accumulation continues, the surface temperature becomes much less informative by itself. What becomes increasingly urgent is how that additional energy—measured in joules—is redistributed to your location.

The most obvious example is the supercharged water cycle.

For every 1°C increase in temperature, air can hold approximately 7% more water vapor. The atmosphere doesn’t care about the global average temperature. Many places can experience temperatures 10°C above their local average. That creates the potential for dramatically greater atmospheric moisture and, consequently, more intense rain, hail, and snow events when that moisture is released.

And indeed, we are seeing extreme flood events occurring with increasing frequency, including events described as having return periods of hundreds of years. Hail has also become one of the largest sources of insurance claims affecting homes, automobiles, and agriculture.

While the long-term equilibrium matters, there is a much more immediate question.

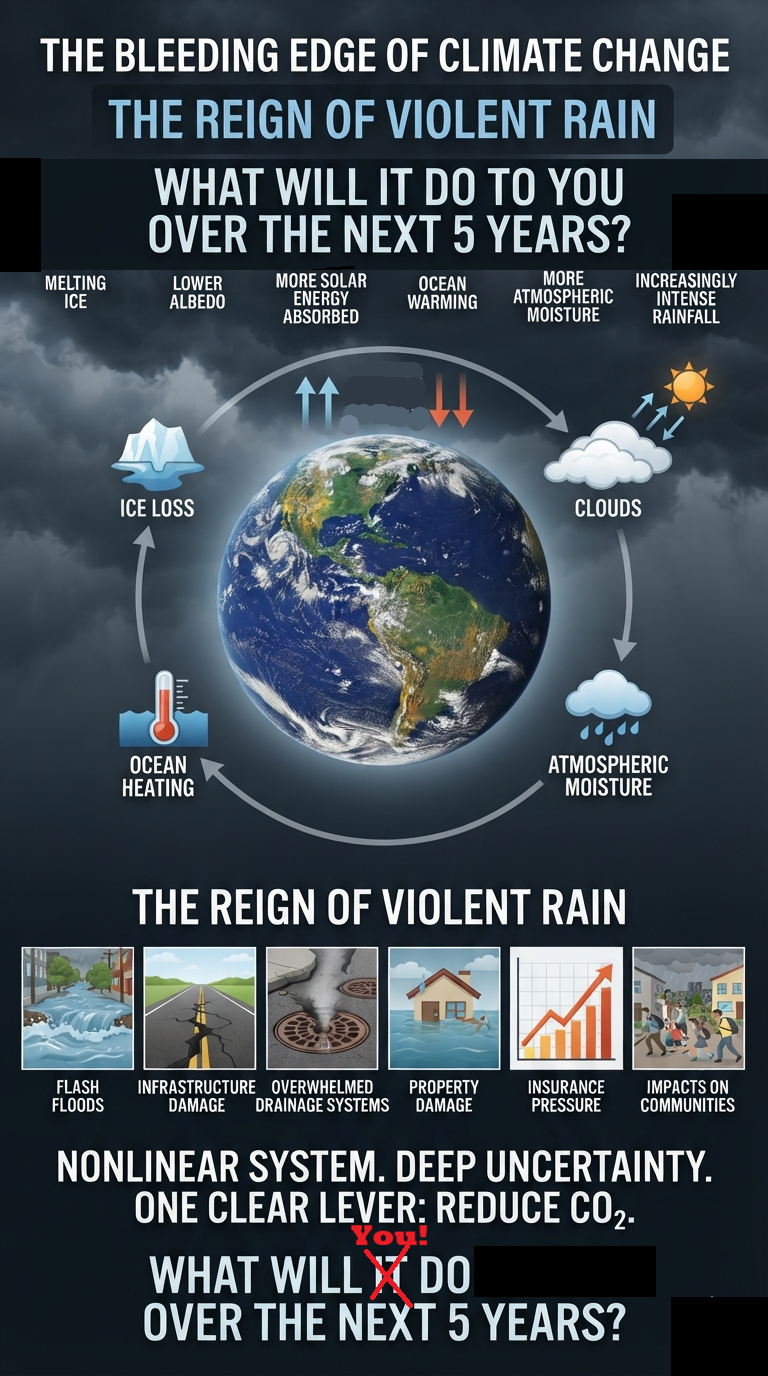
What happens to you over the next five years?

We are already seeing rainfall becoming more intense and, in many places, more destructive—violent. A warmer atmosphere can hold more water vapor, increasing the potential for extreme precipitation. The question isn’t simply how hot the planet might become over the next 50 years.

The more immediate question is:

What is the violent rain going to do to your home, your community, your infrastructure, your insurance—and you—over the next five years?

That is where climate change stops being a distant projection and starts becoming a personal reality.

Welcome to the future. Climate change is accelerating—and the acceleration itself is accelerating.

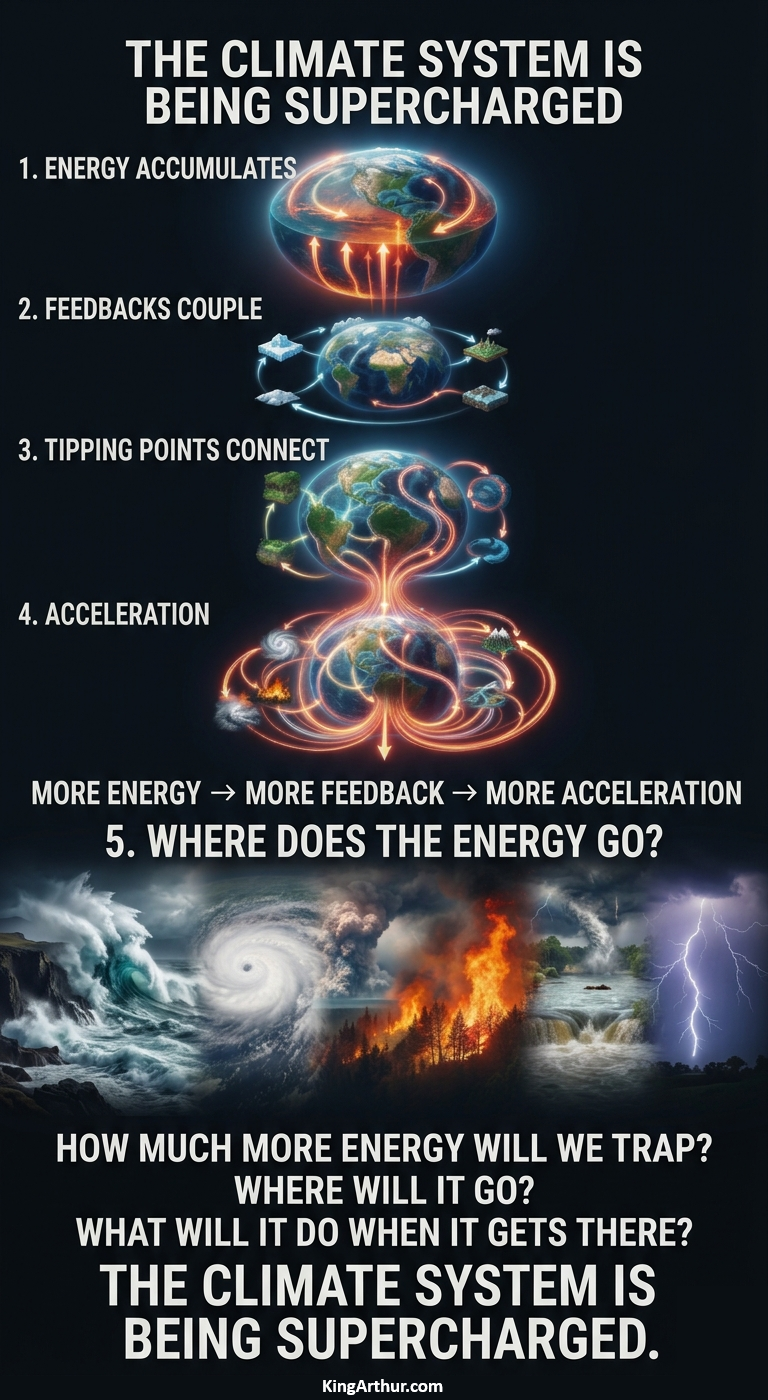
As tipping points become increasingly coupled and reinforce one another, the amount of energy moving through the climate system is accelerating—and the rate of acceleration itself is increasing.

At this point, the question is no longer simply, “How many degrees warmer will the planet become?”

The more important questions are: How much additional energy are we going to continue trapping? Where is all that energy going? And what will it do when it gets there?

We are already beginning to see the answers—in floods, heatwaves, flash droughts, wildfires, hailstorms, extreme precipitation, and increasingly volatile swings between opposing extremes.

These are not separate problems.

They are different manifestations of an increasingly energized climate system.

The planet does not experience climate change as a number on a thermometer.

It experiences it as energy moving through the system.

And that energy has to go somewhere.

The climate system is being supercharged.

The question is no longer whether that energy will affect us.

The question is where it will hit—and what it will do when it gets there.

Postscript: Where Does All That Energy Go?

Q: I don’t quite understand part of the paper. What does a “35 degree increase” in temperature mean? Where I live, a summer day can be around 30 degrees Celsius. Would this mean a summer day at around 65 degrees? (30+35=65). Wouldn’t that be lethal?

A: Good question. The answer is yes—and no. That’s actually part of the point of the paper.

A 65°C temperature at your location would obviously be lethal. But the 35°C figure is an energy-equivalent thought experiment, not a prediction that your local summer temperature would simply go from 30°C to 65°C.

The bigger problem with using average temperatures is just that—they are averages. An average of 65°C across a large area could mean one location is 30°C, another is 40°C, and another is far beyond either. The distribution of that energy matters far more to human habitability than the average itself.

And that’s where I don’t expect all of the already stored energy to behave “on average.” I don’t know exactly how that energy will hit you. It could manifest as violent rainfall, hail, heatwaves, wildfires, flash droughts, or any number of other energy transfers we haven’t fully anticipated.

But as long as that energy remains trapped in the Earth system, it doesn’t simply disappear. It continues moving through the system and interacting with everything else. You cannot create or destroy energy—you can only experience its feedbacks.

And yes, we would have to adapt. If conditions outside became routinely lethal, people might increasingly move underground or into heavily climate-controlled environments to survive.

In any event, an average of 65°C would be pretty close to hell—whether you’re experiencing it alive or studying it after the fact. 😏

bookmark_borderWhere’s the Beef? Tariffs, Inflation, and the Climate Cost of Meat

On August 21, 2026, President Donald Trump announced a temporary 90-day waiver of out-of-quota tariffs on imported ground beef, allowing up to 300,000 metric tons to enter the U.S. market tariff-free in an effort to reduce grocery prices. The president said he had secured a commitment that the imported meat would be sold at 25% below current market prices, providing relief from persistent food inflation.

The move is intended to address a dramatic increase in the cost of ground beef, which has risen roughly 57% over the past five years. But the policy immediately drew backlash from domestic cattle ranchers and rural-state Republicans, including Senator Tim Sheehy, who warned that flooding the market with cheaper foreign beef could undermine American cattle producers.

There is another problem that may be even more important to consumers: much of the imported beef affected by the policy is frozen beef destined for commercial and restaurant use, rather than the fresh ground beef consumers typically purchase at the grocery store. That means the immediate impact on household grocery bills may be considerably smaller than the headline numbers suggest.

More importantly, the tariff waiver does little to address the underlying forces driving higher beef prices.

Climate Change Is Becoming an Inflation Problem

The cattle industry is increasingly exposed to the economic consequences of climate extremes. Drought, extreme heat, wildfires, water scarcity, degraded pasture, and volatile feed supplies all increase the cost of raising cattle. When these pressures become severe enough, ranchers may be forced to reduce their herds, further constraining beef supplies and pushing prices higher.

This creates a feedback loop. Climate extremes increase production costs and reduce the supply of cattle. Reduced supply raises beef prices. Higher prices then encourage producers to rebuild their herds, but rebuilding takes years. Another drought or extreme-weather event during that process can once again force herd reductions.

This is why simply importing cheaper beef may treat the symptom without addressing the disease.

The larger economic issue is what I call climate inflation: the gradual—and increasingly rapid—incorporation of climate-related costs into the prices of food, energy, insurance, housing, transportation, and other necessities.

For the past several years, inflation discussions have focused primarily on monetary policy, supply chains, labor costs, tariffs, and government spending. Those factors certainly matter. But climate-driven disruptions are becoming an increasingly important component of the cost structure of the economy.

And unlike a temporary tariff or a change in interest rates, climate pressures can compound over time.

The Beef Problem Is Bigger Than Beef

A 90-day tariff waiver may provide some temporary relief. It may even benefit restaurants and commercial food purchasers if imported frozen beef reaches the market at substantially lower prices.

But it does not create more water, restore drought-stricken grazing land, prevent wildfires, reduce extreme heat, or rebuild cattle herds that have been lost to climate-driven conditions.

Nor does it address the increasingly expensive insurance, infrastructure, agricultural, and supply-chain consequences of a changing climate.

If climate extremes continue to intensify, we should expect more of these conflicts. Policymakers will repeatedly face the same choice: temporarily suppress prices by opening markets to cheaper imports, or address the underlying conditions that are making domestic production increasingly expensive.

Where’s the beef?

It may increasingly be somewhere else.

And that is the larger warning. Climate change is no longer simply an environmental issue. It is becoming an economic variable—and climate inflation may prove to be one of the most consequential economic developments of the next decade.

bookmark_borderThe Bleeding Edge of Climate Change

by Daniel and Sidd

While Sidd was in town, I took some notes. Somehow, they turned into this:

Climate Change: The Big Picture

There are many ways to look at climate change. From a micro perspective, there are millions of individual feedbacks operating throughout the Earth system. From a macro perspective, there is the climate system as a whole.

Understanding how those feedbacks interact—and, more importantly, how they feed back into one another—is at the bleeding edge of climate science.

One of the simplest examples is the albedo effect. The physics of ice is straightforward: bright, reflective ice sends a portion of incoming solar energy back into space, while darker ocean absorbs it. Less ice means more absorbed energy and, therefore, more warming.

But the system quickly becomes much more complicated.

How does changing albedo affect cloud formation, particularly over the tropics? And what happens to the climate if those clouds increase—or decrease?

The low clouds are especially important. They can reflect substantial amounts of incoming sunlight back into space. If tropical low clouds diminish, the ocean could absorb significantly more solar energy, accelerating warming.

This is where the bleeding edge begins.

Clouds are arguably the largest remaining uncertainty in our understanding of climate sensitivity. They can both reflect incoming solar radiation and trap outgoing heat. Which effect dominates—and how that balance changes as the planet warms—is one of the great questions in climate science.

My expectation is that the climate system could eventually approach a new equilibrium around +4°C above the preindustrial baseline, perhaps over the course of a couple centuries. That would imply roughly +2–3°C this century, with additional warming continuing into the next.

But that remains uncertain.

The important point is that climate change is not a simple linear equation. It is a massively interconnected system in which changes in one component can alter another, which then feeds back into the first. Ice affects albedo. Albedo affects heating. Heating affects clouds. Clouds affect radiation. Radiation affects ocean temperatures. Ocean temperatures affect evaporation and atmospheric moisture. And the cycle continues.

Everything is nonlinear.

Yet uncertainty about the exact trajectory does not mean uncertainty about what we should do.

The clearest lever we have is still the same: reduce CO₂ emissions and slow the accumulation of greenhouse gases in the atmosphere.

And while the long-term equilibrium matters, there is a much more immediate question.

What happens to you over the next five years?

We are already seeing rainfall becoming more intense and, in many places, more destructive—violent. A warmer atmosphere can hold more water vapor, increasing the potential for extreme precipitation. The question isn’t simply how hot the planet might become over the next 50 years.

The more immediate question is:

What is the violent rain going to do to your home, your community, your infrastructure, your insurance—and you—over the next five years?

That is where climate change stops being a distant projection and starts becoming a personal reality.

bookmark_borderClimate Change Notes

Climate Change
There are many ways to look at it. If you go with a micro view, there are millions of feedbacks. If you look at it from a macro view, there is the climate system.

How these feedbacks are feeding back is the bleeding edge of climate change.

One of the simplest of feedbacks, the Albedo effect, isn’t so simple. How much ice there is to reflect the energy is simple physics. But, how the clouds form over the tropics because of the Albedo effect is part of this bleeding edge. We don’t know if there are going to be more clouds over the tropics or viewer. The lower clouds are the ones of concern. If they disappear, then ocean heating will be accelerated.

In the big picture, clouds around the world are the biggest unknown. It is probable we will reach and level off around +4C over a couple centuries. Likely 2-3C this century and +4 the next.

But this is still unknown.
Clouds can reflect or absorb heat. It’s going to take a while until we know which is going to prevail. And, that is just one piece of the puzzle. Everything is so nonlinear it’s difficult. But, it’s clear what we have to do — reduce CO2.

Short term: the rain is getting so violent. It may get hotter over the next 50 years? More importantly what’s the rain going to do to YOU over the next 5 years?

bookmark_borderOperation Blue Skies: Testing a New Way to Reduce Aviation’s Climate Impact

by Daniel Brouse

Cloud feedback is one of the most important—and least understood—climate multipliers. That makes efforts to better understand and control aviation-related cloud formation particularly significant.

On August 18, 2026, the landmark £5 million “Operation Blue Skies” project was officially launched, marking the world’s first airspace-scale trial of contrail avoidance across an entire oceanic region.

The initiative targets the Shanwick Oceanic airspace in the eastern North Atlantic, one of the world’s busiest aviation corridors. The region is estimated to account for roughly 5% of global contrail warming.

Supported by the UK government and technology partners, the project will test whether relatively small operational changes—such as adjusting flight altitudes and routes to avoid atmospheric conditions conducive to persistent contrail formation—can significantly reduce aviation’s climate impact.

Contrails are more than short-lived streaks across the sky. Under cold, humid atmospheric conditions, aircraft exhaust can create ice crystals that persist and spread into cirrus clouds. These clouds can alter the Earth’s radiation balance by trapping outgoing heat, producing a warming effect that can substantially exceed the warming associated with the aircraft’s carbon dioxide emissions over short time scales.

The project is particularly important because contrails and their associated cloud effects remain among the largest uncertainties in assessing aviation’s total climate impact. Current estimates suggest that non-CO₂ effects, including contrails, account for roughly one-third of aviation’s overall climate impact.

Operation Blue Skies therefore represents more than an aviation experiment. It is a real-world test of whether targeted operational changes can interrupt a climate feedback with potentially significant consequences—without requiring new aircraft technology or eliminating flights.

If successful, the approach could provide a relatively inexpensive way to reduce aviation’s near-term warming contribution while researchers continue working to better understand the complex interactions among aircraft emissions, atmospheric moisture, clouds, and climate.

The significance extends beyond aviation. Climate change is increasingly revealing that the atmosphere is not simply a passive recipient of emissions. Feedbacks involving clouds, water vapor, ice, and atmospheric circulation can amplify or modify the initial forcing, sometimes producing effects far larger than the original disturbance.

Operation Blue Skies offers an opportunity to test whether understanding those feedbacks can translate directly into practical climate mitigation.

bookmark_borderWhen Climate Moves the Crust: The Earth Quakes

By Daniel Brouse and Sidd Mukherjee

For decades, we have studied the relationship between earthquakes and climate change. Early in that work, there was little evidence that changes in global temperature were having any meaningful effect on tectonic activity. That conclusion was reasonable at the time. Climate change was expected to progress relatively slowly, over centuries or even millennia, and the resulting changes in surface mass and hydrological conditions were correspondingly gradual.

That assumption no longer describes the world we are entering.

The rate of climate change has accelerated dramatically, and many of the associated physical changes are now occurring on timescales measured in decades, years, and—in some cases—even months. This does not mean that global warming is heating the Earth’s crust enough to expand tectonic plates and cause earthquakes. That effect remains negligible.

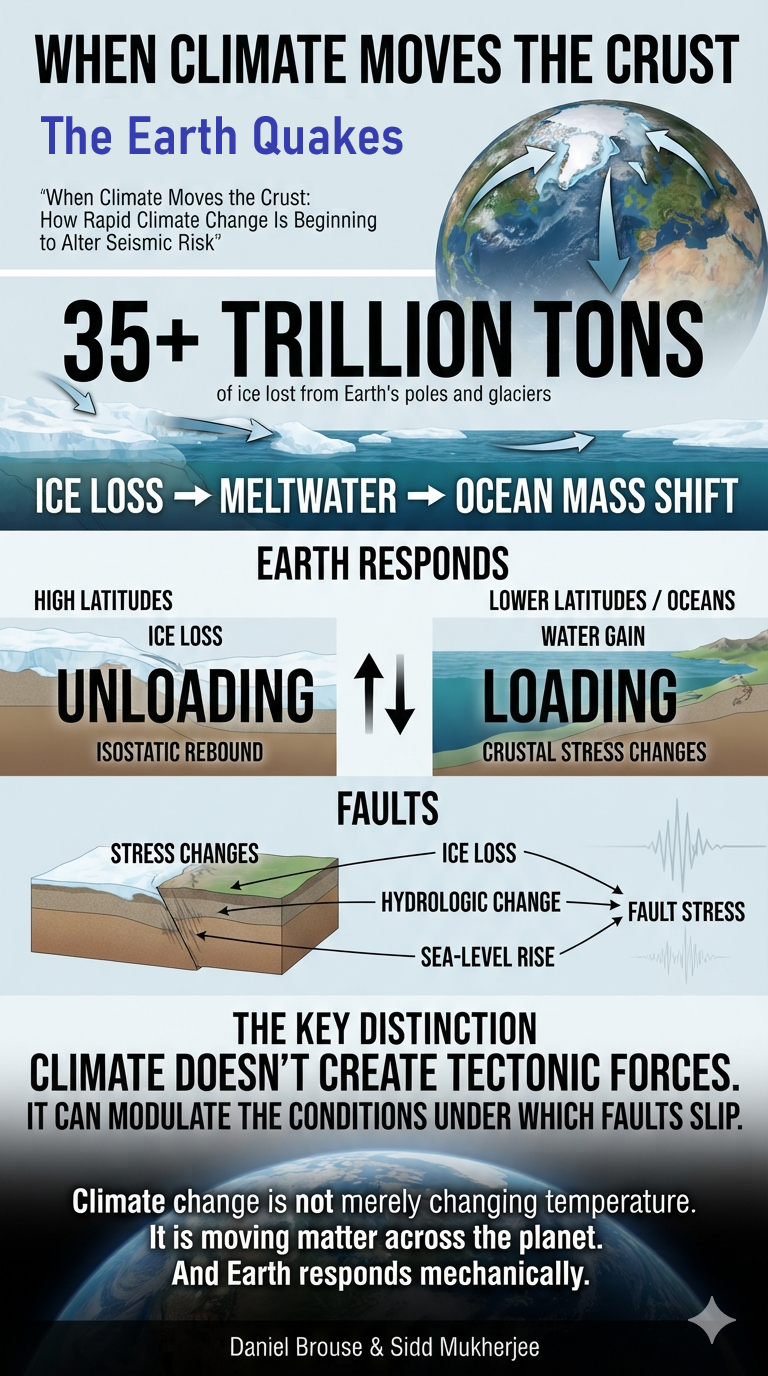
The more important mechanism is mass redistribution.

Climate change is rapidly moving enormous quantities of water and ice around the planet. Ice sheets are losing mass, glaciers are retreating, permafrost is thawing, groundwater is being depleted or redistributed, reservoirs and lakes are experiencing increasingly extreme fluctuations, and sea level is rising. These changes alter the loads imposed on Earth’s crust and, in some locations, the pressure and stress conditions surrounding faults.

Earthquakes are ultimately controlled by stress. A fault can remain locked for centuries while tectonic forces slowly accumulate until the stress exceeds the fault’s resistance to slip. Climate-driven changes in surface loading do not create the tectonic forces responsible for most earthquakes, but they can modulate the timing, location, and frequency of seismic events by nudging already-stressed faults closer to—or farther from—the point of failure.

That distinction is critical.

Climate change does not need to cause tectonic earthquakes to become a meaningful factor in seismic risk. It only needs to change the conditions under which faults fail.

Glacial Unloading

One of the clearest mechanisms is the loss of glacial and ice-sheet mass.

For thousands of years, enormous glaciers and ice sheets have imposed immense loads on the Earth’s crust. When that mass is removed, the crust responds through a process known as isostatic rebound. The underlying crust rises as the weight above it decreases, changing the distribution of stress within the lithosphere.

In regions undergoing rapid deglaciation, this unloading can alter stress on existing faults and increase seismic activity. The effect is particularly important because the removal of ice can continue for decades or centuries after the initial climatic warming.

The key point is simple: when climate change removes trillions of tons of mass from the surface, the crust responds.

Permafrost Thaw and Meltwater

The destabilization of frozen ground introduces another mechanism.

As permafrost thaws and glaciers retreat, meltwater can penetrate fractured rock and mountain systems. Increased fluid pressure within faults can reduce the effective normal stress holding the fault surfaces together. In simplified terms, water can make it easier for an already stressed fault to slip.

This does not mean that every episode of melting will produce an earthquake. Rather, it creates another pathway through which rapid environmental change can influence the mechanical conditions surrounding faults.

Where faults are already near failure, relatively small changes in fluid pressure can matter.

Hydrostatic Load Shifts

Climate change is also producing increasingly extreme changes in the distribution of surface water.

Severe droughts remove enormous quantities of water from reservoirs, lakes, soils, and groundwater systems. Extreme precipitation and monsoon events can then return massive amounts of water over remarkably short periods.

That changing weight alters the stresses imposed on the crust.

Large reservoirs have long been recognized as capable of inducing or modulating seismicity, particularly where water infiltration increases pore pressure along faults. Climate-driven swings in precipitation, drought, groundwater storage, snowpack, and reservoir levels can produce similar loading and unloading effects, although the magnitude and significance vary greatly by location.

The important issue is not simply how much water exists. It is where that water is, how rapidly it moves, and how that movement changes the stress field.

Sea-Level Rise

Sea-level rise represents another large-scale redistribution of mass.

As land-based ice melts, water that was previously stored on continents is transferred into the oceans. At the same time, the increasing weight of seawater changes the loading conditions along continental margins and beneath coastal regions.

These effects are generally small compared with the enormous tectonic forces responsible for earthquakes. Nevertheless, in regions containing faults already close to failure, even relatively small changes in stress can influence the timing of seismic events.

The scientific question, therefore, is not whether sea-level rise is going to cause earthquakes worldwide. It is whether rapid changes in ocean loading can measurably influence seismicity in susceptible regions.

The Planet Is Moving Water at an Extraordinary Scale

Perhaps the most remarkable evidence that this redistribution of mass is physically significant comes from Earth’s rotation itself.

When ice sheets lose mass, that water does not disappear. It is transferred from land—particularly from the high latitudes—into the global ocean. Over time, ocean circulation and gravity redistribute that water across the planet, with a substantial portion ultimately moving toward lower latitudes.

The quantity of water involved is so enormous that the redistribution is measurable in the Earth’s rotation.

The “Figure Skater” Effect

Earth is not a perfect sphere. Its rotation causes it to bulge slightly around the equator, making the planet an oblate spheroid.

The basic physics is familiar from a figure skater spinning on ice. When mass moves farther from the axis of rotation, the moment of inertia increases and the rate of rotation decreases. When mass moves toward the axis, the opposite occurs.

The redistribution of water caused by melting ice therefore changes Earth’s moment of inertia and slightly alters the length of the day.

This is not theoretical speculation. Modern geodesy can detect these changes.

Earth has lost well over 35 trillion tons (gigatonnes) of ice from its polar ice sheets and glaciers over the past few decades, with the resulting meltwater being redistributed through the global ocean system, ultimately increasing ocean mass at lower latitudes. That represents an extraordinary transfer of mass from the high-latitude continents toward the oceans and, through gravitational and rotational processes, toward the equatorial regions.

The mechanical consequence is the counterpart to isostatic rebound. Where ice loss removes an enormous surface load and allows the crust to rebound upward, the accumulation of additional ocean water places an increasing load on the seafloor and coastal crust. In effect, while the high latitudes are experiencing unloading, lower latitudes are experiencing climate-driven loading.

The magnitude of this redistribution is difficult to comprehend: tens of trillions of tons of mass are being transferred across the planet within a geologically instantaneous interval.

Climate change is therefore not merely changing atmospheric temperature. It is physically moving enormous quantities of matter across Earth’s surface—and the solid Earth responds mechanically to that redistribution.

From Temperature Change to Mass Redistribution

This is where the relationship between climate change and seismicity becomes more interesting.

The traditional question was:

Is a warmer atmosphere heating the crust enough to cause earthquakes?

The answer is essentially no.

The more important question is:

Is rapid climate-driven redistribution of ice, water, and surface mass capable of altering the stress and pressure conditions acting on faults that are already tectonically stressed?

The answer is yes, in principle—and in some settings, observations already demonstrate that environmental loading can modulate seismicity.

The magnitude of the effect varies enormously from one region to another. Tectonic forces remain overwhelmingly dominant, and climate-related loading should not be portrayed as a replacement for conventional earthquake science.

But that is precisely why the issue deserves attention.

A fault does not have to be pushed from a state of complete stability to failure by climate change. It may only require a small additional perturbation when it is already near its failure threshold.

As climate change accelerates, the frequency and magnitude of these environmental perturbations are changing as well.

The climate system is becoming a faster-moving component of Earth’s physical system. The question is no longer whether climate can interact with the solid Earth. It is how much, where, and how rapidly those interactions can alter seismic risk.

bookmark_borderHuman CO2 Climate Change: All You Need to Know

by Daniel Brouse

Human CO2 Climate Change: All You Need to Know
An unprecedented rate of Earth-system change.

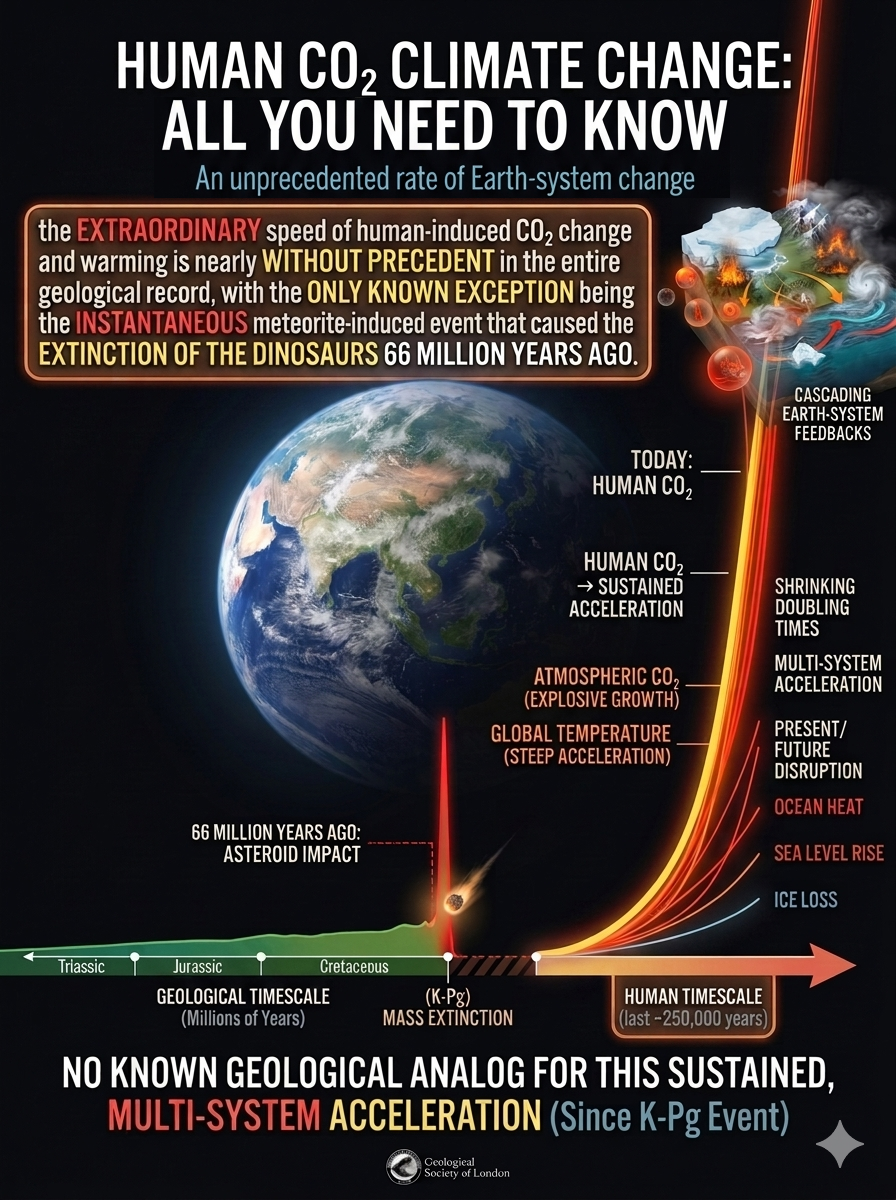
The Geological Society of London (the UK’s expert association of professional geologists since 1807) says:

” ….the current speed of human-induced CO2 change and warming is nearly without precedent in the entire geological record, with the only known exception being the instantaneous, meteorite-induced event that caused the extinction of non-bird-like dinosaurs 66 million years ago” (H/T Rocky Rex)

We’ve arrived at a very similar observation in our own work, but I don’t think I’ve seen it stated this clearly—or published elsewhere. Thanks, Rocky, for helping to illuminate it.

Juxtapose the two and let me know whether the comparison can be communicated more effectively.

Multiple climate indicators now point to rates of warming-related disruption far beyond those observed during the modern instrumental era.

There is no well-established geological analog for a sustained, multi-variable, decade-scale pattern of accelerating change across the full Earth system at the resolution available in contemporary observations. If sustained, this may represent one of the most abrupt large-scale climate transitions in Earth’s geological history.

Rocky replied:

I’ve been citing that for a long time, and I’m always impressed by how many people can totally ignore it. It’s very much the scientific version of “The Good Ancestor” poem, it should hit people between the eyes and wake them up. All the signs are that we are entering an abrupt climate change process. Have I told you this true story before?

In the mid 1950s, Russell Coope was looking for a PhD project after graduating as a geologist. He noticed beetle remains in ice age deposits in a gravel pit in the UK Midlands. His supervisor, Prof Fred Shotton, said something like: “I expect they are just modern beetles that have got stuck to the surface.” Fred was wrong – a rare event.

Coope decided to base his PhD on recording what kinds of beetles there were in different ice age deposits, to see where it led. He discovered that the mix of beetles was linked to the temperatures at that time.

He did this by comparing his layer-by-layer collections with collections of beetles from different places in the modern world – beetles happen to evolve very slowly, so the actual variety of beetles hasn’t changed much over the last million years or so.

As his research proceeded, Coope was shocked to find that the beetles showed that at times, during the ice ages, temperatures had changed significantly in just a few decades – his beetles showed that the Earth’s climate is not fundamentally stable.

He had discovered abrupt climate change events, a previously unknown phenomenon. Geologists had always assumed that most processes were slow.

I had the good fortune to be a student in Coope’s palaeontology lectures long ago…. and also in Fred’s physical geology lectures. (In 1943, Fred Shotton was involved in a secret project that produced geological maps of certain beaches in northern France…… that’s a movie that should be made by someone)

“We are messing with the trigger that causes climate change….the outcome is likely to be ferocious.”

– Professor Russell Coope (1930-2011)

Russell Coope and his ice age beetles https://www.youtube.com/watch?v=xMyt-UbcUQo

Russell Coope on fossil beetles in the Cromer Forest-bed at Happisburgh, Norfolk, UK

YOUTUBE.COM

Russell Coope on fossil beetles in the Cromer Forest-bed at Happisburgh, Norfolk, UK

Russel

The Human Induced Climate Change Experiment

Warming → Feedback Activation → Feedback Coupling → Amplification → Tipping-Point Threshold → Cascade

The climate system is not simply warming—it is changing how it responds to that warming. Coupled climate feedbacks are becoming one of the most consequential dimensions of climate risk in the 21st century because they amplify changes and connect individual tipping-point pathways into larger cascading effects.

The longer warming persists, the more climate feedbacks become active. As these feedbacks interact, we are already observing nonlinear responses, amplification, and cascading impacts across the climate system. Hundreds of feedback mechanisms have been identified, and many can couple and reinforce one another, contributing to the accelerating pace and increasing magnitude of climate change—The Domino Effect.