bookmark_borderEmerging Coupled Feedback Loops Tip Tipping Points

by Daniel Brouse and Sidd Mukherjee

Coupled Climate Feedbacks: How Tipping Points Can Trigger Cascading Earth-System Instability

From Tipping Elements to Cascading Feedbacks

In 2008, a landmark climate-science paper, “Tipping Elements in the Earth’s Climate System,” brought renewed attention to the possibility that major components of the Earth system could undergo abrupt and potentially irreversible changes once critical thresholds were approached or crossed.

The 2008 Foundational Paper

Tipping Elements in the Earth’s Climate System
Lenton et al. (2008), Proceedings of the National Academy of Sciences

The paper examined several major climate tipping elements and highlighted the potential significance of warming in the range of approximately 1.5–2°C above preindustrial levels. These findings helped reinforce the scientific rationale for limiting global warming, including through the Paris Agreement’s goal of holding warming well below 2°C while pursuing efforts to limit it to 1.5°C.

At the time, the central challenge was framed largely as one of preventing individual climate tipping elements from reaching critical thresholds.

Today, the scientific picture is becoming more complicated.

Evidence of accelerating changes in several vulnerable components of the Earth system has intensified concern about approaching or potentially crossing thresholds. What was less well understood in the earlier tipping-point framework was the possibility that multiple feedback loops could interact, reinforce one another, and alter the timescales over which destabilization occurs.

The critical question is no longer simply:

How close is each tipping point?

It is increasingly:

What happens when tipping elements and feedback loops begin interacting with one another?


The Missing Dimension: Coupled Feedback Loops

In the 1990s, research associated with the Membrane Domain began exploring human-induced climate change through a nonlinear systems perspective, challenging the assumption that climate impacts would necessarily progress in a simple, approximately linear fashion.

Our research proposed that climate change could exhibit nonlinear and accelerating behavior as multiple physical, ecological, and socioeconomic feedbacks interact. The central concept was not that warming itself follows a simple exponential curve, but that the rate and consequences of change can accelerate as reinforcing feedbacks become increasingly coupled.

At the heart of this possibility are positive feedback mechanisms.

In climate science, a positive feedback is a process in which an initial change produces additional changes that reinforce the original disturbance. The term “positive” describes the direction of the feedback, not whether its consequences are beneficial.

Examples include:

  • Ice–Albedo Feedback — loss of reflective snow and ice exposes darker surfaces that absorb more solar energy.
  • Water Vapor Feedback — warming increases atmospheric water vapor, strengthening greenhouse trapping.
  • Carbon-Cycle Feedbacks — warming can alter soils, vegetation, oceans, and permafrost in ways that affect carbon uptake and release.
  • Ocean-Circulation Feedbacks — changes in temperature, salinity, and freshwater input can alter ocean circulation and climate patterns.
  • Vegetation–Climate Feedbacks — warming, drought, wildfire, and vegetation loss can reinforce regional drying and carbon loss.
  • Cloud Feedbacks — warming alters cloud properties and distributions, changing the balance between reflected sunlight and outgoing infrared radiation.
  • Extreme-Weather and Health Feedbacks — heat, wildfire smoke, air pollution, infectious disease risks, and infrastructure disruption can interact with ecological and societal vulnerabilities.

Individually, these mechanisms can amplify warming or its impacts.

The more consequential possibility is that they can also interact.


When Feedbacks Begin Coupling

A feedback loop does not have to operate in isolation.

For example:

Warming → Sea-Ice Loss → Lower Albedo → Greater Solar Absorption → Additional Arctic Warming

At the same time:

Arctic Warming → Permafrost Thaw → Microbial Decomposition → Greater Greenhouse-Gas Release → Additional Atmospheric Warming

These pathways can interact.

Additional warming can increase ice loss, which can alter atmospheric and oceanic conditions. Those changes can influence permafrost, ecosystems, circulation, precipitation, and wildfire behavior. Each affected subsystem can then introduce additional feedbacks.

The result is not necessarily one feedback loop.

It is a network of interacting feedback loops.


Tipping Points Can Become Connectors

Climate tipping points are often discussed individually: Greenland ice loss, Antarctic ice-sheet instability, AMOC disruption, Amazon dieback, permafrost thaw, and other vulnerable components.

But Earth systems do not operate independently.

When one component undergoes a major transition, the resulting changes can modify the conditions experienced by other components.

A tipping element can therefore become more than an endpoint.

It can become a connector.

A threshold crossing can alter temperature, precipitation, ocean salinity, atmospheric circulation, carbon exchange, surface reflectivity, or other physical conditions. Those changes can increase stress on another vulnerable subsystem.

This creates the possibility of cascading interactions:

Initial Warming
→ Feedback Amplification
→ Tipping-Element Destabilization
→ Environmental Change
→ New Feedback Activation
→ Additional Tipping-Element Stress
→ Further Amplification

The system can begin moving through a sequence in which each major disturbance increases the probability or severity of subsequent disturbances.


Tipping Points Igniting a Domino Effect

We understood that tipping points could eventually activate self-reinforcing feedbacks within the climate system.

What has become increasingly difficult to ignore is the potential importance of coupling and timescale compression.

The concern is not simply that individual thresholds exist.

It is that interacting feedbacks can change how quickly the system approaches them.

Consider a simplified example involving the Arctic:

Arctic Warming
→ Snow and Sea-Ice Loss
→ Lower Surface Reflectivity
→ Greater Solar Absorption
→ Additional Arctic Warming

At the same time:

Arctic Warming
→ Permafrost Thaw
→ Microbial Decomposition
→ Increased Methane and Carbon Release
→ Additional Atmospheric Warming

And simultaneously:

Arctic Warming
→ Atmospheric-Circulation Changes
→ Heat Extremes and Drought
→ Boreal Forest Stress
→ Wildfire
→ Carbon Emissions and Smoke Effects

These are not three isolated climate stories.

They are interacting components of a larger Earth-system network.


Cascading System Failures

The destabilization of climate subsystems is unlikely to resemble a smooth, uniform decline.

Instead, some changes can increase stress on other systems, producing cascading and compounding effects.

Consider the interaction between ocean circulation, Greenland, the Arctic, and the carbon cycle.

Changes in the Atlantic Meridional Overturning Circulation (AMOC) can redistribute heat and influence precipitation patterns across the Atlantic basin. Meanwhile, Greenland ice loss adds freshwater to the North Atlantic, affecting ocean density and stratification and potentially contributing to further AMOC weakening.

At the same time, Arctic amplification accelerates sea-ice loss and permafrost thaw. Permafrost degradation can release additional carbon dioxide and methane, adding greenhouse forcing to an already warming atmosphere.

Elsewhere, increasing heat and drought stress can threaten tropical forests. Amazon forest degradation and drought can reduce carbon uptake, alter evapotranspiration and rainfall recycling, and potentially increase the vulnerability of the forest to further drying and fire.

These processes can interact with one another.

The important point is not that every feedback necessarily causes every other feedback.

It is that the Earth system contains enough interconnected pathways that disturbances in one subsystem can propagate into others.


From Isolated Thresholds to a Network of Thresholds

This changes how climate risk should be conceptualized.

A tipping point should not necessarily be viewed as an isolated cliff.

It may be better understood as a node within a dynamic network of interacting thresholds and feedbacks.

The critical sequence becomes:

Warming
→ Feedback Activation
→ System Destabilization
→ Threshold Approach or Crossing
→ New Environmental Forcing
→ Additional Feedback Activation
→ Further Threshold Stress

Under this framework, the risk is not merely that one tipping element crosses a threshold.

The greater concern is cascading destabilization across multiple connected components of the Earth system.


The Central Risk: Nonlinear Acceleration

This is where nonlinear climate dynamics become especially important.

If each climate subsystem responded independently, the trajectory of global change would be easier to anticipate.

But coupled systems can behave differently.

As more feedbacks become activated, the effective rate of change in one component can be influenced by changes occurring elsewhere. This can produce periods of acceleration, abrupt transitions, threshold behavior, and substantial regional differences.

The resulting trajectory does not have to be a smooth curve.

It can become increasingly irregular and nonlinear.

That does not mean that the climate system is literally entering an uncontrolled “runaway” state, nor does it mean that every tipping point will necessarily cascade into every other one.

It means that the possibility of interacting thresholds and feedbacks makes the future more path-dependent, nonlinear, and difficult to manage.


The Climate System Is a Network, Not a Collection of Isolated Problems

The most important conceptual shift may therefore be from thinking about individual climate threats to understanding coupled Earth-system dynamics.

Ice loss affects albedo.

Warming affects permafrost.

Permafrost affects greenhouse-gas concentrations.

Greenhouse gases affect atmospheric warming.

Warming affects ecosystems.

Ecosystem degradation affects carbon storage.

Wildfire affects carbon emissions and atmospheric composition.

Ocean warming affects ice shelves.

Ice-sheet loss affects sea level and freshwater inputs.

Freshwater inputs can affect ocean circulation.

Ocean circulation redistributes heat and influences atmospheric conditions.

And each change can alter the conditions under which other feedbacks operate.

The resulting system resembles less a collection of separate dominoes and more a network of interconnected switches, where activating one pathway can change the sensitivity of many others.


The Real Challenge

The climate problem is therefore not simply about how much warming humanity produces.

It is also about how warming changes the internal dynamics of the Earth system.

The longer warming persists, the more feedbacks become active. As those feedbacks interact, the potential for nonlinear responses and cascading impacts increases.

The scientific challenge is to determine:

Which thresholds are approaching?

Which feedbacks are becoming stronger?

Which feedbacks are becoming coupled?

How quickly are these interactions changing the system?

And most importantly:

Are we beginning to compress the timescales between individual climate-system disruptions?

These questions deserve the same urgency once reserved for the identification of individual tipping points.

The climate system is not simply warming.

It is changing how it responds to warming.

That may ultimately prove to be one of the most consequential dimensions of climate risk in the 21st century.

Examples of Coupled Climate Feedback Loops and Tipping-Point Pathways

Climate feedbacks rarely operate in isolation. Many interact with, reinforce, or redirect one another, creating coupled feedback systems in which an initial warming response can trigger additional processes that amplify warming and increase pressure on climate tipping elements.

1. Lapse-Rate + Ice–Albedo Feedbacks

Two important feedbacks are the lapse-rate feedback and the ice–albedo feedback. They operate through different physical mechanisms but can become tightly coupled.

Lapse-Rate Feedback → Greater Near-Surface Heat Retention

Changes in the vertical temperature structure of the atmosphere can influence how efficiently heat is transported and radiated to space, affecting the amount of warming concentrated near Earth’s surface.

Ice–Albedo Feedback → Greater Solar Absorption

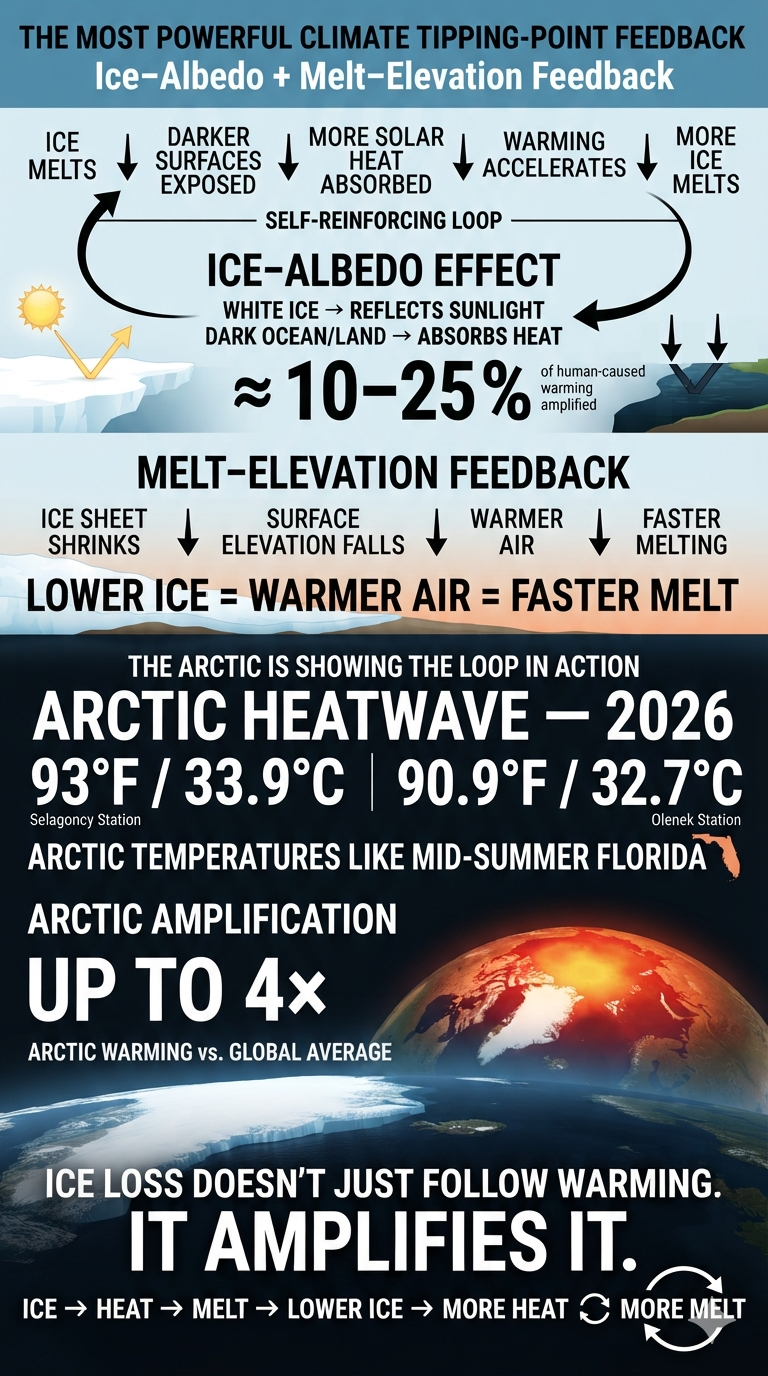
As snow and ice melt, reflective surfaces are replaced by darker land or ocean surfaces. Less sunlight is reflected back to space, increasing solar absorption and producing additional warming.

Together, these processes can form a reinforcing pathway:

Warming → Atmospheric Stability / Lapse-Rate Effects → Greater Near-Surface Heat Retention → Snow and Ice Loss → Lower Albedo → Greater Solar Absorption → Additional Warming ↺

This coupling helps explain why the Arctic has warmed substantially faster than the global average.

A simpler expression of the ice–albedo loop is:

Warming → Ice and Snow Loss → Darker Surface Exposure → Greater Solar Absorption → Additional Local Warming → More Ice Loss ↺


2. Ice-Sheet Melt–Elevation Feedback

Ice loss can also create a melt–elevation feedback.

Ice Loss → Lower Surface Elevation → Exposure to Warmer Air → Increased Melting → Additional Ice Loss → Further Elevation Loss ↺

As an ice sheet thins, its surface can descend into warmer atmospheric conditions, increasing the potential for further surface melting.

Ice-Sheet Thinning → Lower Elevation → Warmer Air Exposure → Faster Melting → Further Thinning ↺

This feedback can interact with the ice–albedo feedback, producing additional cryospheric amplification.


3. Greenland Ice Loss → AMOC Disruption

Greenland ice loss provides another important coupling pathway.

Greenland Ice Loss → Freshwater Input to the North Atlantic → Ocean Freshening → Changes in Salinity and Density → AMOC Weakening → Atmospheric and Oceanic Changes → Secondary Climate Feedbacks ↺

Large freshwater inputs can alter North Atlantic density structure and potentially affect the Atlantic Meridional Overturning Circulation (AMOC). Changes in the AMOC can, in turn, reorganize atmospheric and oceanic circulation and influence other climate processes.

The pathway can therefore be represented as:

Greenland Ice Loss → Freshwater Entering North Atlantic → Salinity and Density Changes → AMOC Weakening → Atmospheric and Oceanic Disruption → Secondary Feedbacks and Tipping Processes ↺


4. Permafrost Carbon Feedback

One of the most important carbon-cycle feedbacks is:

Warming → Permafrost Thaw → Greenhouse-Gas Release → Additional Warming ↺

As permafrost thaws, previously frozen organic carbon becomes increasingly available for microbial decomposition. This can release carbon dioxide and methane, adding greenhouse forcing to the atmosphere.


5. Arctic Amplification → Jet Stream → Heat and Drought

Arctic warming can alter the temperature contrast between the Arctic and lower latitudes, influencing atmospheric circulation.

A coupled pathway is:

Arctic Warming → Reduced Equator-to-Pole Temperature Contrast → Changes in Jet-Stream Behavior → Atmospheric Blocking → Persistent Heat → Drought and Drying

The resulting heat and drought can increase atmospheric moisture demand and vegetation stress:

Warm Air → Increased Atmospheric Moisture Demand → Greater Evaporation and Plant Water Loss → Drier Vegetation and Soils → More Flammable Fuels

This creates conditions favorable for wildfire development.


6. Heat → Drought → Wildfire → Pyrocumulonimbus Feedback

Extreme heat and drought can dry vegetation and increase wildfire risk.

Extreme Heat + Drought → Dry Vegetation → Wildfire → Pyrocumulonimbus Development → Lightning and Wind Changes → New Ignitions → Additional Wildfires ↺

A larger coupled pathway can be expressed as:

Arctic Warming → Atmospheric Circulation Changes → Heat Dome → Drought → High Vapor Pressure Deficit (VPD) → Dry Forests → Wildfire → Pyrocumulonimbus → Lightning → Additional Fires → Smoke Transport ↺

This illustrates how atmospheric circulation, land-surface drying, wildfire, and atmospheric chemistry can become interconnected.


7. Antarctic Ice-Shelf Instability

Ocean warming can destabilize ice shelves from below:

Warming Ocean → Subsurface Ice-Shelf Melting → Ice-Shelf Thinning → Reduced Structural Restraint → Increased Ice Discharge → Sea-Level Rise ↺

Warm ocean water reaching vulnerable ice shelves can contribute to basal melting and thinning. As ice shelves lose structural integrity, their ability to restrain inland grounded ice may decrease.

Warm Ocean Currents → Basal Melting → Ice-Shelf Thinning → Weakened Structural Restraint → Increased Ice Discharge → Rising Sea Levels


8. Ice Loss → Permafrost → Methane and CO₂

Ice loss can connect directly with the carbon cycle:

Ice and Snow Loss → Greater Solar Absorption → Arctic Warming → Permafrost Thaw → CH₄ + CO₂ Release → Additional Warming ↺

Wildfire can strengthen this connection:

Warming → More Severe Wildfire → CO₂ Emissions + Vegetation and Soil Loss → Accelerated Permafrost Thaw → Additional CH₄ + CO₂ Release → Further Warming ↺

The resulting system becomes increasingly interconnected:

Ice Loss → Wildfire → Permafrost Thaw → Greenhouse-Gas Release → Additional Warming → Further Ice Loss ↺

The major components can be visualized as:

🧊 Ice loss
🔥 Wildfire
❄️ Permafrost thaw
💨 Methane release
🌡️ Additional warming
↻ Further tipping-point pressure

A broader pathway is:

Human Emissions → Warming → Ice Loss → Permafrost Thaw → CH₄ + CO₂ Release → Additional Warming → Greater Wildfire and Ecosystem Disruption → Additional Greenhouse-Gas Release → Increased Tipping-Point Pressure ↺


9. Methane → CO₂: A Two-Stage Greenhouse-Gas Feedback

Methane has a relatively short atmospheric lifetime compared with CO₂, but its oxidation ultimately produces CO₂.

Methane Release → Strong Near-Term Warming → Atmospheric Oxidation → CO₂ → Long-Term Additional Warming

This distinction is important because methane can produce substantial near-term warming while its oxidation contributes to longer-lived atmospheric CO₂.


10. Wetlands → Methane → Warming

Changes in precipitation and flooding can alter wetland extent and microbial activity:

Rising Temperatures → Changes in Rainfall and Flooding → Expansion or Intensification of Oxygen-Poor Wetlands → Increased Anaerobic Decomposition → Greater Methane Release → Additional Warming ↺

A simplified feedback is:

More Warming → More Methane Release → More Greenhouse Warming → Greater Ecosystem Disruption → Additional Methane Release ↺


11. Coupled Cryosphere–Carbon Feedback Cascade

Multiple feedbacks can interact in sequence:

Arctic Warming → Sea-Ice Loss → Stronger Ice–Albedo Feedback → Additional Arctic Warming → Permafrost Thaw → Accelerated Microbial Decomposition → Increased CH₄ Emissions → Additional Atmospheric Warming → Further Ice Loss and Permafrost Thaw ↺

This creates a coupled cryosphere–carbon feedback in which warming reinforces both physical and biological processes.

Before tipping-point activation, the dominant relationship may be relatively straightforward:

Human Emissions → Greenhouse-Gas Increase → Warming

As additional climate-system feedbacks become activated:

Human Emissions → Warming → Permafrost and Wetland Changes → Additional Methane → More Warming

With multiple interacting tipping elements:

Warming → Ice Loss → Greater Solar Absorption → Permafrost Thaw → Methane Release → Additional Warming → Further Tipping-Point Pressure → Additional Greenhouse-Gas Release ↺

A more complex cascade can include wildfire:

Warming → Ice Loss → Greater Solar Absorption → Permafrost Thaw → CH₄ + CO₂ Release → More Warming → Intensified Wildfires → Forest and Soil Carbon Loss → Accelerated Permafrost Thaw → Additional Greenhouse-Gas Release → Further Tipping-Point Pressure ↺


12. Heat → Cooling Demand → Energy Use

Climate impacts can also generate feedbacks through human energy systems:

More Heat → Higher Cooling Demand → Greater Electricity Consumption → Potentially Higher Greenhouse-Gas Emissions → Additional Warming → More Heat ↺

The strength of this feedback depends strongly on the electricity system. As electricity generation becomes less carbon-intensive, the emissions component of this loop can weaken.


13. Ozone-Centered Earth-System Feedbacks

Tropospheric ozone provides another example of how atmospheric chemistry can connect climate, ecosystems, and wildfire.

Atmospheric Pathway

Warming → Lightning → Ozone Formation → Additional Warming

Ecosystem Pathway

Ozone Exposure → Reduced Photosynthesis → Reduced Carbon Uptake → Higher Atmospheric CO₂ → Additional Warming

Wildfire Pathway

Ozone Exposure → Vegetation Stress → Increased Wildfire Vulnerability → Additional Ozone Precursors → More Ozone

Lightning–Wildfire Pathway

Warming → Lightning → Wildfires → Ozone Precursors → More Ozone

Cryosphere Pathway

Wildfires → Dark Carbonaceous Deposits on Snow and Ice → Reduced Albedo → Greater Solar Absorption → Warming

Permafrost Pathway

Wildfires → Permafrost Combustion and Thaw → CO₂ + CH₄ Release → Additional Warming

A more integrated pathway is:

Combustion → Ozone Formation → Vegetation Damage → Reduced Carbon Uptake → Increased Atmospheric CO₂ → Additional Warming → Increased Wildfire Activity → Additional Ozone Formation ↺


14. Water Vapor + Clouds: Coupled Feedbacks

Water vapor is a powerful greenhouse gas and responds rapidly to warming.

More Greenhouse Gases → Warming → More Atmospheric Water Vapor → Stronger Greenhouse Effect → Additional Warming ↺

Clouds operate differently and can exert both warming and cooling influences depending on their properties and location.

Low-Level Clouds → Greater Reflection of Incoming Sunlight → Cooling

High-Level Clouds → Greater Retention of Outgoing Infrared Radiation → Warming

Because water vapor and clouds are physically connected through atmospheric moisture, convection, condensation, and radiation, changes in one can influence the behavior of the other.


15. Emerging and Less-Studied Coupled Feedbacks

Several additional processes may participate in interconnected climate feedback networks:

🔥 Zombie fires
🟢 Greenland ice algae
🏞️ Thermokarst lakes
🦫 Arctic beaver expansion
🪲 Boreal forest beetles
🌿 Arctic shrubification
💨 Wetland methane pulses
⚡ Lightning feedbacks
🦠 Soil microbiome feedbacks

These processes should not all be treated as equivalent in strength. Some are well-established components of climate feedbacks, while others remain active areas of research.


16. Zombie Fires → Soot → Ice Melt → Methane

These systems do not operate independently. A relatively small perturbation can propagate through several connected processes, creating a climate-system example of cascading effects.

For example:

Warming → Zombie Fires → Soot Deposition on Snow and Ice → Lower Albedo → Faster Melting → Thermokarst Lakes → Methane Release → Additional Warming ↺

Broken into individual links:

Warming → Zombie Fires

Zombie Fires → Soot Deposition

Soot → Darker Snow and Ice

Darker Ice → Faster Melting

Faster Melting → Thermokarst Lakes

Thermokarst Lakes → Methane Release

Methane → Additional Warming ↺


17. Greenland Algae → Lower Albedo → More Meltwater

Biological processes can also interact with cryospheric feedbacks:

Warming → Greenland Ice-Algae Growth → Lower Surface Albedo → Greater Solar Absorption → Increased Meltwater → Conditions Favoring Further Algal Growth ↺

The simplified pathway is:

Warming → Greenland Algae → Lower Albedo → More Meltwater → Larger Algal Blooms ↺


18. Forest Loss → Reduced Rainfall → Further Forest Loss

Forest ecosystems can participate in coupled land–atmosphere feedbacks:

Deforestation → Reduced Evapotranspiration → Changes in Atmospheric Moisture Recycling and Rainfall → Greater Forest Stress → Additional Forest Loss ↺

Another carbon-cycle pathway is:

Reduced Forest Productivity → Lower Carbon Uptake → More Atmospheric CO₂ → Additional Warming → Greater Forest Stress → Further Productivity Loss ↺


19. An Integrated Cascade of Coupled Feedbacks and Tipping Elements

The individual pathways above can ultimately become interconnected into a much larger Earth-system network:

Polar Amplification → Weakened Equator-to-Pole Temperature Contrast → Atmospheric Circulation Changes → Arctic and Greenland Ice Loss

→ ICE–ALBEDO FEEDBACK:
Ice Loss → Darker Surface → Greater Solar Absorption → More Warming → More Ice Loss ↺

→ MELT–ELEVATION FEEDBACK:
Ice Loss → Lower Ice-Sheet Elevation → Warmer Atmospheric Exposure → Faster Surface Melt → Further Elevation Loss ↺

→ LAPSE-RATE FEEDBACK:
Arctic Warming → Changes in Vertical Temperature Structure → Altered Near-Surface Heat Retention → Additional Warming → More Ice Melt ↺

These cryospheric processes can then connect to ocean circulation:

Coupled Cryospheric Amplification → Freshwater Input to the North Atlantic → Reduced Salinity and Density → Potential AMOC Weakening → Atmospheric Pressure-Field and Storm-Track Changes

Changes in atmospheric circulation may then contribute to:

Greater Jet-Stream Waviness → Slower-Moving Rossby Waves → Persistent Blocking and Omega Blocks → Stalled Atmospheric Rivers + Prolonged Heat Domes + Drought–Flood Swings → Hydroclimatic Whiplash

The resulting impacts can propagate through human and ecological systems:

Hydroclimatic Whiplash → Agricultural Stress + Infrastructure Damage + Ecosystem Disruption + Public-Health Stress

Meanwhile, other tipping elements can become increasingly vulnerable:

Permafrost Tipping Element

Permafrost Thaw → CO₂ + CH₄ Release → Additional Greenhouse Forcing → Arctic Warming ↺

Boreal Forest Tipping Element

Warming + Drought + Wildfire → Forest Degradation → Reduced Carbon Uptake + Carbon Release → Additional Warming ↺

Amazon Rainforest Tipping Element

Warming + Drought + Fire → Reduced Evapotranspiration and Rainfall Recycling → Greater Drought → Forest Loss + Carbon Release → Additional Warming ↺

West Antarctic Ice-Sheet Tipping Element

Ice-Sheet Instability → Accelerated Ice Loss → Sea-Level Rise → Additional Cryospheric Stress

At the planetary scale, continued redistribution of land ice and water can also affect Earth’s mass distribution and rotational dynamics:

Global Land-Ice Loss + Water Redistribution → Planetary Mass Redistribution → Changes in Moment of Inertia → Changes in Rotational Dynamics → Potential Changes in Length of Day


The Central Concept

The critical distinction is between an individual feedback loop and a coupled feedback network.

A single feedback may amplify or dampen an initial perturbation. But when multiple feedbacks become connected, the output of one process can become the input to another:

Initial Warming → Feedback A → Feedback B → Feedback C → Tipping-Point Pressure → New Feedbacks → Additional Warming ↺

The result is not necessarily a single runaway process. Rather, it can be an increasingly interconnected Earth system in which multiple reinforcing feedbacks alter the probability, speed, and severity of transitions across different climate tipping elements.

That is the central significance of coupled feedback loops: the climate system can behave less like a collection of independent mechanisms and more like an interconnected network in which changes propagate across atmospheric, cryospheric, oceanic, ecological, chemical, and human systems.

bookmark_borderFeedback Examples

by Daniel Brouse and Sidd Mukherjee

Examples of complex feedback loop coupling:
Two of the most important are the lapse-rate feedback and the ice–albedo feedback. They operate through different physical mechanisms, but they are tightly coupled:

Lapse-Rate Feedback → Traps Heat Near the Surface

Ice–Albedo Feedback → Converts More Sunlight Into Heat

Together, they create a reinforcing loop:

Warming → Atmospheric Stabilization → Surface Heat Retention → Ice and Snow Loss → Lower Albedo → Greater Solar Absorption → More Warming

This coupling helps explain why the Arctic can warm substantially faster than the global average.

Warming → Ice/Snow Loss → Lower Albedo → More Solar Absorption → More Warming
warming → ice and snow loss → darker surface exposure → greater solar absorption → additional local warming → more ice loss

Greenhouse Forcing → Atmospheric Stability / Lapse-Rate Effects → More Near-Surface Heat Retention → Warmer Surface → Snow and Ice Loss → Lower Surface Albedo → More Solar Energy Absorbed → Additional Surface Warming → Further Snow and Ice Loss ↺

Lapse Rate → Keeps More Warming Concentrated Near the Surface → Ice–Albedo → Turns More Incoming Sunlight Into Absorbed Energy → Surface Warming → Snow & Ice Loss → Even Greater Solar Absorption → Additional Warming ↺

Global Warming → Arctic Amplification → Coupled Atmospheric + Cryospheric Feedbacks → Accelerated Snow and Ice Loss → Reduced Reflectivity + Greater Heat Retention → Further Warming → Increasing Cryospheric Instability → Potential Threshold Crossing ↺

This is the Melt–Elevation Feedback:
ice loss → lower surface elevation → warmer surrounding air → increased melting → additional ice loss → further elevation loss

ice-sheet thinning → lower elevation → warmer air exposure → faster melting → further thinning

Greenland ice loss → freshwater input → North Atlantic freshening → altered ocean density → AMOC weakening → major atmospheric and oceanic changes → secondary climate impacts

Primary Ice–Albedo Feedback
Global Warming → Ice & Snow Loss → Ice–Albedo Amplification → Greater Heat Absorption → Additional Warming ↺

Ice-Sheet Elevation Feedback
Ice-Sheet Mass Loss → Surface Elevation Decline → Warmer Atmospheric Exposure → Increased Melting → Additional Elevation Loss ↺

Greenland–AMOC Feedback Pathway
Greenland Ice Loss → Freshwater Entering North Atlantic → Salinity & Density Changes → AMOC Weakening → Global Atmospheric & Oceanic Disruption → Secondary Climate Feedbacks & Tipping Processes ↺

warming → permafrost thaw → greenhouse-gas release → additional warming

Arctic warming → reduced equator-to-pole temperature contrast → altered jet-stream behavior → atmospheric blocking → persistent heat dome → prolonged drought and drying

warm air → greater atmospheric moisture demand → increased evaporation and plant water loss → drying vegetation and soils → highly flammable fuels

extreme heat and drought → dry vegetation → wildfire → enormous heat column → pyrocumulonimbus formation → lightning and wind shifts → new ignitions → more wildfires

Arctic warming → atmospheric disruption → heat dome → drought → high VPD → dry forests → wildfire → pyrocumulonimbus → lightning → additional fires → massive smoke transport

warm ocean currents → basal melting → ice-shelf thinning → weakened structural restraint → increased ice discharge → rising sea levels

Arctic Amplification
Arctic Warming → Snow & Sea-Ice Loss → Darker Surfaces → Greater Solar Absorption → Additional Warming ↺

Arctic–Wildfire Feedback
Arctic Warming → Jet-Stream Disruption & Atmospheric Blocking → Persistent Heat Domes → Drought & High VPD → Boreal Forest Drying → Wildfire → Pyrocumulonimbus Storms → Lightning & New Fires → Massive Smoke Transport ↺

Cryospheric Mass-Loss Pathway
Warming → Snowpack Loss & Glacier Melting → Glacier Mass Loss → Sea-Level Rise

Antarctic Ice-Shelf Instability
Warming Ocean → Subsurface Ice-Shelf Melting → Ice-Shelf Thinning → Reduced Restraint on Grounded Ice → Accelerated Ice Discharge → Sea-Level Rise ↺

Ice & snow loss → greater solar absorption → Arctic warming → permafrost thaw → CH4 + CO2 release → more warming

Then wildfire adds another powerful connection:

Warming → more severe wildfire → CO2 emissions → vegetation & soil loss → accelerated permafrost thaw → additional CH4 + CO2 → further warming

The result is an increasingly interconnected climate system in which one feedback can strengthen another.

🧊 Ice loss
🔥 Wildfire
❄️ Permafrost thaw
💨 Methane release
🌡️ Additional warming
↻ Further tipping-point activation

Human emissions → warming → ice loss → permafrost thaw → methane and CO₂ release → more warming → greater wildfire and ecosystem disruption → additional greenhouse-gas release → further tipping-point pressure

Methane leak → approximately 10–12 years of intense methane warming → atmospheric oxidation → CO₂ → centuries of additional warming

Rising temperatures → Increased rainfall and flooding → Expansion of oxygen-poor wetlands → Faster microbial decomposition → Increased methane release → Additional warming

More warming → More methane release → More greenhouse warming → More ecosystem disruption → More methane release

Ice loss accelerates warming → warming destabilizes frozen carbon stores → microbial activity increases → methane emissions increase → methane adds additional warming → more tipping points become vulnerable

Arctic Warming → Sea-Ice Loss → Stronger Ice–Albedo Feedback → Additional Arctic Warming → Increased Permafrost Thaw → Accelerated Microbial Decomposition → Increased CH₄ Emissions → Additional Atmospheric Warming → Further Ice Loss & Permafrost Thaw ↺

Before tipping-point activation:
Human emissions → methane emissions → warming

As tipping points are crossed:
Human emissions → warming → permafrost and wetland changes → additional methane → more warming

With multiple interacting tipping points:
Warming → ice loss → greater solar absorption → permafrost thaw → methane release → additional warming → further tipping-point activation → additional greenhouse-gas release

Warming → ice loss → greater solar absorption → permafrost thaw → methane + CO₂ release → more warming → intensified wildfires → forest and soil carbon loss → accelerated permafrost thaw → additional greenhouse-gas release → further tipping-point activation

More Heat → Higher Cooling Demand → Greater Electricity Use → More Greenhouse Gas Emissions → More Global Warming → More Heat

The emerging Earth-system framework can be viewed as a series of interconnected feedback loops centered on ozone:

Lightning-Generated Tropospheric Ozone and Earth-System Feedbacks
Atmospheric Pathway
Warming → Lightning → Ozone → Warming

Ecosystem Pathway
Ozone → Reduced Photosynthesis → Reduced Carbon Uptake → Higher CO₂ → Warming

Wildfire Pathway
Ozone → Vegetation Stress → Increased Wildfire Risk → More Ozone

Lightning–Wildfire Pathway
Warming → Lightning → Wildfires → Ozone Precursors → More Ozone

Cryosphere Pathway
Wildfires → Brown Carbon → Reduced Albedo → Warming

Permafrost Pathway
Wildfires → Permafrost Combustion → CO₂ and CH₄ Release → Warming

Combustion → Ozone Formation → Vegetation Damage → Reduced Carbon Uptake → Increased Atmospheric CO₂ → Additional Warming → Increased Wildfire Activity → Additional Ozone Formation

Water Vapor + Clouds: Coupled Feedbacks Driving a Warmer Planet
More greenhouse gases → warming → more atmospheric water vapor → stronger greenhouse effect → additional warming.

Low-level clouds Reflect sunlight → cooling
High-level clouds Trap outgoing heat → warming

🔥 Zombie Fires
🟢 Greenland Ice Algae
🏞️ Thermokarst Lakes
🦫 Arctic Beaver Expansion
🪲 Boreal Forest Beetles
🌿 Arctic Shrubification
💨 Wetland Methane Pulses
⚡ Lightning Feedback
🦠 Soil Microbiome Feedback

These systems don’t operate independently.

A small change can trigger multiple connected responses that amplify one another—a climate-scale example of the Butterfly Effect.

For example:
Warming → Zombie Fires → Soot on Ice → Lower Albedo → Faster Melting → Thermokarst Lakes → Methane Release → More Warming

Warming → zombie fires
Zombie fires → soot deposition
Soot → darker snow and ice
Darker ice → faster melting
Faster melting → thermokarst lakes
Thermokarst lakes → methane release
Methane → additional warming

Likewise:
Warming → Greenland algae
Algae → lower albedo
Lower albedo → more meltwater
Meltwater → larger algal blooms

Deforestation → Reduced evapotranspiration → Less rainfall → More forest stress → Additional forest loss

Reduced forest productivity → Lower carbon uptake → More atmospheric CO₂ → Additional warming → Further forest stress

Polar amplification → weakened equator-to-pole temperature gradients → reduced thermal contrast → atmospheric circulation changes → accelerated Arctic and Greenland ice melt → ICE–ALBEDO FEEDBACK: ice loss → darker surface → greater solar absorption → more warming → more ice loss ↺ → MELT–ELEVATION FEEDBACK: ice loss → lower ice-sheet elevation → warmer air → faster surface melt → further elevation loss ↺ → LAPSE-RATE FEEDBACK: Arctic warming → weaker vertical temperature gradient → reduced atmospheric cooling efficiency → additional near-surface warming → more ice melt ↺ → coupled cryospheric amplification → freshwater input into the North Atlantic → reduced salinity + density → AMOC disruption / potential weakening → North Atlantic pressure-field + storm-track reorganization → greater jet-stream waviness → slower progression → amplified Rossby waves → persistent blocking + omega blocks + meridional flow → stalled atmospheric rivers + prolonged heat domes + drought–flood swings → hydroclimatic whiplash → agriculture + infrastructure + ecosystems + public health stress → PERMAFROST TIPPING ELEMENT: thaw → CO₂ + CH₄ release → additional greenhouse forcing → Arctic warming ↺ → BOREAL FOREST TIPPING ELEMENT: warming + drought + wildfire → forest degradation → reduced carbon uptake + carbon release → additional warming ↺ → AMAZON RAINFOREST TIPPING ELEMENT: warming + drought + fire → reduced evapotranspiration + rainfall recycling → greater drought → forest loss + carbon release → additional warming ↺ → WEST ANTARCTIC ICE-SHEET TIPPING ELEMENT: ice instability → accelerated ice loss → sea-level rise → additional cryospheric stress → global land-ice loss + groundwater redistribution → planetary mass redistribution → altered moment of inertia → rotational dynamics → slight rotational slowing → changes in length of day.

bookmark_borderWater Vapor, Clouds, and Climate Change: Two Very Different and Connected Feedbacks

by Daniel Brouse

Water vapor and clouds are closely related, but they are not the same thing—and they play very different roles in the climate system.

Water vapor is Earth’s most abundant and most important natural greenhouse gas. As the climate warms, the atmosphere can hold more water vapor, creating a powerful positive feedback: warming increases atmospheric moisture, and that additional water vapor traps more heat, causing additional warming. Under the Clausius-Clapeyron relationship, the atmosphere can hold roughly 7% more water vapor for every 1°C of warming, provided sufficient moisture is available.

Clouds, by contrast, have competing effects. Low clouds generally cool the planet by reflecting incoming sunlight back into space, while high clouds generally warm it by trapping outgoing infrared radiation. But this does not mean that their effects are currently neutral or cancel each other out.

The critical question is not simply whether clouds cool during the day and warm at night. It is how climate change is altering the amount, altitude, thickness, reflectivity, lifetime, and geographic distribution of different cloud types.

Current evidence indicates that these changes are producing a net climate feedback that does not simply cancel out the warming influence of increased greenhouse gases and water vapor. In particular, reductions or thinning of some highly reflective low-level clouds can allow more solar energy to reach the Earth’s surface, amplifying warming.

Water Vapor: A Powerful Positive Feedback

Unlike carbon dioxide, water vapor is primarily a feedback rather than the initial forcing responsible for today’s long-term warming.

As carbon dioxide and other greenhouse gases warm the atmosphere, warmer air can contain more moisture. That additional water vapor absorbs outgoing infrared radiation and strengthens the greenhouse effect.

This creates a reinforcing cycle:

More greenhouse gases → warming → more atmospheric water vapor → stronger greenhouse effect → additional warming.

Water vapor also contributes to changes in precipitation, atmospheric rivers, extreme rainfall, and other aspects of the hydrological cycle.

Clouds: Their Effects Do Not Simply Cancel

Clouds are more complicated than water vapor because they can exert both cooling and warming influences.

Low-level reflective clouds, such as stratocumulus, tend to cool the climate by reflecting incoming sunlight back into space.

High-level clouds, such as cirrus, tend to warm the climate because they allow much of the Sun’s shortwave radiation to enter while reducing the amount of infrared heat that escapes to space.

It is therefore tempting to assume that the cooling effect of clouds during the day is roughly canceled by their warming effect at night. That is not an adequate description of the changing climate system.

Cloud feedback depends on far more than the day-night cycle. It depends on:

  • cloud altitude
  • cloud thickness
  • cloud coverage
  • cloud reflectivity
  • cloud lifetime
  • geographic location
  • underlying surface conditions
  • atmospheric temperature and humidity
  • changes in atmospheric circulation

Climate change is altering these characteristics. Consequently, the cooling and warming effects of clouds are not remaining in a fixed equilibrium.

The relevant issue is the change in the balance.

If highly reflective low clouds become less extensive or thinner, more solar radiation reaches the ocean and land surface. At the same time, persistent or changing high clouds can continue to restrict the escape of infrared radiation.

The result is not a neutral cloud system. Some observed and modeled cloud changes act as positive feedbacks that add to global warming.

Why Changes in Low Clouds Matter

One of the most important climate questions is how global warming changes the abundance, thickness, altitude, and distribution of clouds—particularly low-level marine clouds.

Several mechanisms can alter these clouds.

Declining Relative Humidity

A warmer atmosphere can contain substantially more water vapor without necessarily becoming more saturated.

In some regions, changes in circulation and surface conditions can therefore produce lower relative humidity and less favorable conditions for cloud formation.

The result can be fewer or thinner clouds even while the total amount of atmospheric water vapor increases.

This illustrates an important distinction:

More water vapor does not necessarily mean more clouds.

Water vapor can increase the atmospheric greenhouse effect while conditions become less favorable for the formation or persistence of certain reflective clouds.

Cleaner Air and Reduced Aerosols

Air pollution produces aerosols that can serve as cloud-condensation nuclei, providing particles around which cloud droplets can form.

Successful reductions in sulfur dioxide and other particulate pollution have produced major public-health and environmental benefits. However, removing reflective aerosols can also remove some of the cooling that previously offset greenhouse warming.

The interaction between declining aerosol pollution, cloud formation, and climate is complex and varies geographically.

Changes in Atmospheric Circulation

Climate change is also altering atmospheric circulation patterns.

Changes in subtropical circulation, storm tracks, ocean temperatures, and atmospheric stability can shift where clouds form and how long they persist.

These changes can affect the distribution and characteristics of reflective low clouds and potentially amplify warming.

The Cloud Feedback

The basic relationship can be summarized as follows:

Cloud typeTypical direct effectClimate-change concern
Low-level cloudsReflect sunlight → coolingReductions or thinning allow more solar energy to reach the surface
High-level cloudsTrap outgoing heat → warmingChanges in altitude and properties can increase heat retention
Middle-level/mixed cloudsCan produce both effectsImpact depends on altitude, thickness, and composition

The key distinction is this:

Clouds have both cooling and warming effects, but climate change is changing the balance between those effects.

Therefore, saying that clouds “cool during the day and warm at night” does not establish that their overall climate impact is neutral.

A cloud system can have a net cooling effect today while simultaneously undergoing changes that reduce that cooling effect and thereby produce a positive cloud feedback.

This is an important distinction between cloud forcing and cloud feedback.

Clouds have historically produced a substantial net cooling influence on the climate. But if warming causes reflective low clouds to decrease or become less reflective, the planet loses some of that cooling. The resulting change itself constitutes an additional warming influence.

Regional Exceptions Matter

Cloud behavior is not uniform across the planet.

For example, the rapidly changing Arctic climate produces complex regional cloud responses as sea ice retreats and previously ice-covered ocean becomes exposed. Open water changes evaporation, atmospheric moisture, aerosols, and surface energy exchange. Marine biological activity can also influence atmospheric particles that participate in cloud formation.

Thus, even when a broad global tendency exists, regional cloud feedbacks can move in different directions.

The existence of regional exceptions does not mean that cloud feedback is neutral globally. It means that the climate system is heterogeneous and that different mechanisms can dominate in different locations.

The Bigger Picture

The key point is that water vapor and clouds should not be treated as interchangeable parts of the climate system.

Water vapor is a powerful greenhouse gas whose atmospheric concentration increases as the climate warms, providing a major positive feedback.

Clouds are different. They redistribute energy through both solar reflection and infrared heat trapping. But the balance between those effects is not fixed.

Climate change is modifying the cloud system itself and appears to be a positive feedback accelerating climate change.

This matters because the climate system responds to changes in Earth’s energy balance. Even a relatively small persistent shift toward greater absorption of solar energy or reduced escape of infrared radiation can accumulate over time.

Water vapor strengthens the greenhouse effect, while changing cloud behavior can alter how much additional energy the Earth absorbs and retains. Together, these coupled feedbacks can reinforce warming, accelerate climate-system changes, and increase the risk of triggering or amplifying tipping points.

bookmark_borderAmericans Are Feeling the Heat—But Fewer Believe Climate Change Is Happening

by Daniel Brouse

An AP-NORC poll reveals a deeply troubling contradiction in the American public’s understanding of climate change: Americans are increasingly experiencing the effects of extreme heat, yet fewer now believe climate change is actually happening.

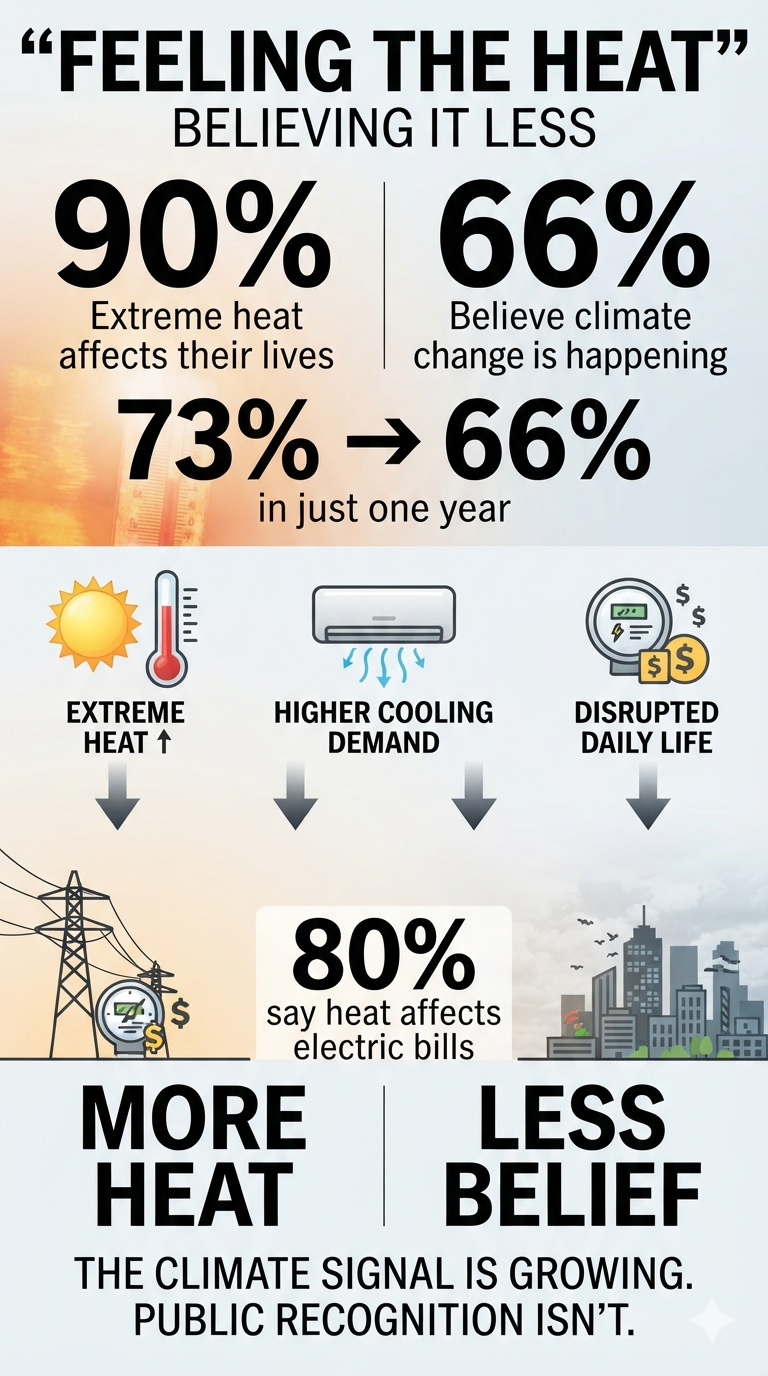
According to the poll, just 66% of Americans say climate change is happening, down sharply from 73% a year ago. That seven-percentage-point decline is particularly alarming because it comes at a time when Americans are reporting increasingly direct and disruptive experiences with extreme heat.

The disconnect raises an important question: How can people increasingly experience the consequences of a changing climate while becoming less likely to recognize climate change as the cause?

Extreme Heat Is Becoming Personal

The same poll found that 90% of Americans say extreme heat has affected their lives in some way, up from 83% in July 2024.

The impacts aren’t confined to abstract concerns about the environment. Americans report that extreme heat is affecting everyday life, including:

  • Electricity bills
  • Outdoor activities
  • Sleep
  • Travel and vacations
  • Daily routines

Perhaps most significantly, about 80% say extreme heat has affected their electricity bills, up from 69% in 2024.

In the Midwest, the increase is even more striking: 44% now say extreme heat has had a major impact on their electricity bills, compared with 29% two years ago.

That is climate change translated into something tangible: a higher household expense.

The Perception–Attribution Gap

The most important finding may not be the increase in heat-related disruption. It may be the growing gap between what Americans experience and what they believe is causing it.

The survey presents two seemingly contradictory trends:

90% say extreme heat has affected their lives.

Yet only 66% say climate change is happening.

And that 66% figure is down from 73% just one year ago.

This is a remarkable perception–attribution gap.

Americans can recognize that summers are becoming more difficult, electricity costs are rising, outdoor activities are being disrupted and extreme heat is affecting sleep—without necessarily connecting those experiences to a changing climate.

The result is a potentially dangerous disconnect between physical reality and public understanding.

Political Division Is Part of the Explanation

Political ideology continues to play an enormous role in how Americans interpret climate-related experiences.

Democrats are substantially more likely than Republicans to describe extreme heat as having a major impact on their lives. But that doesn’t mean Republicans aren’t experiencing the same heat.

The distinction is increasingly about interpretation and attribution.

People across the political spectrum can experience the same 100-degree day. They can experience the same oppressive humidity, pay the same higher electricity bill and face the same restrictions on outdoor activity.

But they may reach very different conclusions about why it is happening.

That distinction matters because climate change doesn’t require public agreement in order to produce physical consequences.

Climate Change Is Becoming an Economic Issue

The AP-NORC findings also demonstrate why climate change should not be viewed exclusively as an environmental issue.

Extreme heat creates a chain of consequences:

Higher temperatures → greater air-conditioning demand → higher electricity consumption → increased household costs

But that is only one pathway.

Extreme heat can also affect worker productivity, agriculture, infrastructure, public health, insurance losses and energy-grid reliability.

The household electricity bill may therefore be only the first visible economic manifestation of a much larger systemic problem.

The public doesn’t need to understand atmospheric physics to experience these consequences.

They simply need to notice that something is different.

The Most Alarming Finding Isn’t the Heat

The increase in extreme-heat impacts is concerning, but the seven-point decline in belief that climate change is happening may be even more alarming.

The country is experiencing a growing number of climate-related disruptions while simultaneously becoming less certain—or less willing—to identify climate change as the underlying cause.

That creates a dangerous situation for public policy.

Democratic societies depend upon the public recognizing problems before governments can effectively address them. If the physical impacts become increasingly severe while public recognition of their underlying causes declines, political pressure for adaptation and mitigation can weaken precisely when the need for action is growing.

This creates a potential feedback loop:

More climate disruption → greater personal impacts → greater economic costs → political polarization → weaker recognition of climate change → less public support for climate action → greater future vulnerability

That is not merely a communications problem.

It is a systemic risk.

Experience Is Increasing Faster Than Understanding

The AP-NORC poll doesn’t measure the physical climate system. It measures what Americans are experiencing and what they believe.

Those are different things.

The survey cannot establish how much of an individual’s electricity bill, sleep disruption or outdoor inconvenience is attributable specifically to climate change. Establishing those causal relationships requires observational climate data and scientific attribution studies.

But the poll does reveal something extremely important about the human response to climate change.

The consequences are becoming increasingly personal while public recognition of climate change is moving in the opposite direction.

That should concern everyone, regardless of political affiliation.

The challenge is no longer simply convincing people that the climate is changing.

It is explaining why their increasingly familiar experiences—extreme heat, higher cooling demand, disrupted outdoor activities, poor sleep and growing economic costs—are connected to a much larger physical system.

Americans may not agree about climate change.

But increasingly, they are living with its consequences.

And the most alarming finding from this poll is that as those consequences become harder to escape, fewer Americans say climate change is actually happening: 66% today, compared with 73% a year ago.

America Is an International Outlier on Climate Change

The decline in American belief becomes even more concerning when viewed against the rest of the world.

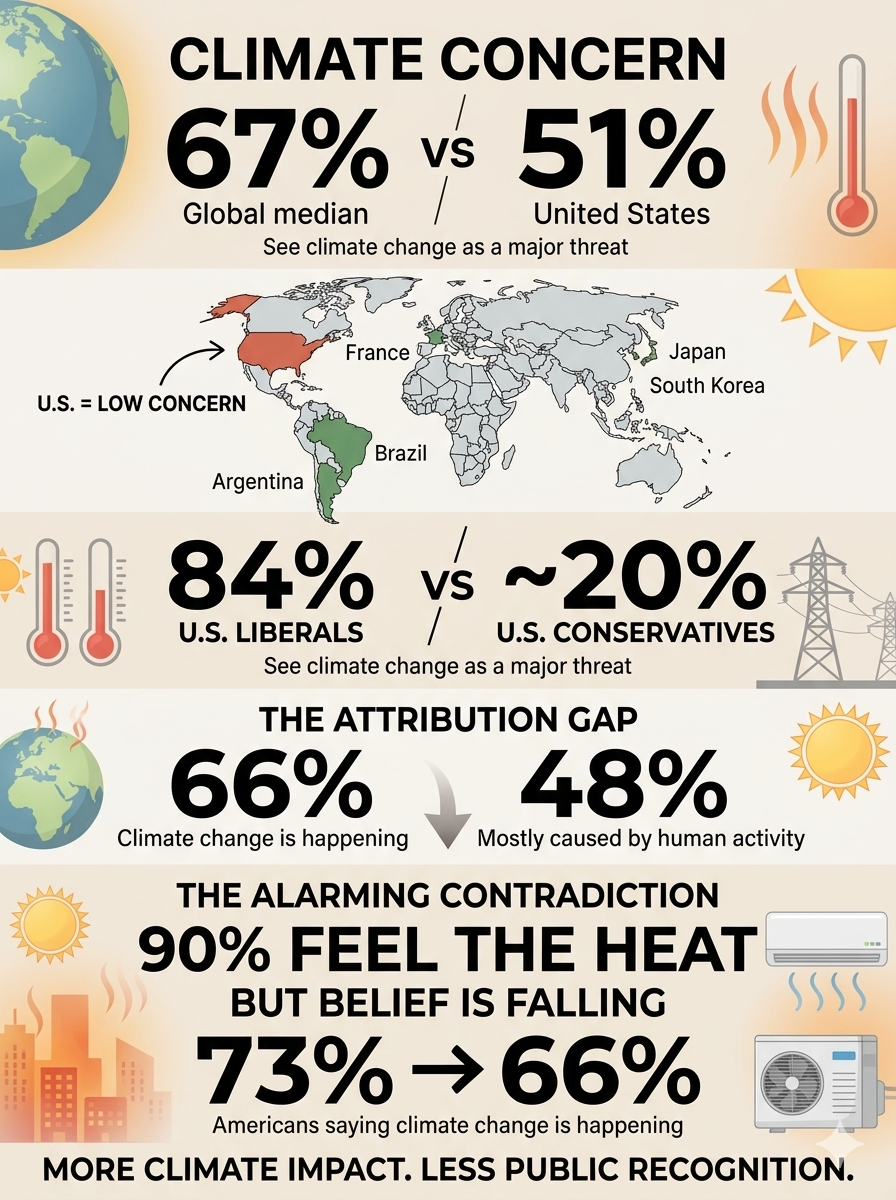
A 2025 Pew Research Center international survey of 25 countries found that a global median of 67% of respondents considered climate change a major threat to their country. In the United States, however, only 51% said the same—a gap of 16 percentage points.

The U.S. was among the least concerned countries surveyed. Americans were less likely than respondents in 13 of the 16 high-income countries included in the survey to view climate change as a major threat. In countries such as Argentina, Brazil, France, Japan and South Korea, roughly 80% of respondents regarded climate change as a major threat.

The difference is particularly striking because the United States is not insulated from climate impacts. Americans are experiencing extreme heat, rising cooling demand, disrupted outdoor activities and other consequences of a warming climate, yet concern about climate change remains comparatively low.

The American Divide Is Also Unusually Political

The international comparison becomes even more revealing when political ideology is considered.

Pew found that approximately 84% of U.S. liberals regarded climate change as a major threat, compared with only about 20% of U.S. conservatives. That enormous gap makes the United States an international outlier in the degree to which climate change has become politically polarized.

The result is a remarkable paradox.

Americans across the political spectrum can experience the same heat wave, pay the same electricity bill and endure the same disruption to their daily lives. Yet they may reach dramatically different conclusions about what those experiences mean.

The disagreement therefore isn’t simply about the physical environment. It is increasingly about how Americans interpret the physical environment.

Believing the Climate Is Changing Is Not the Same as Accepting Why

Another Pew measure illustrates the problem even more clearly.

In 2026, only 48% of Americans said the Earth is warming mostly because of human activity. That is substantially lower than the 66% who currently say climate change is happening in the AP-NORC poll.

The difference is crucial.

A person can acknowledge that the climate is changing without accepting that human activity is primarily responsible for that change. Others may accept human-caused warming but disagree about its severity, consequences or appropriate policy response.

This creates several layers of public perception:

Is the climate changing?

↓

Is human activity causing it?

↓

Is it becoming dangerous?

↓

Should government and society act?

Americans can answer those questions very differently.

An Alarming Combination

Taken together, the international and domestic polling reveals a troubling pattern:

90% — say extreme heat has affected their lives

80% — say heat has affected their electricity bills

73% → 66% — Americans saying climate change is happening

51% — Americans calling climate change a major national threat

48% — Americans saying warming is mostly caused by human activity

The numbers measure different things and should not be treated as interchangeable. But together they reveal a striking disconnect between experience, attribution and concern.

The United States is already an international outlier in climate skepticism and political polarization. Now, at a time when Americans report increasingly personal impacts from extreme heat, the share saying climate change is happening has fallen seven percentage points in only one year.

That may be the most troubling finding of all.

The physical climate signal is becoming harder to escape, while public recognition of that signal is moving in the opposite direction.

bookmark_borderStrategic Petroleum Reserve Falls to Lowest Level Since 1983

As of July 31, 2026, the U.S. Strategic Petroleum Reserve (SPR) held approximately 304.8 million barrels of crude oil, its lowest level since March 1983.

From its historic peak of roughly 726 million barrels in 2009, the SPR has experienced a cumulative drawdown of approximately 421 million barrels—about a 58% reduction. The decline has been driven primarily by major emergency releases following Russia’s 2022 invasion of Ukraine and subsequent supply disruptions associated with instability in the Middle East in 2026.

The U.S. Energy Information Administration (EIA) estimates that the reserve could eventually fall to approximately 243 million barrels as currently authorized emergency release schedules conclude.

Strategic Risk: Erosion of U.S. Energy Security

The primary risk of reducing the SPR to approximately 243 million barrels is a severe loss of national energy security and geopolitical leverage during a major global crisis.

At that level—near the lowest inventory in more than four decades—the United States would have substantially less capacity to respond to an extended disruption in global oil supplies. A depleted reserve could also reduce the credibility and effectiveness of the SPR as a deterrent against supply shocks, geopolitical coercion, or major disruptions to global petroleum markets.

Structural and Infrastructure Risks

Cavern Structural Integrity

The SPR is stored in underground salt caverns that require careful management of pressure, oil levels, and cavern conditions. Repeatedly moving crude oil and fresh water into and out of these caverns can alter the physical characteristics of the salt formations and potentially increase operational and structural risks.

Maintaining the integrity of the caverns becomes increasingly important as the reserve is drawn down because the SPR’s ability to rapidly refill or sustain emergency withdrawals depends on the continued reliability of this underground storage infrastructure.

International Energy Agency Compliance

A substantially reduced SPR could also complicate U.S. compliance with International Energy Agency (IEA) emergency-stockholding requirements.

IEA member countries are generally required to maintain emergency oil stocks equivalent to at least 90 days of net oil imports. The relevant measure, however, is based on a country’s total qualifying emergency stocks—not simply the number of barrels held in the SPR. Therefore, the U.S. position must be evaluated using the full national stockholding calculation, including other qualifying inventories.

The Strategic Concern

The SPR was designed as a national insurance policy against severe and prolonged disruptions in petroleum supplies. Reducing the reserve by more than half from its 2009 peak fundamentally changes the country’s ability to absorb a major energy shock.

If inventories approach 243 million barrels, the United States would enter a period in which rebuilding the reserve could become increasingly important but potentially difficult. Large-scale purchases to replenish the SPR would require substantial funding, available crude supplies, suitable market conditions, and sufficient time.

The central strategic issue is therefore not simply how many barrels remain, but whether the United States retains enough readily deployable petroleum reserves to withstand a prolonged global supply disruption while simultaneously preserving the infrastructure, flexibility, and geopolitical leverage needed to respond to the next crisis.

bookmark_borderWildfire Catastrophe Bonds Surge as Insurers Transfer Record Climate Risk to Capital Markets

by Sidd Mukherjee and Daniel Brouse

A New Era of Climate Risk Finance

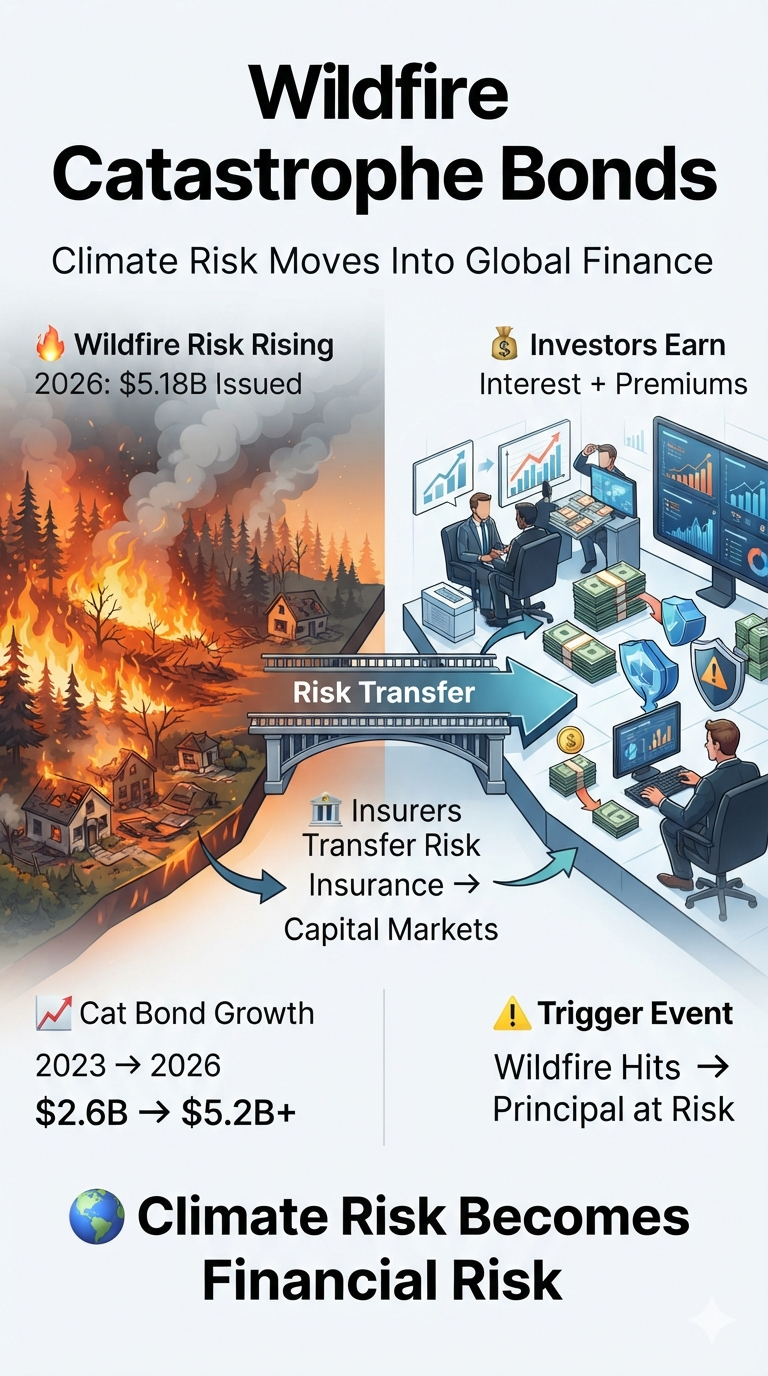
Wildfire-exposed catastrophe bond issuance has surged to $5.183 billion year-to-date in 2026, rapidly approaching the full-year record of $5.55 billion set in 2025. Driven by escalating wildfire losses, expanding climate risks, and increasingly sophisticated risk models, insurers are turning to global capital markets to transfer unprecedented levels of wildfire exposure.

Catastrophe bonds—often called cat bonds—allow insurers and governments to shift extreme disaster risks away from traditional insurance markets and onto investors. Investors receive attractive returns if a defined catastrophe does not occur, but may lose some or all of their principal if a triggering event causes significant losses.

The rapid growth of wildfire-linked cat bonds reflects a fundamental shift: wildfire is no longer viewed as a regional insurance problem but as a major global financial risk.


Wildfire Cat Bond Issuance Reaches Historic Levels

According to data compiled by Artemis, wildfire-related risk capital has experienced dramatic multi-year growth:

  • 2023: $2.57 billion issued
  • 2024: $2.84 billion issued
  • 2025: Record $5.55 billion issued
  • 2026 (year-to-date): $5.183 billion issued

The acceleration reflects rising insured wildfire losses, increasing pressure on traditional insurers, and investor demand for alternative assets that are not closely correlated with stocks and bonds.


Wildfire Risk Becomes a Major Alternative Asset Class

From Niche Exposure to Global Investment Market

Wildfire risk is rapidly evolving from a specialized insurance concern into a standalone catastrophe-risk asset class. Investors are increasingly attracted to catastrophe bonds because disaster events generally have little relationship to traditional financial markets.

Unlike stocks, bonds, or commodities, catastrophe bonds are driven primarily by physical climate events rather than economic cycles.

Advanced Climate Risk Modeling

Improved modeling capabilities have increased investor confidence. Companies such as Verisk and Moody’s have developed increasingly sophisticated catastrophe models that incorporate updated climate data, changing fire behavior, and evolving exposure patterns.

These models help investors evaluate wildfire probability, potential losses, and appropriate risk premiums.

Human Mitigation Changes the Risk Equation

Wildfire risk differs from many natural hazards because human actions can influence outcomes. Measures such as vegetation management, defensible space creation, utility improvements, and community fire planning can alter expected losses and affect catastrophe bond risk assessments.


Key Sponsors and Expanding Markets

California FAIR Plan Returns to the Cat Bond Market

California’s insurer of last resort, the California FAIR Plan, returned to the catastrophe bond market through the Golden Bear Re Ltd. Series 2026-2 transaction, successfully raising its target to $400 million.

The move highlights the growing difficulty of relying solely on traditional insurance markets in regions facing persistent wildfire threats.

Mercury General Targets Fire Risk Transfer

Mercury General Corporation sponsored the Luca Re Ltd. Series 2026-1 catastrophe bond transaction, targeting $150 million in fire-related reinsurance protection.

European Insurers Explore Wildfire Risk Transfer

Although wildfire catastrophe bond issuance remains heavily concentrated in California, increasingly severe wildfire seasons are pushing European insurers to explore capital-market solutions and alternative risk-transfer structures.


How Catastrophe Bonds Work

A catastrophe bond transfers disaster risk from an insurer to investors.

The insurer pays investors a premium for assuming the risk. Investors receive regular interest payments, but their principal is placed at risk if a predefined catastrophe occurs.

How Investors Make Money

1. Regular Interest Payments

Investors receive monthly or quarterly coupon payments that compensate them for accepting catastrophe exposure.

2. Risk Premium Spread

Sponsors pay an elevated interest spread because investors are taking on the possibility of losing principal.

3. Collateral Yield

The invested principal is typically held in a secure collateral account that generates additional low-risk interest income.

4. Total Return

The investor’s return combines the catastrophe bond premium spread and collateral investment yield.


How Investors Can Lose Their Principal

Binary Catastrophe Risk

If a wildfire reaches the bond’s predetermined trigger conditions, investors may lose part or all of their principal.

Immediate Capital Transfer

When triggered, the lost principal is transferred to the insurance sponsor to help cover wildfire claims.

No Insurance Company Default Required

Unlike traditional corporate bonds, investors do not lose money because an insurer fails financially. The catastrophe itself triggers the loss.

Full Return Without Trigger

If no qualifying wildfire occurs during the bond term—typically three to five years—the investor receives the full principal back at maturity.


How Wildfire Cat Bond Triggers Work

Indemnity Triggers

Payments are based on the sponsor’s actual insured losses from a wildfire event.

Example: An insurer suffers billions of dollars in wildfire claims, triggering payment from the catastrophe bond.

Parametric Triggers

Payments are based on measurable physical conditions rather than financial losses.

Examples:

  • Acres burned
  • Fire intensity
  • Geographic location
  • Wind conditions
  • Temperature thresholds

Industry Loss Triggers

Payments are based on total insurance industry losses from a catastrophe, calculated by independent organizations such as catastrophe loss index providers.


Climate Risk Moves Into Global Finance

The rapid expansion of wildfire catastrophe bonds signals a major transformation in how society manages climate risk. As extreme wildfire seasons become more frequent and expensive, insurers are increasingly relying on financial markets to absorb losses that traditional insurance systems can no longer easily contain.

Wildfire risk is becoming not only an environmental challenge but also a major test of global financial resilience.

The Major Perils Behind the Global Catastrophe Bond Market

Tropical cyclones and earthquakes remain the two foundational pillars of the global catastrophe bond market, traditionally accounting for a large share of the roughly $65.6 billion in outstanding risk capital. Wildfire, however, has rapidly expanded into a significant standalone risk category as insurers confront escalating losses and growing climate exposure.

The catastrophe bond market now spans a broad spectrum of natural, human-caused, and emerging systemic risks.

Core Property Perils

Tropical Cyclones — Hurricanes and Typhoons
Tropical cyclones are among the largest sources of catastrophe bond risk. Coverage is concentrated in U.S. hurricanes, particularly along Florida, the Gulf Coast, and the Eastern Seaboard, as well as Japanese typhoons and Australian cyclones.

Earthquakes
Earthquake risk represents one of the longest-established and most consistently modeled catastrophe bond perils. Major exposure centers include California, the Pacific Northwest, Japan, and New Zealand, where severe seismic events can generate enormous insured losses.

Severe Convective Storms
This increasingly important category covers highly localized but frequent atmospheric hazards, including tornadoes, severe hail, and straight-line winds such as derechos. Repeated losses from these events have become a significant source of claims for U.S. property insurers.

Wildfires
Wildfire has rapidly evolved from a relatively specialized exposure into a major standalone catastrophe bond peril. California remains the dominant market, but growing wildfire losses are driving interest in risk-transfer solutions across other regions.

Winter Storms and Floods
Catastrophe bonds can also protect insurers against extreme winter weather, including freezing events, heavy snowfall, ice damage, and infrastructure failures, as well as coastal and inland flooding.

Emerging and Specialized Perils

Cyber Risk
Cyber catastrophe bonds are an emerging non-natural peril designed to protect insurers against systemic cyber events. Potential triggers include widespread cloud-service disruptions, ransomware attacks, or failures of critical digital infrastructure.

Life, Health, and Mortality Risk
Life and health catastrophe securities can transfer the risk of sudden, extreme increases in mortality or health-related losses. Pandemic-scale events represent one potential source of catastrophic exposure.

Operational and Terrorism Risk
Specialized catastrophe structures have also been used to transfer extreme human-caused risks, including terrorism and major operational disruptions affecting businesses, infrastructure, or public institutions.

Multi-Peril vs. Standalone Catastrophe Bonds

Catastrophe bonds do not always cover a single peril. Many transactions combine several risks into a multi-peril structure, allowing insurers to diversify their exposure and potentially provide investors with a broader risk profile.

For example, a single transaction may combine U.S. named storms, earthquakes, severe convective storms, and wildfire under one bond.

This structure is important because catastrophe bonds can function much like a portfolio of climate and disaster risks: investors are exposed to multiple potential events, while insurers gain protection against losses that could otherwise overwhelm traditional reinsurance capacity.

A Market Expanding Beyond Traditional Disasters

The evolution of the catastrophe bond market reflects a broader transformation in global risk. What began primarily as a mechanism for transferring hurricane and earthquake risk has expanded into a sophisticated financial system capable of pricing and transferring exposure to wildfires, severe storms, floods, cyberattacks, pandemics, and other low-probability, high-impact events.

As climate change increases the frequency, severity, geographic reach, or financial consequences of certain extreme events, catastrophe bonds are becoming an increasingly important bridge between physical risk, insurance markets, and global investment capital.

bookmark_borderMethane: A Rapid Link Between Feedbacks and Tipping Points

by Daniel Brouse

Introduction: The Fast-Moving Greenhouse Gas Accelerating Climate Change

Methane has become a rapid link between climate feedbacks and tipping points.

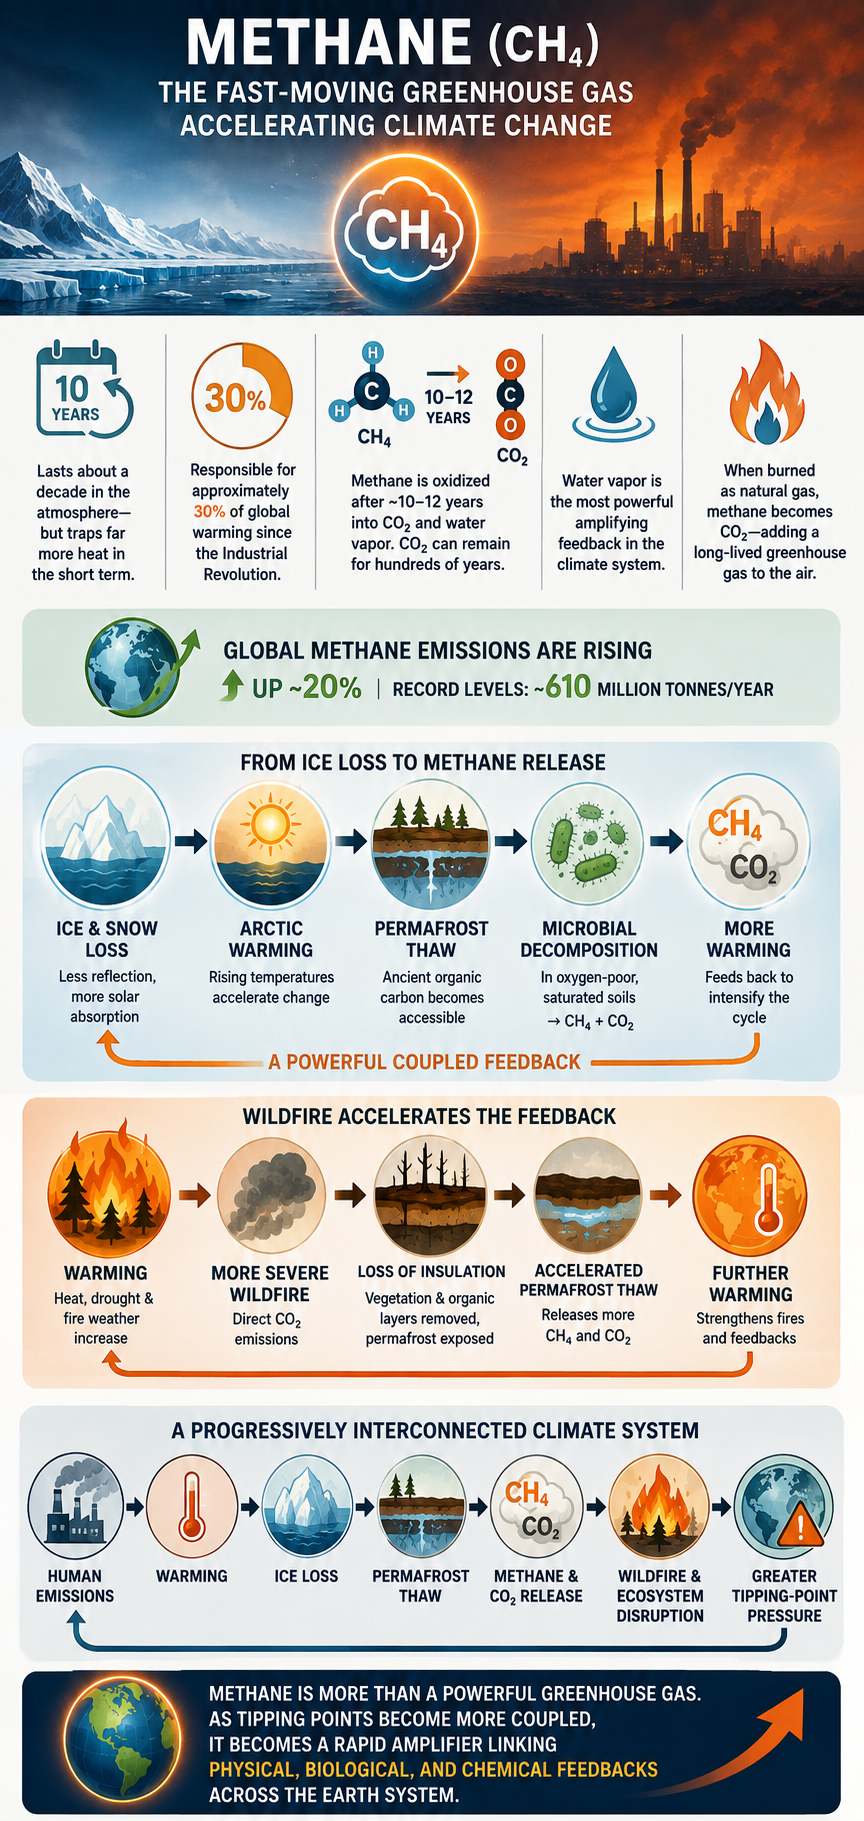
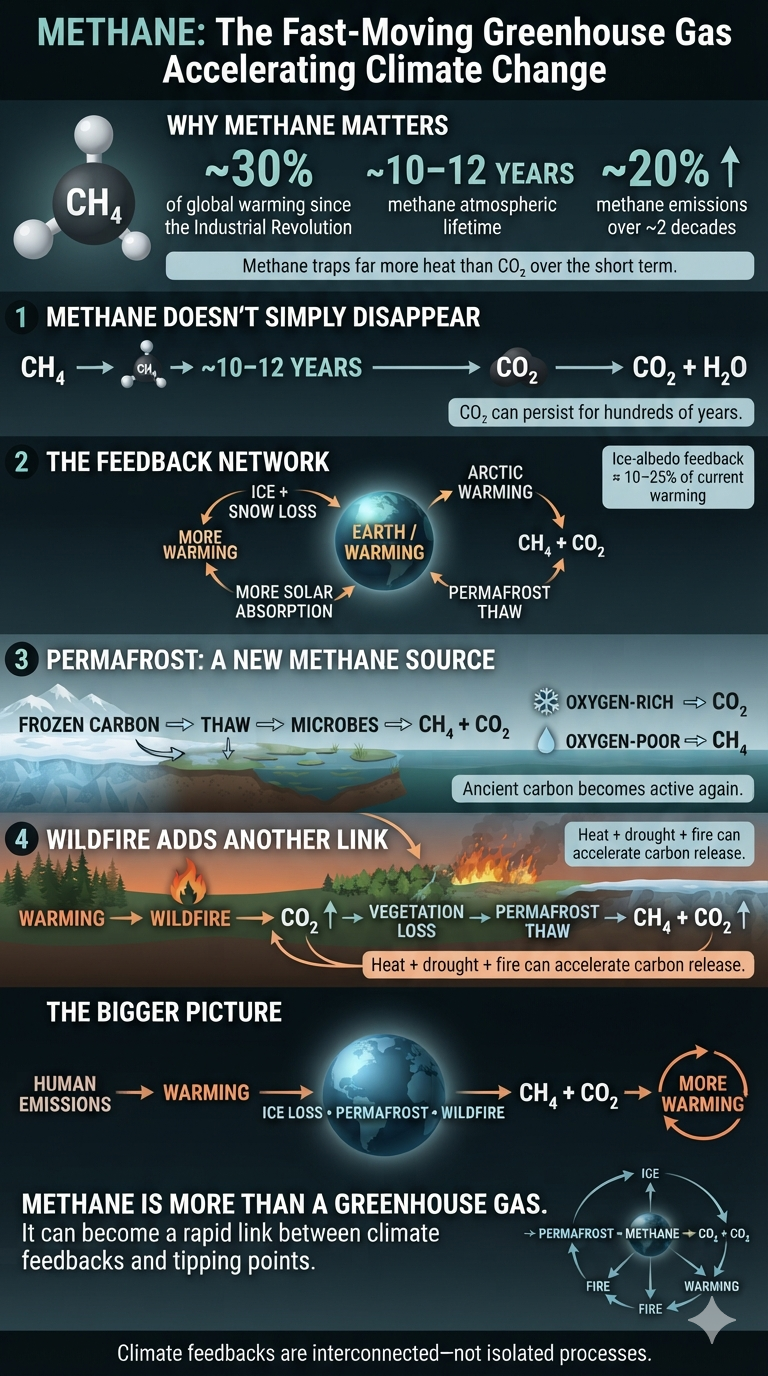
Methane (CH₄), the primary component of natural gas, is one of the most powerful greenhouse gases driving modern climate change. Although methane remains in the atmosphere for only about a decade—far less time than carbon dioxide (CO₂)—it traps substantially more heat over short time horizons, making it a critical driver of near-term warming. Additionally, when methane is oxidized after roughly 10–12 years, its carbon is ultimately converted into CO₂, which can remain in the atmosphere and continue influencing the climate system for hundreds of years.

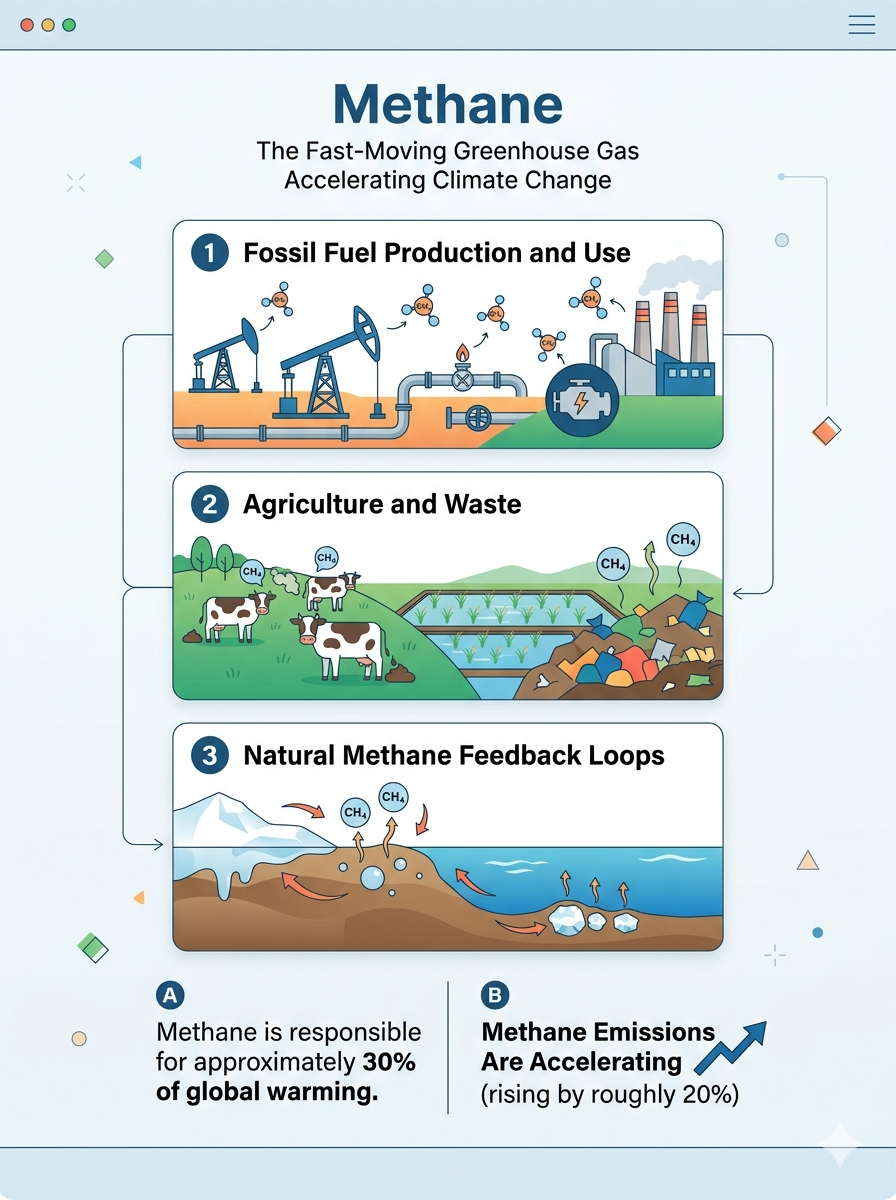
Methane is responsible for approximately 30% of the global warming experienced since the Industrial Revolution. It also contributes to longer-term warming because atmospheric methane is eventually oxidized primarily into carbon dioxide and water vapor. Water vapor is the most powerful amplifying feedback in the climate system, intensifying warming initiated by other greenhouse gases. When methane is burned as natural gas, its carbon is converted directly into CO₂, adding a long-lived greenhouse gas to the atmosphere.

Global methane emissions have increased dramatically over the past two decades, rising by roughly 20% and reaching record levels of approximately 610 million tonnes annually. The growing concern, however, is not simply the amount of methane being emitted by human activities. It is the increasing number of coupled climate feedbacks capable of generating additional methane as the planet warms.

One of the most important connections begins with the ice-albedo feedback. The ice-albedo effect is estimated to account for approximately 10–25% of current global warming. As snow and ice melt, darker land and ocean surfaces absorb more solar radiation rather than reflecting it back into space, amplifying regional and global warming. The ice-albedo feedback does not directly inject greenhouse gases into the atmosphere. Instead, its significance is that it can accelerate other processes that do.

Among the most important is permafrost thaw. Increasing Arctic temperatures are penetrating frozen soils that contain enormous quantities of ancient organic carbon. As permafrost thaws, previously frozen organic matter becomes accessible to microorganisms. Under oxygen-rich conditions, decomposition primarily produces CO₂. In saturated, oxygen-poor environments, however, microbial decomposition can produce methane (CH₄).

The result is a newly coupled climate feedback:

Ice and snow loss → greater solar absorption → Arctic warming → permafrost thaw → microbial decomposition → CH₄ + CO₂ → additional warming

This process is particularly concerning because permafrost thaw can occur much more rapidly than the millennial timescales often associated with gradual carbon release. Abrupt thaw, thermokarst formation, changing hydrology, and wildfire can accelerate the mobilization of previously frozen carbon over years to decades.

Wildfire adds another important connection. Increasing heat, drought, and changes in vegetation and fire weather are contributing to more severe and persistent wildfire conditions in some northern ecosystems. Fires release large quantities of CO₂ directly into the atmosphere while simultaneously removing vegetation and insulating organic layers that protect permafrost from summer heat.

In boreal regions of Canada and Siberia, this creates another powerful coupled feedback:

Warming → more severe wildfire → direct CO₂ emissions → loss of insulating vegetation and soil → accelerated permafrost thaw → additional CO₂ and CH₄ → further warming

The methane feedback therefore cannot be considered in isolation. It is increasingly embedded within a network of interacting climate feedbacks and tipping points.

As warming approaches and crosses critical thresholds, the climate system can shift from one dominated primarily by direct human greenhouse-gas emissions toward one in which natural feedbacks increasingly contribute additional greenhouse gases. Ice loss can accelerate permafrost thaw; permafrost thaw can increase methane and CO₂ emissions; wildfire can accelerate both atmospheric CO₂ accumulation and permafrost degradation; and the resulting warming can intensify the original processes.

The central concern is therefore not simply that methane emissions are increasing. It is that warming itself is increasingly activating new methane sources and strengthening existing feedbacks at the same time that other tipping points are being approached or crossed.

This creates a progressively more interconnected climate system:

Human emissions → warming → ice loss → permafrost thaw → methane and CO₂ release → more warming → greater wildfire and ecosystem disruption → additional greenhouse-gas release → further tipping-point pressure

Methane is consequently more than a powerful greenhouse gas. As climate tipping points become increasingly coupled, it can become a rapid amplifier linking physical, biological, and chemical feedbacks across the Earth system.


The Heat-Trapping Power of Methane

A Short-Lived but Extremely Powerful Greenhouse Gas

Methane has a unique climate profile:

CharacteristicRaw Methane (CH4CH_4CH4​)Combusted Methane (CO2CO_2CO2​)
Immediate Heat-Trapping EffectExtremely highModerate
Global Warming Potential (20 years)More than 80 times stronger than CO2CO_2CO2​Baseline
Atmospheric LifespanAbout 10–12 yearsCenturies
Primary Climate RiskLeaks, venting, and natural feedbacksLong-term accumulation after combustion

Because methane is so powerful in the short term, rapid methane reductions can have an immediate effect on slowing global warming. However, continued emissions create a dangerous cycle because warming itself can trigger additional natural methane releases.


Methane’s Two Pathways to Carbon Dioxide

A critical question is often overlooked when comparing natural gas combustion with methane emissions:

If methane eventually breaks down into carbon dioxide in the atmosphere, does allowing methane to escape ultimately produce the same amount of CO₂ as burning it?

In terms of carbon atoms, essentially yes. One molecule of methane (CH₄) contains one carbon atom. Whether that methane is burned immediately or eventually oxidized in the atmosphere, that carbon can ultimately become approximately one molecule of CO₂.

But the climate consequences are dramatically different because of the pathway and timing.

1. Combustion: Immediate Conversion to CO₂

When methane is burned in a power plant, furnace, stove, engine, or flare, the conversion occurs almost immediately:

CH₄ + 2O₂ → CO₂ + 2H₂O

The carbon in methane is converted directly into carbon dioxide.

The climate consequence is therefore dominated by long-lived CO₂, which remains in the atmosphere and affects the climate system for centuries or longer.

But combustion also eliminates methane’s period of extremely strong short-term heat trapping.

2. Atmospheric Oxidation: Methane First, CO₂ Later

When methane escapes directly into the atmosphere, it does not immediately become CO₂.

Instead, atmospheric chemistry gradually oxidizes methane, primarily through reactions involving hydroxyl radicals (OH). The process occurs through a series of intermediate chemical reactions before the carbon ultimately becomes CO₂.

Methane has an atmospheric lifetime of roughly a decade, meaning that a large fraction of an emission is removed from the atmosphere over approximately 10–12 years.

During that period, however, the methane itself is an exceptionally powerful greenhouse gas.

The sequence is therefore:

Methane leak → approximately 10–12 years of intense methane warming → atmospheric oxidation → CO₂ → centuries of additional warming

This creates a crucial distinction:

Burning methane converts it to CO₂ immediately.

Leaking methane delays the CO₂ conversion—but adds a period of extremely powerful methane warming first.

That is why preventing methane leakage can produce a disproportionately large near-term climate benefit.

Why the Carbon Source Matters

The eventual conversion of methane into CO₂ does not mean that all methane emissions have identical climate consequences.

The critical distinction is where the methane’s carbon came from.

Fossil Methane: Adding Ancient Carbon

Methane extracted from natural gas and other fossil fuel deposits contains carbon that has been isolated from the active atmosphere-biosphere carbon cycle for millions of years.

When fossil methane is:

  • burned, its carbon becomes CO₂ immediately;
  • leaked, its carbon initially produces powerful methane warming and is then largely converted into atmospheric CO₂.

Either way, fossil methane represents a net transfer of geological carbon into the active atmosphere-climate system.

Biogenic Methane: Carbon Cycling Through the Biosphere

Methane produced by livestock, wetlands, and other biological processes is different.

Much of this methane originates from carbon that plants recently removed from atmospheric CO₂ through photosynthesis.

The simplified cycle is:

Atmospheric CO₂ → Plants → Organic matter → Methane → Atmospheric CO₂

This is part of the short-term biological carbon cycle, rather than the introduction of ancient fossil carbon.

That distinction, however, does not make biogenic methane harmless.

Methane can produce substantial warming during the decade or so that it remains in the atmosphere. Its eventual return to CO₂ does not erase that temporary but powerful climate forcing.

The Key Distinction

The important question is therefore not simply:

“Does methane eventually become CO₂?”

It does.

The more important questions are:

“What happens before it becomes CO₂?”

and

“Where did its carbon come from?”

That distinction explains why methane is such a critical climate-control target.

Fossil methane:

Ancient carbon → methane leak → intense near-term warming → CO₂ → long-term warming

Biogenic methane:

Atmospheric CO₂ → plants → methane → intense near-term warming → CO₂

The chemistry may ultimately return methane’s carbon to CO₂, but the climate system experiences the methane phase first—and that phase is extraordinarily powerful.

Major Sources of Methane Emissions

Methane emissions come from both human activities and natural systems.

1. Fossil Fuel Production and Use

The fossil fuel industry remains one of the largest sources of human-caused methane emissions.

Major sources include:

  • Oil and natural gas extraction: methane leaks during drilling, processing, storage, and transportation.
  • Coal mining: methane trapped in coal seams escapes during extraction.
  • Natural gas infrastructure: pipelines, compressors, and storage facilities can release large quantities of methane.

Despite industry commitments to reduce leakage, global fossil fuel methane emissions remain near record levels, estimated at roughly 120–150 million tonnes annually.

Recent tracking shows:

  • Oil operations contribute approximately 45 Mt/year of methane emissions.
  • Coal mining contributes approximately 43 Mt/year.
  • Natural gas systems contribute approximately 36 Mt/year.

Satellite observations have also identified frequent “super-emitter” events, where enormous methane releases occur from individual facilities, coal mines, and aging oil fields.


2. Agriculture and Waste

Human activities account for the majority of long-term methane growth.

Livestock Production

Ruminant animals such as cattle and sheep produce methane through digestion. Their manure also releases methane when stored in oxygen-poor conditions.

Agriculture contributes approximately 35–40% of human-caused methane emissions, driven largely by:

  • Expanding cattle and dairy production.
  • Increased global demand for meat and dairy products.
  • Manure management systems.

Landfills and Organic Waste

Modern waste systems create ideal methane-producing conditions.

When food waste and other organic materials are buried in landfills, they decompose without oxygen, producing methane that can escape into the atmosphere.

Rapid urbanization and rising consumption have increased landfill methane emissions worldwide.


3. Natural Methane Feedback Loops

One of the most concerning developments is that climate change itself is beginning to increase methane emissions from natural systems.

Warming Wetlands: A Climate Feedback Loop

Tropical wetlands have become a major contributor to the recent acceleration in atmospheric methane growth.

The mechanism:

Rising temperatures → Increased rainfall and flooding → Expansion of oxygen-poor wetlands → Faster microbial decomposition → Increased methane release → Additional warming

Research from NOAA and the University of Colorado indicates that tropical wetlands, especially in South America and Africa, have become dominant sources of the recent methane surge.

Wetlands accounted for approximately 40% of the increase in methane emissions between 2000 and 2022, demonstrating how climate change can activate self-reinforcing feedback loops.


Methane Emissions Are Accelerating

Global methane emissions have increased dramatically over the past two decades, rising by roughly 20% and reaching record levels of approximately 610 million tonnes annually.

Atmospheric monitoring from organizations including NOAA and the International Energy Agency (IEA) shows methane concentrations continuing a steep upward trend.

This acceleration is being driven by three interacting forces:

  1. Expanding fossil fuel extraction and infrastructure leaks.
  2. Growing agricultural and waste emissions.
  3. Climate-driven natural feedback loops, especially warming wetlands.

Why Methane Matters for Climate Stability

Methane represents one of the fastest opportunities to slow near-term warming because it has such a powerful short-term climate impact.

Reducing methane emissions from:

  • Fossil fuel leaks,
  • Livestock systems,
  • Landfills,
  • and industrial operations

could rapidly reduce the rate of warming.

However, continued warming threatens to unlock additional natural methane emissions from wetlands, permafrost, and other carbon-rich ecosystems. These feedbacks create the risk of a self-reinforcing cycle:

More warming → More methane release → More greenhouse warming → More ecosystem disruption → More methane release

Methane is therefore not only a pollutant—it is a critical indicator of whether Earth’s climate system is moving toward stabilization or accelerating disruption.

The Growing Methane Feedback: From Ice-Melt Acceleration to Tipping-Point Amplification

The ice-albedo feedback is one of the fastest climate feedbacks operating today. As Arctic sea ice and snow cover disappear, darker surfaces absorb more solar energy, accelerating regional warming.

But the climate system does not stop at the ice-albedo feedback.

As warming crosses additional thresholds, carbon-cycle feedbacks can become increasingly important—and methane can become a powerful amplifier of that warming.

This creates a critical transition in the climate system:

Ice loss accelerates warming → warming destabilizes frozen carbon stores → microbial activity increases → methane emissions increase → methane adds additional warming → more tipping points become vulnerable

The significance of methane is therefore not limited to today’s emissions. Its greater danger may lie in the possibility that warming itself progressively activates new methane sources.

1. Permafrost: A Gateway to Additional Methane

Permafrost contains enormous quantities of frozen organic carbon accumulated over thousands of years.

While frozen, much of this carbon remains relatively isolated from microbial decomposition. As temperatures rise and permafrost thaws, previously frozen organic material becomes available to microorganisms.

The resulting greenhouse-gas emissions depend on local conditions.

In oxygen-rich soils, decomposition produces primarily CO₂.

In saturated, oxygen-poor soils and wetlands, anaerobic decomposition can produce substantial quantities of methane (CH₄).

The feedback therefore becomes:

Warming → permafrost thaw → microbial activation → CH₄ release → additional warming

The important point is that permafrost thaw can turn a previously inactive carbon reservoir into an increasingly active source of greenhouse gases.

2. Why Methane Becomes More Important as Warming Accelerates

Methane is especially important because it is an extremely powerful greenhouse gas over short timescales.

When methane emissions increase, the atmosphere experiences a rapid additional warming influence. Although methane eventually oxidizes into CO₂, its initial warming effect is much stronger than that of an equivalent amount of CO₂ over the first several decades.

This makes methane particularly important during periods when the climate system is approaching or crossing tipping points.

The sequence can become:

Initial warming → methane release → rapid additional warming → greater probability of crossing another threshold

Once another tipping system begins to destabilize, it can generate additional warming or greenhouse-gas emissions of its own.

3. Tipping Points Can Transform the Methane Feedback

The importance of methane should therefore be considered as part of a network of interacting tipping points, rather than as an isolated feedback.

For example:

Arctic warming
↓
Sea-ice loss
↓
Ice-albedo feedback strengthens
↓
Additional Arctic warming
↓
Permafrost thaw increases
↓
Microbial decomposition accelerates
↓
CH₄ emissions increase
↓
Additional atmospheric warming
↓
Further ice loss and permafrost thaw

This network can become even more complicated as other climate thresholds are approached.

Warming can alter precipitation patterns, increase wildfire activity, change Arctic hydrology, and transform previously frozen or oxygen-rich soils into waterlogged environments where methane production becomes more favorable.

Consequently, the methane feedback can strengthen not simply because temperatures rise, but because warming changes the physical conditions controlling where and how methane is produced.

4. From External Forcing to Internal Amplification

This distinction is fundamental.

At the beginning of anthropogenic warming, the primary forcing comes from human emissions of greenhouse gases.

But as warming increases, the climate system itself can begin generating additional greenhouse-gas emissions.

The system moves progressively from:

Human emissions → warming

toward:

Human emissions → warming → feedback activation → additional greenhouse gases → additional warming

Methane is particularly important in this transition because it can provide a rapid amplification mechanism inside a much slower carbon-cycle response.

Permafrost does not need to release all of its stored carbon to become climatically important. Even a progressively increasing methane contribution can amplify warming during the critical period when other tipping points are becoming increasingly vulnerable.

5. Methane as a Tipping-Point Multiplier

This is why the methane feedback should not be evaluated solely by comparing today’s methane emissions with today’s CO₂ emissions.

The more important question is:

Does continued warming activate new methane sources that were previously largely dormant?

If the answer is yes, methane changes from being primarily an emissions-control problem into an increasingly important Earth-system feedback problem.

The distinction can be summarized as:

Before tipping-point activation:
Human emissions → methane emissions → warming

As tipping points are crossed:
Human emissions → warming → permafrost and wetland changes → additional methane → more warming

With multiple interacting tipping points:
Warming → ice loss → greater solar absorption → permafrost thaw → methane release → additional warming → further tipping-point activation → additional greenhouse-gas release

This is the critical danger.

The climate system does not have to experience one enormous methane release for the feedback to matter. A progressively increasing methane contribution, coupled with other feedbacks, can help push the system across additional thresholds.

The Emerging Climate Dynamic

The ice-albedo feedback may be one of the fastest visible accelerators of Arctic warming today.

But as warming continues, the relative importance of methane-producing feedbacks can increase because previously frozen carbon becomes biologically active and environmental conditions become increasingly favorable for methane production.

The resulting system can be viewed as a progression:

Ice loss → Arctic amplification → permafrost thaw → methane release → atmospheric warming → additional tipping-point pressure

The critical issue is therefore not whether methane will suddenly become the dominant driver of climate change.

It is whether methane feedbacks become an increasingly important amplifier at precisely the time when the climate system is becoming more vulnerable to cascading tipping points.

That possibility makes methane one of the most important short-term feedbacks to monitor as the planet moves deeper into a warmer and increasingly nonlinear climate state.

bookmark_borderFrom Polar Amplification to Planetary Rotation: The Cascading Network of Climate Feedbacks and Tipping Points

by Daniel Brouse

This is what is happening right now. And with every reinforcing feedback we activate, we amplify what comes next.

Polar amplification → weakened equator-to-pole temperature gradients → reduced thermal contrast → atmospheric circulation changes → accelerated Arctic and Greenland ice melt → ICE–ALBEDO FEEDBACK: ice loss → darker surface → greater solar absorption → more warming → more ice loss ↺ → MELT–ELEVATION FEEDBACK: ice loss → lower ice-sheet elevation → warmer air → faster surface melt → further elevation loss ↺ → LAPSE-RATE FEEDBACK: Arctic warming → weaker vertical temperature gradient → reduced atmospheric cooling efficiency → additional near-surface warming → more ice melt ↺ → coupled cryospheric amplification → freshwater input into the North Atlantic → reduced salinity + density → AMOC disruption / potential weakening → North Atlantic pressure-field + storm-track reorganization → greater jet-stream waviness → slower progression → amplified Rossby waves → persistent blocking + omega blocks + meridional flow → stalled atmospheric rivers + prolonged heat domes + drought–flood swings → hydroclimatic whiplash → agriculture + infrastructure + ecosystems + public health stress → PERMAFROST TIPPING ELEMENT: thaw → CO₂ + CH₄ release → additional greenhouse forcing → Arctic warming ↺ → BOREAL FOREST TIPPING ELEMENT: warming + drought + wildfire → forest degradation → reduced carbon uptake + carbon release → additional warming ↺ → AMAZON RAINFOREST TIPPING ELEMENT: warming + drought + fire → reduced evapotranspiration + rainfall recycling → greater drought → forest loss + carbon release → additional warming ↺ → WEST ANTARCTIC ICE-SHEET TIPPING ELEMENT: ice instability → accelerated ice loss → sea-level rise → additional cryospheric stress → global land-ice loss + groundwater redistribution → planetary mass redistribution → altered moment of inertia → rotational dynamics → slight rotational slowing → changes in length of day.

bookmark_borderThe Ice–Albedo–Melt–Elevation Feedback: Earth’s Most Powerful Cryospheric Tipping-Point Mechanism

by Daniel Brouse

Arctic Sea Ice & Polar Ice Sheets

Core Feedback: Ice–Albedo Effect + Melt–Elevation Feedback
Mechanism: Melting reflective ice exposes darker ocean water or land, which absorbs more solar energy and accelerates additional warming and ice loss. As ice sheets lose elevation, their surfaces descend into warmer air, further accelerating melting.
Threat Level: Highest — Immediate Global Energy Amplification

The Ice–Albedo Effect, combined with the Melt–Elevation Feedback, represents the most powerful and consequential tipping-point mechanisms in the climate system.

Together, these feedbacks create a self-reinforcing cycle in which warming causes ice loss, ice loss increases heat absorption, and shrinking ice exposes the remaining ice to progressively warmer atmospheric conditions.

The Ice–Albedo Effect alone is estimated to account for roughly 10% to 25% of the total warming associated with human greenhouse-gas emissions.

The combination becomes especially dangerous when applied to the enormous ice reservoirs of Greenland and West Antarctica. These ice sheets contain enough frozen water to fundamentally reshape global coastlines, while their loss can trigger additional changes throughout the atmosphere and ocean.

The central danger is not simply that ice melts.

It is that the physical processes governing ice loss can reinforce one another.


The Two Feedbacks: A One–Two Punch

The Ice–Albedo Effect and Melt–Elevation Feedback destabilize ice from two different directions—one primarily through energy absorption at the surface, the other through exposure to increasingly warm atmospheric conditions.

Together, they form a powerful reinforcing mechanism.

1. Ice–Albedo Effect — The Thermal Loop

Bright snow and ice function like a planetary mirror.

Fresh snow can reflect as much as 90% of incoming sunlight back into space. As ice and snow melt, they expose darker surfaces such as ocean water, bare ground, or rock.

Those darker surfaces absorb substantially more solar radiation, with dark ocean water capable of absorbing roughly 90% of incoming solar energy under favorable conditions.

The resulting sequence is:

warming → ice and snow loss → darker surface exposure → greater solar absorption → additional local warming → more ice loss

This is the Ice–Albedo Feedback.

It effectively converts the loss of reflective ice into an additional source of heat absorption.

The more reflective surface disappears, the more solar energy the exposed surface can absorb.


2. Melt–Elevation Feedback — The Atmospheric Loop

The second mechanism is fundamentally different.

The Greenland Ice Sheet, for example, rises several kilometers above sea level. Its highest surfaces therefore exist in an atmosphere that is considerably colder than the air at lower elevations.

As warming causes the ice sheet to lose mass and elevation, its surface physically descends into warmer air.

This produces a second reinforcing cycle:

ice loss → lower surface elevation → warmer surrounding air → increased melting → additional ice loss → further elevation loss

This is the Melt–Elevation Feedback.

The process is particularly important for large, thick ice sheets because their surfaces can experience substantial changes in elevation as mass is lost.

The result is effectively a moving climatic target: the lower the ice surface becomes, the warmer the atmospheric environment surrounding the remaining ice can become.


Why the Combination Is So Powerful

Other climate tipping mechanisms are extraordinarily dangerous, including permafrost thaw, forest dieback, and changes to major ocean circulation systems.

The ice-melt combination is uniquely powerful because it combines energy amplification, physical elevation loss, and global-scale consequences.

Three characteristics are especially important.

1. Irreversibility

Large ice sheets do not respond instantaneously to changes in global temperature.

Once substantial ice has been lost and the surface has dropped into a warmer atmospheric environment, rebuilding that ice requires sustained periods of substantially cooler conditions and renewed accumulation.

Even if global warming were eventually halted, the ice sheet would not automatically return to its previous state.

And if the global climate were cooled back toward pre-industrial conditions, the altered geometry and lower elevation of a diminished ice sheet could still make recovery slow and difficult.

The important distinction is that stopping warming does not instantly reverse the physical consequences of previous warming.

Ice sheets have memory.


2. Geometric Acceleration

Ice-sheet geometry can also reinforce the melt process.

As an ice sheet shrinks and its surface elevation changes, increasingly large areas can become exposed to warmer atmospheric conditions.

Changes in slope, surface elevation, meltwater drainage, crevassing, and ice dynamics can interact with surface melting and potentially transform what initially appears to be gradual mass loss into increasingly rapid structural retreat.

This creates the potential for:

ice-sheet thinning → lower elevation → warmer air exposure → faster melting → further thinning

The geometry of the ice sheet therefore becomes part of the feedback itself.


3. Global Domino Effect

The consequences extend beyond the ice sheet itself.

Massive freshwater inputs from Greenland enter the North Atlantic and can alter the ocean’s salinity and density structure.

Because the formation and sinking of dense North Atlantic water are important components of the Atlantic Meridional Overturning Circulation (AMOC), substantial freshwater input has the potential to weaken this circulation.

A major AMOC slowdown would not simply be a regional event.

It could radically alter weather and climate patterns across the North Atlantic region and potentially trigger or intensify secondary climate tipping processes elsewhere.

This creates a possible domino sequence:

Greenland ice loss → freshwater input → North Atlantic freshening → altered ocean density → AMOC weakening → major atmospheric and oceanic changes → secondary climate impacts

The ice sheet therefore acts not merely as a reservoir of frozen water but as a potential trigger for changes throughout the broader climate system.


The Critical Limitation: The Ice–Albedo Feedback Has a Finite Fuel Supply

There is an important feature of the Ice–Albedo Effect that is sometimes overlooked:

The feedback cannot accelerate indefinitely.

Every feedback loop requires something to drive it.

For the Ice–Albedo Effect, that “fuel” is reflective snow and ice.

As long as reflective surfaces remain available to melt, their disappearance exposes progressively darker surfaces that absorb more solar energy.

But once the reflective ice is gone, there is no additional bright surface left to remove.

The feedback therefore follows a life cycle:

Phase 1: Acceleration → Phase 2: Peak/Plateau → Phase 3: Drop Toward Zero

Melting speeds up heat absorption
↓
Seasonal or regional ice disappears and the darker surface stabilizes
↓
The remaining albedo-driven amplification progressively loses its fuel

This does not mean the climate system becomes stable.

It means that this particular feedback mechanism reaches the physical limit of what it can accomplish.


Phase 1: Current Acceleration

This is the phase in which declining snow and ice expose increasingly large areas of darker ocean and land.

As reflective surfaces disappear, more solar energy is absorbed.

The resulting warming contributes to additional melting, which exposes still more dark surface.

The cycle is:

ice loss → greater solar absorption → warming → additional ice loss

This is the phase in which the Ice–Albedo Effect functions as an accelerating feedback.


Phase 2: The Peak and Plateau

The feedback eventually begins to plateau within any region that loses its seasonal ice entirely.

The clearest example is summer Arctic sea ice.

Once the Arctic Ocean becomes entirely ice-free during summer, the ocean surface cannot become substantially darker simply because the remaining seasonal ice has disappeared.

At that point, the localized albedo-driven warming effect reaches a new maximum.

The feedback no longer accelerates in the same way because its primary fuel source—seasonal reflective ice—is exhausted.

The system has effectively transitioned from:

accelerating heat absorption

to:

a new, persistently warmer baseline

This distinction is crucial.

A plateau in the feedback does not mean a return to the previous climate.

It means the climate has stabilized at a more heat-absorbing state.


Phase 3: The Drop Toward Zero

At the theoretical endpoint, if Earth’s remaining glaciers, ice sheets, and seasonal snowpacks were completely eliminated, the Ice–Albedo Effect would cease to function as a melting-driven amplification mechanism.

There would be no additional reflective white surface left to remove.

The feedback would therefore have no remaining fuel.

In that sense:

no reflective ice remaining → no further albedo loss → no further albedo-driven acceleration

The acceleration eventually drops toward zero because the physical process has reached its endpoint.

But this is where the most important distinction arises.


The Catch: A Permanently Hotter Planet

The end of the feedback does not mean the end of the warming it helped create.

Breaking the feedback loop does not cool the planet.

Instead, it leaves Earth in a radically altered physical state.

A planet with little or no permanent snow and ice has a fundamentally different surface energy balance from the present Earth.

The reflective surfaces have been replaced by darker, more efficient heat-absorbing surfaces.

The climate therefore settles into a much hotter equilibrium.

The loss of Earth’s ice is estimated to produce an additional warming influence equivalent to approximately 1 trillion tons of CO₂ added to the atmosphere.

That comparison illustrates the enormous climatic significance of the cryosphere.

The ice does not merely occupy space.

It actively regulates how much solar energy Earth absorbs.

Once the reflective ice is gone, the energy balance of the planet is permanently altered.

The resulting thermal energy remains within the climate system on very long timescales, maintaining global temperatures at an elevated post-glacial equilibrium.


The Paradox of the Ice–Albedo Tipping Point

The Ice–Albedo Feedback therefore contains a paradox.

Its acceleration eventually ends because the ice disappears.

But the disappearance of the ice is precisely what creates the new, hotter planetary state.

The feedback can be represented as:

Ice present
→ reflective surface
→ less solar absorption
→ cooling influence

Ice melting
→ dark surface exposed
→ greater solar absorption
→ accelerating warming

Ice largely gone
→ maximum dark-surface exposure
→ albedo amplification reaches its physical limit
→ feedback acceleration declines

After the transition
→ permanently altered surface energy balance
→ hotter climate equilibrium
→ long-lived consequences

The feedback therefore does not need to operate forever to produce enormous consequences.

It only needs to operate long enough to transform the planetary surface from reflective to heat-absorbing.


Why Ice Loss Represents a Tipping-Point Threat

The deepest danger is therefore not simply the loss of Arctic summer sea ice or the retreat of individual glaciers.

It is the possibility that multiple ice-related feedbacks can operate simultaneously across enormous geographic scales.

The Ice–Albedo Effect increases solar energy absorption.

The Melt–Elevation Feedback exposes ice surfaces to progressively warmer atmospheric conditions.

Ice-sheet thinning can alter geometry and dynamics.

Greenland freshwater discharge can affect North Atlantic ocean circulation.

And major changes in the AMOC can propagate climate disruptions far beyond the original source of the disturbance.

The combined system can therefore be represented as:

Global warming
↓
ice and snow loss
↓
Ice–Albedo amplification
↓
greater heat absorption
↓
additional warming

while simultaneously:

ice-sheet mass loss
↓
surface elevation decline
↓
warmer atmospheric exposure
↓
increased melting
↓
additional elevation loss

and potentially:

Greenland ice loss
↓
freshwater entering North Atlantic
↓
salinity and density changes
↓
AMOC weakening
↓
global atmospheric and oceanic disruption
↓
secondary climate feedbacks and tipping processes

This is why the Ice–Albedo Effect + Melt–Elevation Feedback combination can be regarded as one of the most powerful tipping-point mechanisms in the climate system.

Its power comes from the interaction of energy, geometry, atmospheric temperature, ocean circulation, and ice dynamics.

The ultimate danger is not simply that ice melts.

It is that ice loss can change the conditions under which the remaining ice exists, making further loss progressively easier while simultaneously altering the Earth’s energy balance and major circulation systems.

And when the last reflective ice finally disappears, the Ice–Albedo Feedback does not end with a return to normal.

It ends because the transformation is complete.

The planet has been moved from a reflective, ice-regulated state toward a darker, more efficient heat-absorbing state.

The feedback stops accelerating not because the danger has disappeared—but because the fuel that powered the acceleration is gone.

bookmark_borderThe Polar Feedback Engine: Arctic Heat, Wildfires, and the Accelerating Loss of Earth’s Ice

by Daniel Brouse

The astonishing Arctic heatwave of 2026 is a stark illustration of how rapidly the polar climate is changing. Freshly published data highlighted by Scientific American confirm that temperatures in northern Russia have routinely surpassed 90°F (32.2°C)—temperatures more characteristic of midsummer in places far to the south.

These extraordinary readings are not simply isolated temperature records. They are occurring within a broader system of Arctic amplification, in which the Arctic is warming up to four times faster than the global average. That accelerated warming is interacting with snow and ice loss, permafrost thaw, atmospheric circulation, forest drying, and wildfire behavior to create increasingly powerful feedback loops.

Arctic Heatwave: Temperatures More Typical of Florida

Several remote northern stations have recorded extraordinary heat.

  • Selagoncy Station: Located near the Arctic Circle, this remote meteorological station registered a blistering 93.0°F (33.9°C).
  • Olenek Station: Another notoriously cold northern outpost reached an extreme high of 90.9°F (32.7°C).
  • The comparison: According to climate data compiled by weather information service Ogimet and analyzed by climatologist Maximiliano Herrera, these temperatures are comparable to midsummer conditions in Orlando, Florida.

The significance of these temperatures becomes clearer when they are placed within the larger Arctic climate system.


Arctic Amplification: A Self-Reinforcing Feedback System

Meteorologists and climate scientists identify Arctic amplification as a major reason the polar region is warming so rapidly. The Arctic can warm at up to four times the rate of the global average because several reinforcing processes operate simultaneously.

The Loss of Reflective Surfaces

Snow and sea ice are highly reflective. They return a substantial portion of incoming solar radiation back into space.

As warming removes that reflective white surface, darker land and ocean surfaces are exposed. These surfaces absorb significantly more solar radiation.

The feedback becomes:

warming → snow and sea-ice loss → darker surfaces → greater solar absorption → additional warming

This is the classic ice-albedo feedback, and it helps explain why warming in the Arctic can accelerate faster than the global average.

The Ice–Albedo Effect, combined with the Melt–Elevation Feedback, represents the most powerful and consequential tipping-point mechanisms in the climate system. Together, these feedbacks create a self-reinforcing cycle in which warming causes ice loss, ice loss increases heat absorption, and shrinking ice exposes the remaining ice to progressively warmer atmospheric conditions. The Ice–Albedo Effect alone is estimated to account for roughly 10% to 25% of the total warming associated with human greenhouse-gas emissions.

Permafrost Thaw

Extreme Arctic heat also threatens to accelerate the thawing of ancient permafrost.

Frozen soils contain enormous quantities of carbon accumulated over thousands of years. As permafrost thaws, previously trapped organic material becomes available for decomposition, potentially releasing massive quantities of methane and carbon dioxide back into the atmosphere.

The resulting feedback is:

warming → permafrost thaw → greenhouse-gas release → additional warming

The Arctic therefore contains the potential for multiple reinforcing mechanisms to operate simultaneously.


From Arctic Heat to Canadian Wildfires

The extreme Arctic heatwave—including the 93.0°F (33.9°C) reading at Selagoncy and absolute records reaching 100.4°F (38°C)—creates a cascading climate feedback system that can directly supercharge the conditions driving Canadian wildfires.

Because Canada’s Arctic is warming up to four times faster than the global average, this extraordinary polar heat can dramatically reshape atmospheric circulation and fuel conditions across North America.

The critical connection occurs through the atmosphere.

The Atmospheric Link: Jet Stream Disruption

The jet stream is strongly influenced by the temperature difference between the warm equator and the frigid polar regions.

As the Arctic overheats, that temperature contrast shrinks.

The result can be a slower, more meandering, increasingly “wobbly” jet stream.

Instead of rapidly transporting weather systems from west to east, the altered circulation can allow large-scale atmospheric patterns to become persistent.

Atmospheric Blocking and Heat Domes

A sluggish, highly meandering jet stream can contribute to massive, stagnant areas of high pressure known as heat domes.

Rather than moving along normally, these high-pressure systems can become parked over regions such as the Northwest Territories and Alberta.

The result is prolonged exposure to:

  • extreme heat,
  • clear skies,
  • suppressed precipitation,
  • intense evaporation,
  • soil-moisture loss,
  • and increasingly severe drought.

The feedback becomes:

Arctic warming → reduced equator-to-pole temperature contrast → altered jet-stream behavior → atmospheric blocking → persistent heat dome → prolonged drought and drying

This atmospheric connection helps transform an episode of extreme Arctic heat into a much broader continental climate hazard.


The Boreal Fuel Link: Vapor Pressure Deficit

Once extreme heat reaches Canada’s vast northern boreal forests, another physical feedback becomes increasingly important: vapor pressure deficit (VPD).

Warm air can hold significantly more water vapor than cold air.

When temperatures rise without a corresponding increase in atmospheric moisture, the difference between the atmosphere’s moisture-holding capacity and its actual moisture content increases.

This produces a high vapor pressure deficit, meaning the atmosphere becomes increasingly aggressive in drawing moisture from the landscape.

It effectively begins sucking moisture out of the soil, trees, vegetation, and forest floor.

Turning the Forest Into a Tinderbox

As VPD increases:

warm air → greater atmospheric moisture demand → increased evaporation and plant water loss → drying vegetation and soils → highly flammable fuels

Lichen, moss, pine needles, grasses, deadwood, and other organic materials can rapidly dry into volatile wildfire fuel.

Once dried by Arctic-driven heatwaves and persistent atmospheric blocking, the boreal landscape can require very little additional energy to ignite.

This creates another reinforcing chain:

heat → high VPD → drying → greater fuel flammability → wildfire


When Wildfires Create Their Own Weather

The feedback does not necessarily stop once a fire begins.

Under sufficiently intense conditions, the wildfire itself can begin modifying the atmosphere.

Pyrocumulonimbus Clouds: Firestorms in the Sky

The immense heat generated by large Canadian wildfires can force towering columns of hot air and smoke miles into the atmosphere.

These columns can develop into pyrocumulonimbus clouds, often called firestorms.

These fire-generated thunderstorms can produce extreme atmospheric turbulence, powerful wind shifts, and lightning.

More Lightning, More Fires

The resulting storms can generate intense lightning, including dry lightning that occurs with little or no meaningful rainfall.

That creates a dangerous secondary feedback.

Lightning strikes can hit already-parched forests surrounding the original fire and ignite entirely new fire fronts.

The process becomes:

extreme heat and drought → dry vegetation → wildfire → enormous heat column → pyrocumulonimbus formation → lightning and wind shifts → new ignitions → more wildfires

The fire is therefore no longer simply responding to weather.

Under extreme conditions, it can begin creating its own weather, which can then generate additional fires.


The Long-Range Result: Smoke Across North America

The consequences of these interconnected feedbacks extend far beyond the original fire zones.

Canada’s burned area has surged past its 10-year average, while enormous plumes of smoke from northern Canada have been observed by NASA traveling thousands of miles.

These smoke plumes can blanket the U.S. East Coast and continue outward over the Atlantic Ocean, triggering hazardous air-quality alerts for millions of people.

A climate disturbance originating in the Arctic and northern Canadian boreal forest can therefore propagate through the atmosphere across an entire continent.

The chain is increasingly interconnected:

Arctic warming → atmospheric disruption → heat dome → drought → high VPD → dry forests → wildfire → pyrocumulonimbus → lightning → additional fires → massive smoke transport

Each individual link has its own physical mechanism, but together they form a much larger climate feedback system.


The Cryosphere Is Also Under Accelerating Stress

The atmosphere and biosphere are not the only components undergoing severe disruption.

The cryosphere—the Earth’s frozen zones—has also experienced severe and accelerated changes.

Both mountain glaciers and the Antarctic continent are setting alarming physical records.

These changes matter because the cryosphere is not simply a passive indicator of climate change. Ice and snow actively influence Earth’s energy balance, freshwater systems, and global sea level.


Mountain Glaciers: An Extreme Summer Ice Deficit

The world’s mountain glaciers are experiencing increasingly severe mass loss.

The Protective Blanket Vanished Early

In July 2026, Switzerland’s glacier monitoring network, GLAMOS, reported that the entire winter snowpack over the Swiss Alps had completely melted.

This occurred nearly a month ahead of schedule.

The loss of the reflective snowpack is particularly significant because the snow acts as a protective, high-albedo blanket over the underlying glacier.

Once the white snow disappears, darker glacier ice is exposed directly to solar radiation.

That creates another albedo feedback:

snow loss → dark glacier ice exposed → greater solar absorption → accelerated surface melting

Under these extreme conditions, glacier surface loss can reach up to a meter in just 10 days.


A 400-Billion-Ton Annual Glacier Deficit

According to the World Glacier Monitoring Service (WGMS), the world’s mountain glaciers are experiencing a net loss of more than 400 billion tonnes of ice mass annually.

That represents an extraordinary physical transfer of water from glaciers into the world’s oceans.

The loss contributes approximately 1.1 millimeters directly to global sea-level rise each year, outpacing the direct contribution from the Antarctic Ice Sheet.

The significance extends beyond sea-level rise.

Mountain glaciers function as enormous natural freshwater reservoirs. Their continued loss threatens to alter water availability for ecosystems, agriculture, communities, and river systems dependent upon seasonal meltwater.


The Mid-Century Glacier Disappearance Timeline

A newly published comprehensive model in Nature Climate Change projects that global mountain glacier mass loss will peak by mid-century.

Under current high-emission trajectories, the subtropical Andes and European Alpine glacier networks face near-total structural collapse.

The implications are profound.

Glaciers that have persisted for centuries or millennia can disappear within a matter of decades once warming pushes the system beyond its ability to maintain a stable ice mass.

The process can therefore shift from gradual retreat toward increasingly rapid structural loss.


Antarctica: Melting From Below

Antarctica represents a different but equally alarming component of the cryosphere crisis.

The continent’s ice loss is strongly influenced not only by atmospheric warming but also by ocean-driven melting beneath floating ice shelves.

The Human Greenhouse-Gas Signature

A study published in The Cryosphere provided physical evidence that human-caused greenhouse-gas emissions have accelerated the retreat of Pine Island Glacier—the fastest-melting glacier in West Antarctica—by up to 20% since the 1940s.

Pine Island Glacier is one of the major drainage systems of the West Antarctic Ice Sheet and is an important contributor to global sea-level rise.

The finding is significant because it demonstrates how human greenhouse-gas emissions can alter the trajectory of an already vulnerable Antarctic ice system.


Melting From Below

Oceanographic measurements collected through deep drilling into Antarctic ice shelves have revealed that major ice margins can melt rapidly from below.

The mechanism involves upwelling warm ocean currents reaching the underside of floating ice shelves.

Because these shelves extend from grounded ice into the ocean, they provide an important structural restraint on the flow of inland ice toward the sea.

When warm ocean water melts them from below:

warm ocean currents → basal melting → ice-shelf thinning → weakened structural restraint → increased ice discharge → rising sea levels

The process is particularly dangerous because the atmosphere does not have to become dramatically warmer at the surface for ocean-driven melting to continue.

The ocean can effectively attack the Antarctic ice system from underneath.


A 135-Billion-Ton Annual Antarctic Ice Deficit

Satellite monitoring conducted by NASA confirms that Antarctica is shedding an average of approximately 135 billion metric tons of ice into the ocean every year.

That enormous annual loss represents another major contribution to global sea-level rise.

And unlike seasonal snow, this is primarily the loss of land-based ice. When grounded Antarctic ice enters the ocean, it adds water to the global ocean system.

The implications extend far beyond Antarctica itself.

Continued Antarctic mass loss contributes to long-term sea-level rise, increasing risks for coastal communities, infrastructure, ecosystems, ports, and low-lying regions around the world.


One Connected Climate System

The Arctic heatwave, Canadian wildfires, melting mountain glaciers, and accelerating Antarctic ice loss may appear to be separate stories.

They are not.

They are different manifestations of an interconnected Earth system in which the atmosphere, ocean, cryosphere, land surface, and biosphere continuously interact.

The Arctic heatwave demonstrates how polar amplification can intensify warming through the loss of reflective snow and ice and through the thawing of carbon-rich permafrost.

Atmospheric circulation changes can influence the persistence of heat domes and drought across Canada.

High temperatures and high vapor pressure deficits can dry boreal forests into highly combustible fuel.

Wildfires can then generate pyrocumulonimbus storms capable of producing lightning and new fires.

Meanwhile, the same warming system is removing mountain glacier mass and contributing to the destabilization of Antarctic ice.

The feedback chains can be summarized as:

Arctic warming
↓
snow and sea-ice loss
↓
darker surfaces
↓
greater solar absorption
↓
additional warming

At the same time:

Arctic warming
↓
jet-stream disruption and atmospheric blocking
↓
persistent heat domes
↓
drought and high VPD
↓
boreal forest drying
↓
wildfire
↓
pyrocumulonimbus storms
↓
lightning and new fires
↓
massive smoke transport

And across the cryosphere:

warming
↓
snowpack loss and glacier melting
↓
glacier mass loss
↓
sea-level rise

While in Antarctica:

warming ocean
↓
sub-surface ice-shelf melting
↓
ice-shelf thinning
↓
reduced restraint on grounded ice
↓
accelerated ice discharge
↓
sea-level rise

These are not isolated linear changes.

They are interacting components of a climate system in which feedbacks can reinforce one another, amplify existing warming, and increase the speed and severity of downstream impacts.

The significance of the current Arctic heatwave therefore extends far beyond a few extraordinary temperature readings.

A 93°F Arctic temperature, a 100.4°F absolute record, rapidly drying Canadian forests, fire-generated thunderstorms, 400 billion tons of annual mountain-glacier loss, and 135 billion tons of annual Antarctic ice loss are all physical measurements of a planet undergoing profound change.

The critical issue is not any single record.

It is the growing evidence that the climate system is becoming increasingly dominated by interacting feedbacks—processes in which warming changes the physical environment in ways that can produce still more warming, more extreme conditions, and more rapid disruption across interconnected Earth systems.