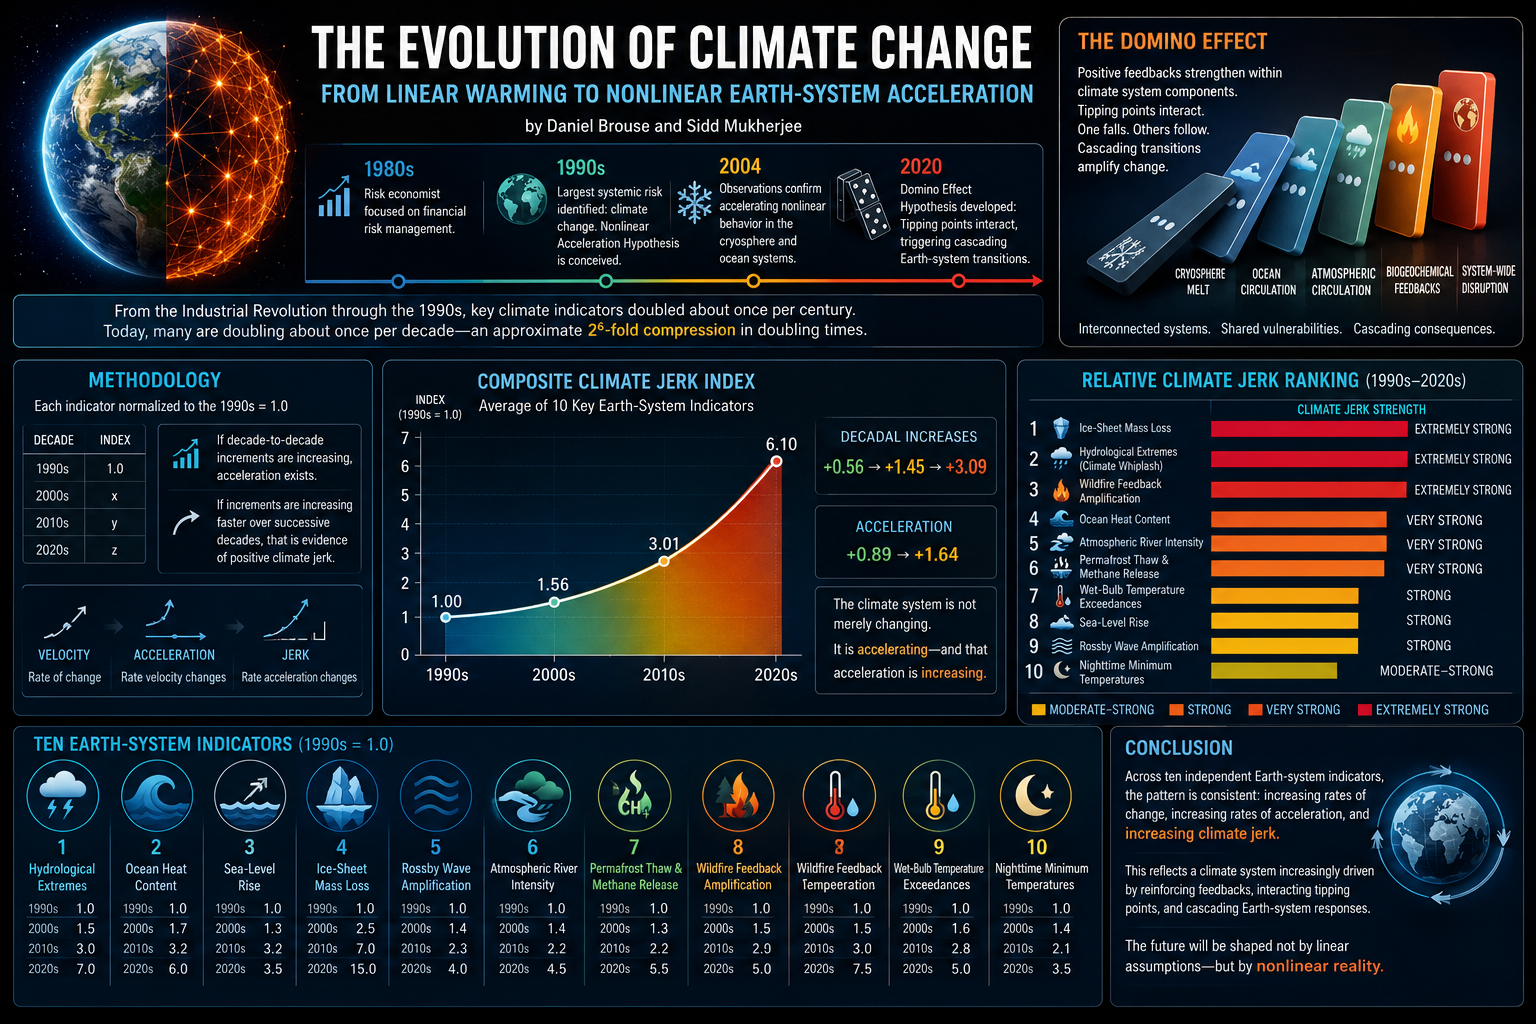
By Daniel Brouse and Sidd Mukherjee
During the 1980s, I worked primarily as an economist specializing in risk management. By the early 1990s, however, it had become clear that the greatest systemic risk facing civilization was not financial—it was climate change.
Working with physicist Sidd Mukherjee, we began developing what we called the Nonlinear Acceleration Hypothesis: the idea that climate change would not progress as a slow, linear process, but instead would accelerate as reinforcing Earth-system feedbacks became increasingly dominant.
Over the past three decades, an expanding body of observational evidence has increasingly supported this perspective. Today, nonlinear climate dynamics, positive feedbacks, tipping points, and cascading Earth-system interactions have become central concepts within modern climate science and climate-risk research.
From Linear Assumptions to Nonlinear Reality
By 1995, I had become convinced that many climate indicators were evolving exponentially rather than linearly. Sidd agreed the hypothesis was plausible but argued that a much longer observational record would be necessary before drawing firm conclusions.
At the time, most climate projections implicitly assumed relatively gradual warming. While serious, climate change was generally viewed as unfolding over centuries, leaving substantial time for adaptation and mitigation.
Yet observational evidence already suggested something different. Looking beyond annual variability, many climate indicators appeared to be accelerating.
By 2004, sufficient observations had accumulated to demonstrate nonlinear behavior across multiple components of the Earth system. Greenland Ice Sheet dynamics, in particular, were no longer consistent with simple equilibrium assumptions. Ocean heat uptake, ice-sheet mass loss, atmospheric moisture, and extreme precipitation all exhibited increasing rates of change.
A striking pattern emerged.
From the Industrial Revolution through approximately the 1990s, many leading indicators of climate change appeared to double on timescales approaching one century.
Today, many of those same indicators are doubling on timescales measured in roughly one decade.
This represents an approximate 2⁶-fold compression of doubling times over successive decades—a remarkable acceleration in the pace of climate change.
Rather than simply warming faster, the Earth system appears to be evolving into an increasingly nonlinear state in which the rate of change itself continues to accelerate.
If sustained, this may represent one of the most abrupt large-scale climate transitions in Earth’s geological history.
The Domino Effect
By 2020, our work expanded into what we termed the Domino Effect Hypothesis.
Many components of the climate system contain internal positive feedback mechanisms. As these feedbacks strengthen, the climate system becomes progressively less dependent upon external forcing because it increasingly reinforces its own evolution.
These critical threshold transitions are commonly known as climate tipping points.
Unlike gradual warming, tipping points exhibit nonlinear behavior in which relatively small additional forcing can produce disproportionately large—and potentially irreversible—changes.
Even more importantly, tipping points rarely occur in isolation.
The atmosphere, oceans, cryosphere, biosphere, and carbon cycle are tightly interconnected. Destabilization within one subsystem can reduce the stability of others, producing a sequence of interacting transitions throughout the Earth system.
This cascading behavior—often referred to as tipping cascades—forms the basis of the Domino Effect.
Since its proposal, extensive observational evidence has demonstrated that interacting climate feedbacks are a defining feature of modern climate dynamics and now occupy a central position within contemporary climate-risk literature.
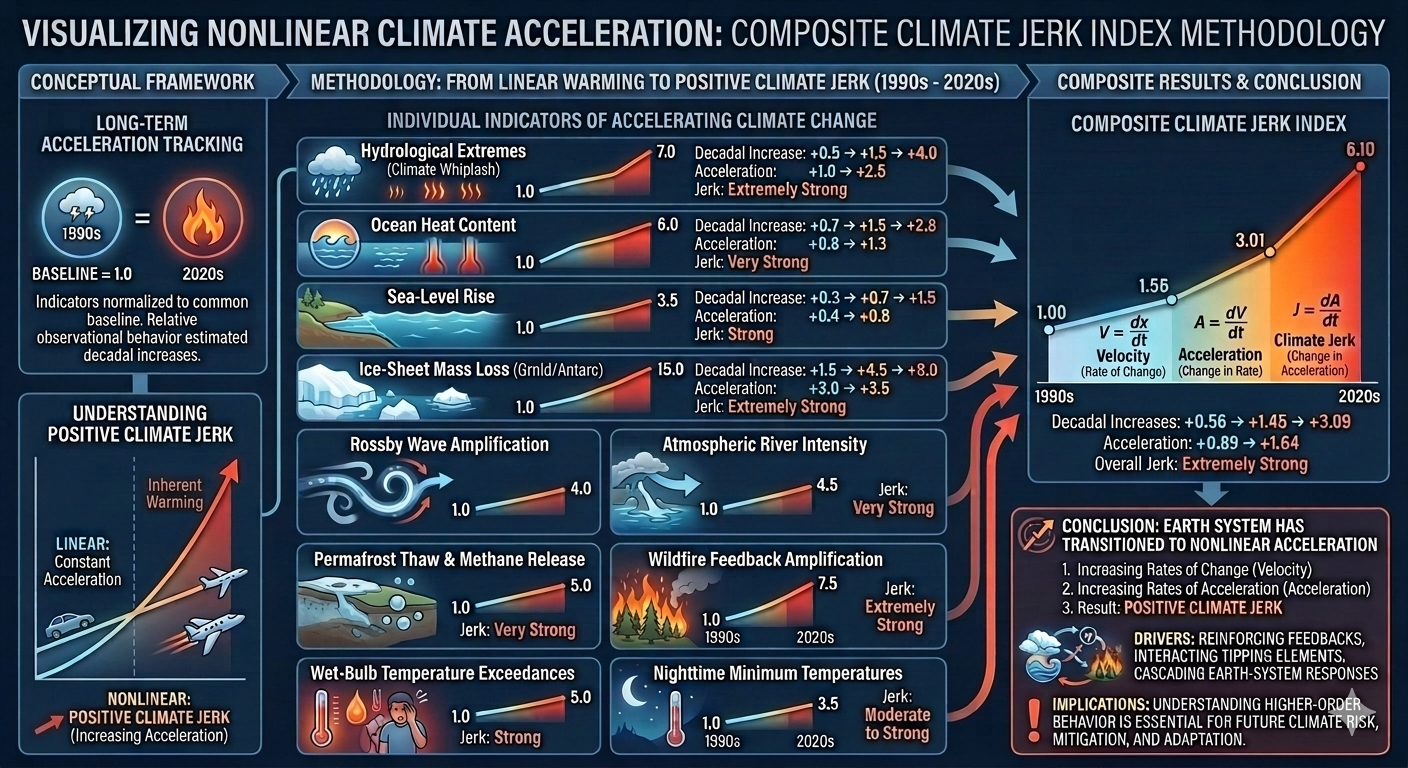
Methodology
To illustrate long-term changes in climate acceleration, each indicator was normalized to a common baseline:
1990s = 1.0
Relative observational behavior was then estimated for each subsequent decade.
If the decade-to-decade increases become progressively larger, the indicator exhibits positive acceleration.
If the acceleration itself continues increasing over time, this represents positive climate jerk—the rate at which acceleration is increasing.
In physics:
- Velocity describes the rate of change.
- Acceleration describes the rate at which velocity changes.
- Jerk describes the rate at which acceleration changes.
Applied to climate science, positive climate jerk indicates that Earth’s climate is not simply changing faster—it is accelerating faster over time.
1. Hydrological Extremes and Climate Whiplash
| Decade | Index |
|---|---|
| 1990s | 1.0 |
| 2000s | 1.5 |
| 2010s | 3.0 |
| 2020s | 7.0 |
Decadal increase: +0.5 → +1.5 → +4.0
Acceleration: +1.0 → +2.5
Climate Jerk: Extremely Strong
2. Ocean Heat Content
| Decade | Index |
|---|---|
| 1990s | 1.0 |
| 2000s | 1.7 |
| 2010s | 3.2 |
| 2020s | 6.0 |
Decadal increase: +0.7 → +1.5 → +2.8
Acceleration: +0.8 → +1.3
Climate Jerk: Very Strong
3. Sea-Level Rise
| Decade | Index |
|---|---|
| 1990s | 1.0 |
| 2000s | 1.3 |
| 2010s | 2.0 |
| 2020s | 3.5 |
Decadal increase: +0.3 → +0.7 → +1.5
Acceleration: +0.4 → +0.8
Climate Jerk: Strong
4. Ice-Sheet Mass Loss
(Greenland and Antarctica Combined)
| Decade | Index |
|---|---|
| 1990s | 1.0 |
| 2000s | 2.5 |
| 2010s | 7.0 |
| 2020s | 15.0 |
Decadal increase: +1.5 → +4.5 → +8.0
Acceleration: +3.0 → +3.5
Climate Jerk: Extremely Strong
5. Rossby Wave Amplification
| Decade | Index |
|---|---|
| 1990s | 1.0 |
| 2000s | 1.4 |
| 2010s | 2.3 |
| 2020s | 4.0 |
Climate Jerk: Strong
6. Atmospheric River Intensity
| Decade | Index |
|---|---|
| 1990s | 1.0 |
| 2000s | 1.3 |
| 2010s | 2.2 |
| 2020s | 4.5 |
Climate Jerk: Very Strong
7. Permafrost Thaw and Methane Release
| Decade | Index |
|---|---|
| 1990s | 1.0 |
| 2000s | 1.4 |
| 2010s | 2.5 |
| 2020s | 5.0 |
Climate Jerk: Very Strong
8. Wildfire Feedback Amplification
| Decade | Index |
|---|---|
| 1990s | 1.0 |
| 2000s | 1.5 |
| 2010s | 3.0 |
| 2020s | 7.5 |
Climate Jerk: Extremely Strong
9. Wet-Bulb Temperature Exceedances
| Decade | Index |
|---|---|
| 1990s | 1.0 |
| 2000s | 1.6 |
| 2010s | 2.8 |
| 2020s | 5.0 |
Climate Jerk: Strong
10. Nighttime Minimum Temperatures
| Decade | Index |
|---|---|
| 1990s | 1.0 |
| 2000s | 1.4 |
| 2010s | 2.1 |
| 2020s | 3.5 |
Climate Jerk: Moderate to Strong
Composite Climate Jerk Index
A simple average of the ten normalized indicators produces the following composite behavior:
| Decade | Composite Index |
|---|---|
| 1990s | 1.00 |
| 2000s | 1.56 |
| 2010s | 3.01 |
| 2020s | 6.10 |
Decadal increases
+0.56 → +1.45 → +3.09
Acceleration
+0.89 → +1.64
Conclusion
Viewed collectively, these observational indicators suggest that the Earth’s climate system has undergone a profound transition since the late twentieth century. The evidence indicates not only increasing rates of change, but increasing rates of acceleration—a phenomenon that may be described as positive climate jerk.
This behavior is consistent with a climate system increasingly influenced by reinforcing feedbacks, interacting tipping elements, and cascading Earth-system responses.
Whether evaluated through ice-sheet dynamics, ocean heat uptake, hydrological extremes, atmospheric circulation, wildfire amplification, or permafrost thaw, the emerging pattern is remarkably consistent: the climate system is not merely changing—it is accelerating, and that acceleration itself continues to increase.
Understanding this higher-order behavior may prove essential for accurately assessing future climate risk and for developing mitigation and adaptation strategies that account for the nonlinear dynamics of the Earth system.