bookmark_borderThe Latent Heat Engine: Ocean Evaporation, Water Vapor Feedback, and the Acceleration of Hydroclimatic Whiplash

By Daniel Brouse

Abstract

The ocean is Earth’s largest reservoir of stored thermal energy and a central component of the climate system’s energy redistribution machinery. One of the most important pathways by which the ocean transfers energy to the atmosphere is latent heat flux associated with evaporation.

When liquid water evaporates, energy is removed from the ocean surface and stored as latent heat in atmospheric water vapor. When that vapor subsequently condenses, the stored energy is released as heat into the atmosphere.

This phase-change process does far more than move energy from one location to another. It couples ocean warming, atmospheric moisture, radiative forcing, atmospheric circulation, precipitation intensity, drought, wildfire risk, flooding, and other components of the climate system.

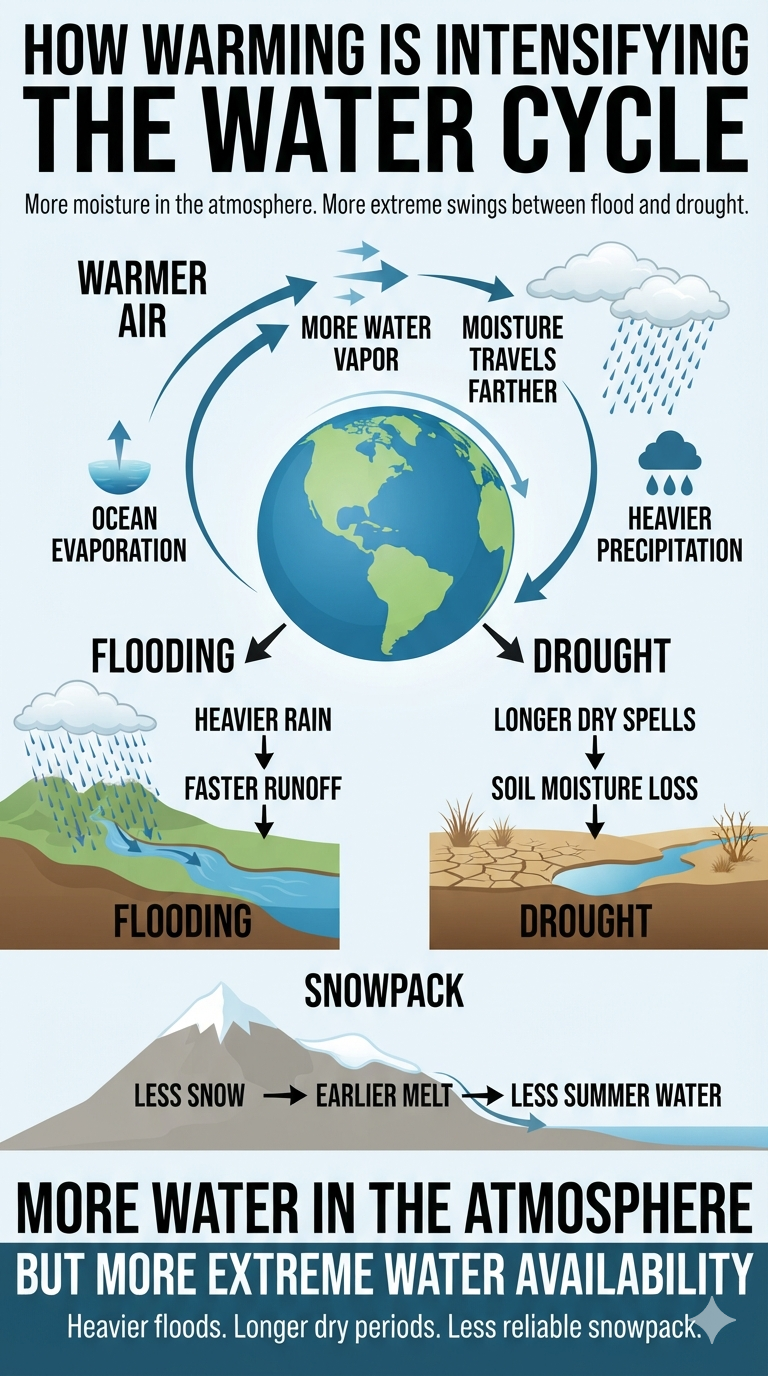
As greenhouse-gas-driven warming increases atmospheric moisture capacity and raises ocean temperatures, the hydrological cycle intensifies. The result is a climate system capable of moving greater quantities of energy and water through the atmosphere while increasing the potential for rapid transitions between extreme dryness and extreme precipitation.

This paper examines the latent heat engine as a mechanism linking ocean warming to atmospheric energy redistribution and explores how water-vapor feedback, moisture transport, precipitation intensification, soil-moisture depletion, wildfire risk, and hydroclimatic whiplash can interact to amplify the impacts of global warming.


1. The Ocean as a Planetary Energy Reservoir

The ocean absorbs the overwhelming majority of the excess energy accumulating in Earth’s climate system as a result of greenhouse-gas forcing. Much of this energy is stored as sensible heat—the thermal energy associated with the temperature of seawater.

The ocean, however, does not simply store this energy indefinitely. It continuously exchanges energy with the atmosphere and space through several pathways:

• Latent heat flux: energy transferred through evaporation.

• Longwave radiation: thermal infrared energy emitted by the ocean surface.

• Sensible heat flux: direct transfer of thermal energy between the ocean and atmosphere.

• Other fluxes: including energy associated with ocean currents and other processes.

Of these pathways, latent heat transfer through evaporation is the largest single component of the ocean’s surface energy loss under typical global-mean conditions.

Evaporation therefore functions as a planetary-scale cooling mechanism. The ocean supplies the energy required to convert liquid water into water vapor, transferring energy from the ocean into the atmosphere in a form that can subsequently be transported over enormous distances.

The approximate latent heat of vaporization of water is:

Lv ≈ 2.45 × 10⁶ J/kg

Thus, evaporation of one kilogram of water requires roughly 2.45 megajoules of energy under ordinary surface conditions.

That energy does not disappear. It is stored temporarily as latent heat in the water vapor.


2. The Ocean-Atmosphere Refrigeration Loop

The process can be conceptualized as a planetary refrigeration loop:

OCEAN ENERGY RESERVOIR
↓
Warm ocean water
↓
EVAPORATION AT THE SURFACE
↓
Latent heat removed from the ocean
↓
WATER VAPOR FORMED
↓
Transported by atmospheric circulation
↓
CONDENSATION IN THE ATMOSPHERE
↓
Latent heat released
↓
ATMOSPHERIC HEATING
↓
Convection and circulation
↓
CLOUDS • STORMS • PRECIPITATION

The critical point is that evaporation and condensation occur in different places and often at different times.

Evaporation extracts energy from the ocean surface. Atmospheric circulation can then transport the water vapor—and the latent energy associated with it—hundreds or thousands of kilometers before condensation releases that energy.

This creates a profound spatial separation between where energy is extracted and where energy is released.

A tropical ocean can therefore function as the energy source for atmospheric processes whose consequences occur far away, including over continents, midlatitude storm tracks, mountain ranges, and polar regions.


3. Evaporation: Extracting Energy From the Ocean

Evaporation occurs at the air-sea interface and is strongly influenced by sea-surface temperature, atmospheric humidity, wind speed, and the moisture gradient between the ocean and atmosphere.

When water molecules escape from the liquid surface into the atmosphere, they carry away latent energy.

The immediate effect is cooling of the evaporating surface.

Evaporation also preferentially removes water rather than dissolved salts, so sustained evaporation increases the salinity of the remaining surface water unless offset by precipitation, river discharge, or mixing.

The fundamental energy transfer can therefore be expressed as:

Ocean sensible heat → latent heat stored in atmospheric water vapor

The ocean has effectively converted thermal energy into a mobile atmospheric energy reservoir.


4. Condensation: Releasing the Stored Energy

When moist air rises and cools, it can reach saturation. Water vapor then condenses into cloud droplets or deposits as ice.

The reverse phase change releases approximately the same latent energy that evaporation consumed:

Water vapor → liquid water or ice + latent heat released

That released energy becomes thermal energy within the surrounding atmosphere.

This is known as latent heating.

Latent heating is fundamental to atmospheric convection. When condensation releases heat inside a rising air column, it can increase buoyancy and alter pressure gradients and circulation. In sufficiently favorable environments, this can intensify thunderstorms, tropical cyclones, mesoscale convective systems, and other weather phenomena.

The atmosphere therefore functions not merely as a passive recipient of ocean heat, but as a dynamic energy-transfer system.


5. The Spatial Mismatch: Moving Energy Across the Planet

One of the most consequential characteristics of latent heat transfer is its ability to transport energy far from its source.

The sequence is:

Warm ocean
→ Evaporation
→ Latent energy stored in water vapor
→ Atmospheric moisture transport
→ Rising and cooling air
→ Condensation
→ Latent heat release
→ Atmospheric circulation and precipitation

Energy extracted from a tropical ocean may therefore ultimately be released over a distant continent or at higher latitudes.

This creates a connection between ocean heat, atmospheric moisture transport, and extreme precipitation.

The hydrological cycle is therefore also an energy-transport cycle.


6. Climate Warming Supercharges the Hydrological Cycle

Greenhouse-gas warming alters this system in two important ways.

First, warmer oceans provide greater opportunity for evaporation.

Second, a warmer atmosphere can contain substantially more water vapor before reaching saturation. The Clausius-Clapeyron relationship indicates that the saturation vapor pressure of air increases by approximately 7% per °C of warming near Earth’s surface under typical conditions.

This does not mean that global atmospheric water vapor automatically increases by exactly 7% for every degree of warming. Actual atmospheric moisture depends on circulation, relative humidity, surface conditions, and moisture availability.

Nevertheless, the thermodynamic relationship creates a powerful constraint:

Warmer air
→ Greater moisture-holding capacity

This contributes to:

Warmer ocean
→ Greater evaporation
→ More atmospheric moisture
→ Greater latent energy reservoir

The result is an increasingly energetic hydrological cycle.


7. The Water-Vapor Feedback

Water vapor is itself a powerful greenhouse gas.

As the atmosphere warms, its capacity to contain water vapor increases. Increased atmospheric water vapor enhances absorption and re-emission of outgoing longwave radiation, contributing additional warming.

This creates a positive feedback:

Greenhouse-gas forcing
→ Atmospheric warming
→ Greater atmospheric moisture capacity
→ More water vapor
→ Greater greenhouse trapping
→ Additional warming
→ Further moisture increase

Water vapor therefore acts primarily as a feedback rather than the initial forcing in the present anthropogenic warming problem.

Carbon dioxide and other long-lived greenhouse gases initiate and sustain the radiative forcing. Water vapor responds rapidly to temperature changes and amplifies the resulting warming.

The water-vapor feedback is consequently one of the major mechanisms through which an initial forcing becomes a larger climate response.


8. From Water Vapor to Hydroclimatic Whiplash

The most consequential feature of an intensified hydrological cycle may not simply be greater average precipitation.

It is the potential for greater variability and more intense precipitation occurring alongside accelerated drying between events.

This creates the conditions for hydroclimatic whiplash:

HYDROCLIMATIC WHIPLASH

Warming + high evaporative demand
↓
Rapid moisture loss from the land surface
↓
Flash drought
↓
Vegetation stress and wildfire risk

At the same time:

Greater atmospheric moisture capacity
↓
Increased moisture transport
↓
Moisture convergence and atmospheric ascent
↓
Condensation
↓
Latent heating
↓
Stronger convection
↓
Extreme precipitation
↓
Flooding

The same warming that increases atmospheric moisture capacity can therefore contribute to both drying and flooding extremes, depending on atmospheric circulation, surface conditions, and moisture availability.


9. The Dry Phase: Accelerated Evaporation

During periods without sufficient precipitation, increased evaporative demand can rapidly remove water from soils, vegetation, and surface reservoirs.

The sequence can become:

Warming
→ Higher evaporative demand
→ Soil-moisture loss
→ Vegetation stress
→ Flash drought
→ Wildfire vulnerability

This process is especially important when high temperatures, low relative humidity, strong winds, and persistent atmospheric ridging occur simultaneously.

The landscape can therefore transition rapidly from merely dry to extremely flammable.

Loss of vegetation and soil moisture can then produce secondary consequences, including reduced evaporative cooling, increased surface temperatures, ecological stress, agricultural losses, and increased wildfire potential.


10. The Wet Phase: Atmospheric Moisture as Stored Energy

The opposite phase occurs when moisture-rich air encounters atmospheric conditions capable of producing large-scale ascent and condensation.

A warmer atmosphere can transport more water vapor, and when that moisture converges and rises, the resulting condensation can release substantial latent heat.

The process can become:

Warm ocean
→ Enhanced evaporation
→ Greater atmospheric moisture
→ Moisture transport
→ Moisture convergence
→ Atmospheric ascent
→ Condensation
→ Latent heating
→ Stronger convection

This does not mean every heavy precipitation event is directly caused by latent heat release. Atmospheric dynamics, instability, moisture convergence, topography, fronts, and storm-scale processes all matter.

However, latent heating can provide an important positive dynamical feedback within convective systems.


11. The Atmospheric Pump

Condensation releases latent heat into the rising air column.

That heating can increase buoyancy and sustain or strengthen upward motion. Stronger ascent can promote additional condensation, which releases additional latent heat.

The simplified feedback is:

Moisture
→ Condensation
→ Latent heating
→ Increased buoyancy
→ Atmospheric ascent
→ More condensation

This is one reason latent heating is so important to intense convective weather.

In tropical cyclones, for example, condensation within deep convection is a major energy source supporting the storm’s circulation. Similar thermodynamic processes operate in severe thunderstorms and other convective systems.


12. From Atmospheric Rivers to Hydroclimatic Whiplash

An atmosphere carrying greater quantities of water vapor can transport larger moisture fluxes when circulation patterns are favorable.

When this moisture converges over land, particularly against mountains or along strong frontal boundaries, precipitation can become extreme.

This produces a potentially damaging sequence:

Ocean warming
→ Greater evaporation
→ Greater atmospheric moisture
→ Long-distance moisture transport
→ Moisture convergence
→ Extreme precipitation

If this occurs after a prolonged dry period, the consequences can be amplified.

A landscape already stressed by drought may suddenly receive enormous rainfall volumes. Much of that water may run off rather than infiltrate efficiently, especially where soils are hardened, vegetation has been damaged, or wildfire has altered the surface.

Thus:

Drought
→ Wildfire / vegetation loss
→ Reduced infiltration
→ Extreme rainfall
→ Runoff
→ Flooding and erosion

The resulting cycle is not simply drought followed by rain.

It is a hydroclimatic whiplash regime in which the physical consequences of one extreme can increase vulnerability to the next.


13. Secondary Feedbacks

The intensified water and energy cycle interacts with several additional climate feedbacks.

13.1 Cloud Feedback

Clouds exert competing radiative effects.

Low, thick clouds can reflect incoming solar radiation and produce cooling, while high, thin clouds can allow much of incoming sunlight to pass through while efficiently absorbing outgoing infrared radiation.

Cloud responses to warming are therefore complex and regionally variable. They should not be reduced to a simple assumption that “more clouds equals warming.”

Nevertheless, changes in cloud amount, altitude, optical properties, and lifetime can alter Earth’s radiation budget and therefore interact with the broader climate feedback system.

13.2 Land-Surface Feedback

Evaporation normally consumes energy and cools the land surface.

When soil moisture becomes depleted, less energy can be transferred through evapotranspiration. More incoming energy therefore remains available for sensible heating.

The feedback can become:

Soil drying
→ Less evapotranspiration
→ Less evaporative cooling
→ Higher surface temperature
→ Greater atmospheric dryness / evaporative demand
→ Further soil drying

This is particularly important during heat waves and drought.

13.3 Cryosphere Feedbacks

Moisture transported toward high latitudes can contribute to precipitation over ice sheets and glaciers. The climate effect depends on whether precipitation falls as snow or rain and on the season, elevation, and surface energy balance.

Meanwhile, warming itself can reduce snow and ice cover, lowering surface albedo and increasing absorption of solar radiation.

Thus, moisture transport interacts with the cryosphere in ways that can either temporarily increase mass accumulation or accelerate surface melting, depending on conditions.


14. The Central Feedback Architecture

The complete system is best understood not as a single feedback loop, but as an interconnected network:

GREENHOUSE-GAS FORCING
↓
GLOBAL WARMING
↓
┌───────────────────────────────┐
↓ ↓
WARMER OCEANS WARMER ATMOSPHERE
↓ ↓
MORE EVAPORATION GREATER MOISTURE CAPACITY
↓ ↓
└──────────────┬────────────────┘
↓
MORE WATER VAPOR
↓
┌────────┴─────────┐
↓ ↓
WATER-VAPOR MOISTURE TRANSPORT
GREENHOUSE ↓
FEEDBACK MOISTURE CONVERGENCE
↓ ↓
MORE WARMING ┌──────┴───────┐
↓ ↓
HEAVY RAINFALL LATENT HEATING
↓ ↓
FLOODING CONVECTIVE ENERGY
↓
STRONGER CONVECTION

Meanwhile:

WARMING + EVAPORATIVE DEMAND
↓
SOIL-MOISTURE LOSS
↓
FLASH DROUGHT
↓
VEGETATION STRESS
↓
WILDFIRE RISK
↓
LANDSCAPE DEGRADATION
↓
REDUCED INFILTRATION
↓
EXTREME RAINFALL
↓
RUNOFF / EROSION
↓
HYDROCLIMATIC WHIPLASH

The important point is that these are coupled processes, not independent events.

Ocean warming changes evaporation. Evaporation changes atmospheric moisture. Atmospheric moisture changes radiative forcing and precipitation potential. Precipitation changes soil moisture. Soil moisture changes surface temperature and wildfire risk. Wildfire and vegetation loss change runoff and infiltration. Extreme rainfall then interacts with the altered landscape.

The system contains multiple reinforcing pathways.


15. Why This Matters for Climate Acceleration

Climate change is often described as a gradual increase in global mean temperature.

That description is mathematically useful but physically incomplete.

The impacts experienced by societies are produced by the interaction of temperature with:

• atmospheric moisture
• ocean heat
• evaporation
• precipitation
• soil moisture
• atmospheric circulation
• wildfire
• snow and ice
• flooding
• drought
• ecosystems
• agriculture
• infrastructure
• human vulnerability

Consequently, the consequences of warming can increase faster than the mean temperature itself.

A relatively small change in global mean temperature can alter the probability, intensity, and interaction of multiple extremes.

This is one reason climate impacts can appear increasingly nonlinear.


16. The Latent Heat Engine as an Accelerator of Climate Impacts

The fundamental physical relationship is straightforward:

Ocean heat
→ Evaporation
→ Atmospheric water vapor
→ Latent energy transport
→ Condensation
→ Atmospheric heating

But the consequences extend well beyond this basic energy transfer.

The intensified cycle can simultaneously produce:

More evaporation
+
More water vapor
+
Greater moisture transport
+
Greater latent heating
+
Greater precipitation potential
+
Greater evaporative demand

This creates the thermodynamic foundation for a climate capable of greater swings between extreme wetness and extreme dryness.

Hydroclimatic whiplash is therefore not an independent phenomenon disconnected from global warming. It can emerge from the interaction between a warmer atmosphere, a warmer ocean, intensified moisture transport, changing circulation, and the land surface’s declining ability to buffer extreme moisture losses and gains.


17. Final Assessment

Latent heat transfer through evaporation is a fundamental component of the ocean-atmosphere energy budget and the largest single mechanism of ocean surface energy loss under typical global-mean conditions.

Its significance extends far beyond cooling the ocean.

Evaporation transfers energy from the ocean into atmospheric water vapor. Atmospheric circulation transports that moisture and its associated latent energy across large distances. Condensation subsequently releases the stored energy as latent heat, helping power atmospheric convection and precipitation.

Anthropogenic warming intensifies the conditions under which this system operates. Warmer oceans increase evaporation potential, while warmer air can support substantially more water vapor. Water vapor then strengthens the greenhouse effect, while increased atmospheric moisture can increase the potential for extreme precipitation when moisture converges and air rises.

At the land surface, increased evaporative demand can accelerate soil-moisture depletion, flash drought, vegetation stress, and wildfire risk. When moisture-rich air subsequently arrives and precipitation becomes extreme, the same climate system can shift abruptly from drought to flooding.

The resulting system can be summarized as:

Warming
→ Evaporation
→ Water vapor
→ Latent energy transport
→ Condensation
→ Atmospheric heating
→ Extreme precipitation

while simultaneously:

Warming
→ Evaporative demand
→ Soil-moisture loss
→ Flash drought
→ Wildfire risk

The two pathways ultimately intersect through hydroclimatic whiplash.

The central conclusion is therefore not simply that a warmer planet contains more water vapor. It is that warming is altering the planet’s energy-and-water transport machinery.

The hydrological cycle is also a thermodynamic engine.

As the climate warms, that engine can move greater quantities of water and latent energy through the atmosphere, increasing the potential for rapid transitions among heat, drought, wildfire, extreme precipitation, flooding, and other cascading impacts.

Understanding this latent heat engine is therefore essential to understanding why the consequences of global warming can become increasingly interconnected, nonlinear, and disruptive even when changes in global mean temperature appear comparatively gradual.
bookmark_borderHeat-Triggered Flash Droughts: The Rapid Intensification of Heat, Drought, and Wildfire Risk

by Daniel Brouse

The Trend

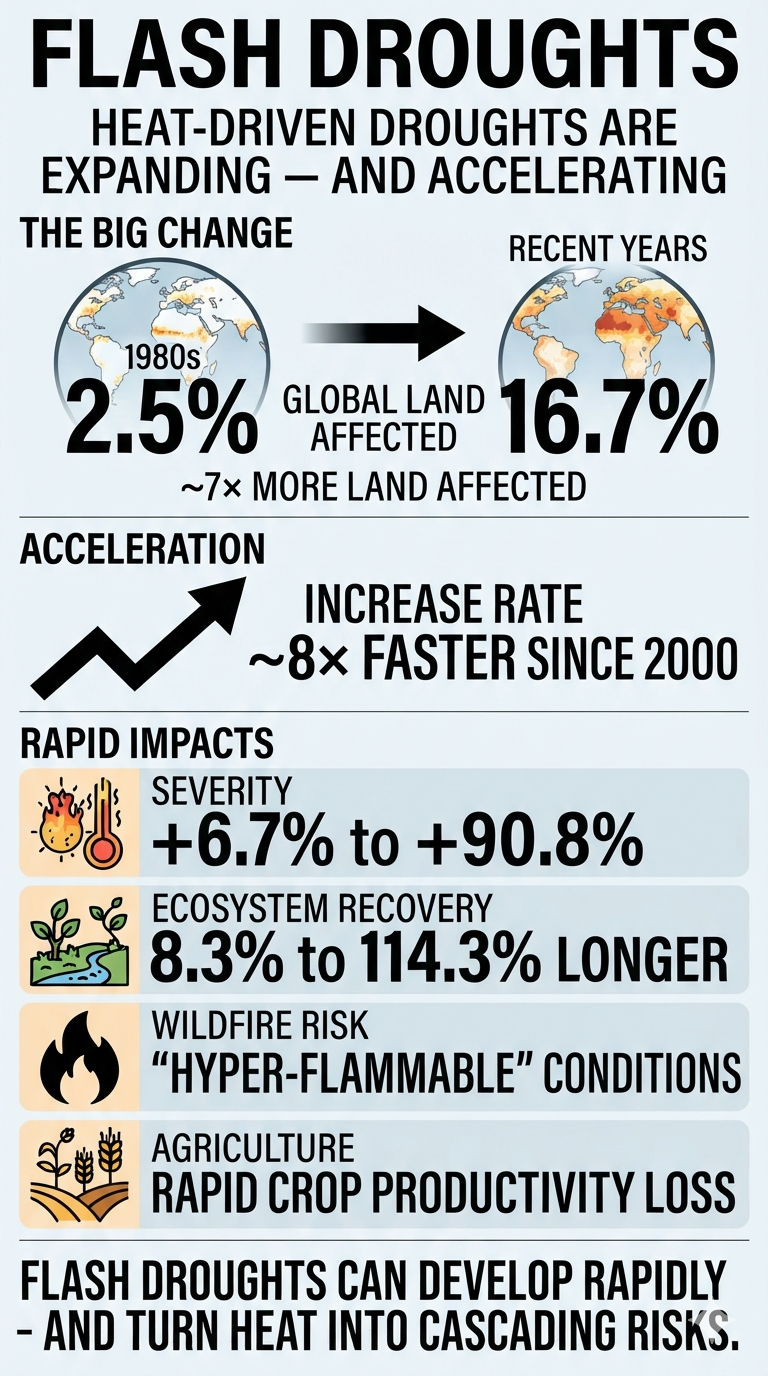
Flash droughts are one of the three fastest-accelerating climate extremes. The share of global land affected by heat-driven drought has expanded dramatically—from approximately 2.5% in the 1980s to 16.7% in recent years. The rate of increase has also accelerated, rising roughly eightfold since 2000.

This shift is important because heat-triggered droughts behave differently from conventional droughts. Rather than developing gradually over months or years, they can emerge within weeks, leaving agriculture, ecosystems, water managers, and communities with far less time to respond.

The Impact

Heat-triggered flash droughts are rapid-onset, severe moisture deficits initiated or intensified by extreme heat and unusually high atmospheric dryness, rather than simply by a prolonged lack of precipitation.

Think of the process as a high-powered hair dryer aimed at the landscape. Extreme heat and dry air rapidly pull moisture from vegetation and soils. As available moisture disappears, plants become stressed, agricultural productivity declines, wildfire danger rises, and water supplies can deteriorate—all on a timescale far shorter than that of conventional drought.

The result is a compound climate hazard in which heat and drought reinforce one another, producing impacts that can escalate rapidly.

The Mechanics of “Hair Dryer” Droughts

Conventional droughts often develop gradually, giving ecosystems and communities more time to adjust. Flash droughts can materialize within weeks, particularly when extreme heat coincides with atmospheric dryness.

1. Evapotranspiration Spike

Extreme temperatures combined with a high vapor pressure deficit (VPD) increase the atmosphere’s demand for moisture. Water is transferred from soil and vegetation into the atmosphere at an unsustainable rate.

This accelerated evapotranspiration rapidly depletes soil moisture and places plants under severe water stress.

2. Soil Overheating

Normally, evaporation of soil moisture helps cool the land surface. As soil moisture disappears, that evaporative cooling weakens.

The ground therefore heats more intensely, creating a feedback loop:

Less soil moisture → less evaporative cooling → hotter soil → greater plant stress → greater moisture loss

The result can be intense soil-temperature extremes that further damage vegetation and agricultural productivity.

3. Regional Differences

The development of heat-triggered flash droughts varies with regional climate and ecosystem characteristics.

In high-latitude and relatively wet regions, extreme heat can rapidly accelerate moisture extraction because vegetation and soils initially contain substantial amounts of water.

In subtropical regions, plants may respond by closing their stomata to conserve water. This can slow immediate moisture loss but also restrict photosynthesis and carbon uptake, increasing longer-term ecosystem stress.

Cascading Ecological Impacts

The combination of extreme heat and rapidly developing dryness can produce impacts substantially greater than those associated with conventional flash droughts.

MetricHeat-Triggered Flash DroughtConventional Flash Drought
Severity6.7%–90.8% higher severityBaseline severity
Ecosystem Recovery8.3%–114.3% longer recovery timesNormal recovery trajectory
Wildfire RiskCan create “hyper-flammable” conditionsElevated baseline fire risk
Primary Agricultural ImpactCan rapidly devastate cropland productivityGeneral agricultural stress

These differences matter because ecosystems may not simply experience a more severe drought—they may experience a faster and more damaging transition from normal conditions to extreme environmental stress.

The Hyper-Flammability Multiplier

One of the most dangerous consequences occurs when a heat-triggered flash drought overlaps an existing conventional drought.

The slow drought has already depleted vegetation and soil moisture. The sudden arrival of extreme heat and atmospheric dryness then accelerates the drying process, pushing vegetation toward an exceptionally flammable state.

This creates a hyper-flammability multiplier:

Existing drought → Extreme heat + dry atmosphere → Rapid vegetation and soil drying → Loss of natural moisture + evaporative cooling → Hyper-flammable landscape → Faster-spreading, more intense wildfires

Once ignited, fires in these conditions can spread more rapidly, burn with greater intensity, and become substantially more difficult to contain.

A Rapidly Escalating Compound Hazard

Heat-triggered flash droughts demonstrate why temperature, atmospheric moisture, soil moisture, drought, and wildfire cannot always be treated as independent hazards.

Extreme heat can accelerate moisture loss. Moisture loss can increase land-surface temperatures. Hotter, drier vegetation becomes more flammable. Wildfires then add another layer of ecological and economic damage.

What once might have been a gradual drought can therefore become a rapidly escalating compound disaster—one capable of overwhelming agricultural, ecological, and emergency-response systems before communities have sufficient time to adapt.

The Four Main Types of Drought—and Where Flash Droughts Fit

Drought is not a single phenomenon. It can be classified according to where the water deficit occurs and how it affects the environment and society. Meteorological drought occurs when a region receives substantially less precipitation than its historical average over a defined period. Agricultural drought occurs when soil moisture falls below levels needed to support healthy plant growth, often intensified by high temperatures and accelerated evapotranspiration. Hydrological drought develops as prolonged water shortages reduce streamflow, river levels, reservoirs, lakes, and groundwater supplies. Socioeconomic drought occurs when limited water supplies begin affecting society, including drinking water, agriculture, energy production, industry, food prices, and other economic systems.

Where Do Flash Droughts Fit?

Flash drought is different from these four categories because it describes the speed and mechanism of drought development, rather than simply the sector or water reservoir being affected.

A flash drought can develop rapidly—often within weeks—when unusually high temperatures, atmospheric dryness, and accelerated evapotranspiration rapidly deplete soil moisture.

In other words, flash drought is best understood as a rapid-onset pathway into agricultural and potentially hydrological drought, rather than a completely separate fifth category.

Meteorological drought → reduced precipitation
Heat-triggered flash drought → extreme heat + atmospheric dryness → rapid moisture loss
Agricultural drought → depleted soil moisture → crop and vegetation stress
Hydrological drought → depleted streams, reservoirs, and groundwater
Socioeconomic drought → water shortages → impacts on people and the economy

Importantly, these pathways do not always occur in sequence. A flash drought can develop with little initial precipitation deficit when extreme heat and high atmospheric moisture demand rapidly extract water from soils and vegetation.

This is what makes heat-triggered flash droughts particularly dangerous: the landscape can transition from relatively normal conditions to severe agricultural and wildfire stress in a matter of weeks, leaving considerably less time for detection, adaptation, and response.

bookmark_borderGlobal Wildfire Smoke

by Daniel Brouse

Global warming is exactly that—global. These two videos of the 2026 wildfire season provide a striking example.

The first video shows wildfire smoke spreading across North America. The second follows that smoke as it is transported across the atmosphere and circulates around the globe, reaching the UK and Europe.

The second video also captures smoke from wildfires burning across Spain, France, and Greece, along with massive fires in the Siberian forests.

Wildfire smoke does not recognize national borders—and neither does climate change. What happens in one part of the world can affect the atmosphere, climate, and air quality thousands of miles away.

bookmark_borderA More Episodic Hydrologic Cycle in a Warming Climate

by Daniel Brouse

Changing Atmospheric Moisture Transport, Precipitation Intensity, and the Redistribution of Water

Abstract

Climate warming is altering the atmospheric hydrologic cycle in ways that extend beyond changes in average precipitation. This paper examines the hypothesis that warming is increasing atmospheric moisture residence time and transport distance while simultaneously intensifying precipitation and, in some regions, producing more spatially concentrated and temporally episodic rainfall. The resulting hydrologic regime may be characterized by heavier precipitation events, longer intervening dry periods, declining snowpack, and increasing disparities in water availability.

Evidence from atmospheric moisture-tracking, precipitation observations, climate modeling, and snowpack records supports substantial portions of this hypothesis. A 2026 analysis of 35 years of atmospheric reanalysis data found statistically significant increases in moisture-transport distance and residence time across portions of the southwestern United States and southern Great Plains. In some watersheds, moisture traveled approximately 50–80 km farther and remained in the atmosphere 2–4 hours longer than in earlier decades.

At the same time, heavy precipitation has increased across the contiguous United States since the 1950s, particularly in the Northeast and Midwest. Other research indicates that warming can increase precipitation intensity while reducing the size or duration of individual precipitation systems in some seasons and regions. Meanwhile, observations across the western United States show longer and more variable dry periods and substantial declines in snowpack.

The evidence therefore supports a modified version of the proposed hypothesis: warming is not generally causing atmospheric moisture to travel shorter distances before precipitation. Instead, warming is increasing atmospheric moisture residence time and transport distance while altering the timing, intensity, duration, and spatial distribution of precipitation. The resulting combination can produce a more episodic hydrologic cycle in which extreme precipitation and flooding coexist with longer dry intervals, drought, earlier snowmelt, and declining water-storage capacity.


1. Introduction

The hydrologic cycle is often described in terms of precipitation totals: how much rain or snow falls over a particular location during a given period. This approach, while useful, can obscure an important characteristic of the climate system—the distribution of precipitation in space and time.

Two regions could receive identical annual precipitation while experiencing radically different hydrologic conditions. One might receive moderate precipitation distributed throughout the year. The other might experience prolonged dry periods punctuated by a few exceptionally intense storms.

The consequences are very different.

The first regime promotes relatively consistent soil moisture, groundwater recharge, snow accumulation, and streamflow. The second can produce the seemingly contradictory combination of flooding and drought: intense storms generate rapid runoff and flooding, while the longer intervals between storms allow soils and vegetation to dry and reduce groundwater and snowpack storage.

This raises a fundamental question:

Is climate warming changing not merely how much precipitation occurs, but how atmospheric moisture is transported and how precipitation is distributed across time and space?

The hypothesis examined here is:

Climate warming is altering the atmospheric hydrologic cycle by increasing atmospheric moisture residence time and transport distance while simultaneously increasing precipitation intensity and, in some regions, reducing the spatial extent and duration of individual precipitation events. This may produce a more episodic hydrologic cycle characterized by heavier flooding when precipitation occurs, longer intervening dry periods, declining snowpack, and greater spatial disparities in water availability.

Recent research provides an unusually strong opportunity to test this hypothesis because scientists can now combine decades of atmospheric reanalysis with Lagrangian moisture tracking, precipitation observations, radar data, climate models, and long-term snowpack records.


2. Atmospheric Moisture Is Traveling Farther

One of the most direct tests of the hypothesis is whether scientists can actually measure changes in the distance atmospheric moisture travels before becoming precipitation.

Until recently, this was difficult to quantify over sufficiently long periods. Modern atmospheric reanalysis and moisture-tracking techniques now make it possible.

A 2026 study published in Geophysical Research Letters analyzed 35 years of reanalysis data and tracked atmospheric moisture contributing to precipitation across watersheds in the contiguous United States. The study found statistically significant trends in both the length scale of moisture recycling and the atmospheric residence time of water vapor across portions of the Southwest and southern Great Plains.

In some regions, moisture now travels approximately:

  • 50–80 km farther before precipitation
  • 2–4 hours longer in the atmosphere

than it did approximately 35 years earlier.

This is an important result because it directly confirms that moisture transport distance can be measured over decades and that measurable changes are occurring.

The study also found a shift in moisture sources. On average, evaporation from terrestrial surfaces has decreased while the contribution from oceanic evaporation has increased in the examined regions. The researchers concluded that moisture over land is traveling farther and remaining in the atmosphere longer before precipitation.

This result is consistent with earlier theoretical work on atmospheric water-vapor residence time. A major review in Nature Reviews Earth & Environment found that the global mean residence time of atmospheric water vapor is approximately 8–10 days, although the median is shorter because residence times have a highly skewed distribution. The review concluded that anthropogenic warming is expected to increase atmospheric water-vapor residence time by approximately 3–6% per °C of warming, thereby increasing the distance moisture travels between evaporation and precipitation.

Result

The first component of the hypothesis is strongly supported.

Atmospheric moisture is not generally traveling a shorter distance before precipitation. Evidence instead indicates that, in important regions, warming is increasing moisture residence time and transport distance.


3. Why a Warmer Atmosphere Changes Moisture Transport

The physical mechanism is straightforward.

A warmer atmosphere can contain more water vapor. The Clausius–Clapeyron relationship indicates that the saturation vapor pressure of air increases by approximately 7% per °C of warming near Earth’s surface.

But atmospheric moisture does not simply remain where it evaporates.

It is transported by atmospheric circulation. As moisture remains available for longer periods before precipitation, it can be carried farther from its original source.

This creates an important distinction between moisture-source distance and precipitation footprint.

A storm can receive moisture from farther away while simultaneously depositing a large portion of that moisture over a relatively small geographic area.

Consequently:

Longer moisture transport does not necessarily mean broader precipitation.

This distinction resolves an apparent contradiction in the original hypothesis.


4. Increasing Precipitation Intensity

The second major component of the hypothesis concerns precipitation intensity.

Here the observational evidence is strong.

The U.S. Environmental Protection Agency reports that heavy precipitation events have become more frequent across the contiguous United States since the 1950s, with particularly strong increases in the Northeast and Midwest. The EPA also concludes that human-caused warming has contributed to the increase.

The physical mechanism is again related to atmospheric moisture.

When additional water vapor is available to a storm, precipitation intensity can increase substantially. Consequently, precipitation totals averaged over a month or year can conceal a major change in event intensity.

For example, suppose a region historically receives 40 inches of precipitation annually.

That 40 inches could theoretically occur as:

40 inches ÷ 365 days = relatively frequent moderate precipitation

or instead as:

long dry intervals + several extremely heavy storms.

The annual total might be similar while the hydrologic consequences are dramatically different.

The second regime produces more runoff, erosion, flash flooding, infrastructure stress, and potentially less effective groundwater recharge.


5. Evidence for More Spatially Concentrated Precipitation

The hypothesis becomes more complicated when spatial extent is considered.

Research does not support a universal rule that precipitation systems are always becoming smaller.

Instead, the response varies according to storm type, season, geography, and atmospheric circulation.

A modeling study examining precipitation characteristics over the contiguous United States found that warming can increase precipitation intensity while reducing storm size. In its simulations, summertime storms became more intense but smaller, while winter storms also tended toward reduced spatial extent and, in some cases, fewer and shorter-duration events.

Other research reaches a more nuanced conclusion.

A study of precipitation-event spatial extent using high-resolution regional climate models found that the response depends upon the size of the precipitation system. Larger systems can become more frequent and larger, while smaller systems can decrease in number.

This means the most defensible conclusion is not:

All storms are becoming smaller.

Rather:

Warming is changing the relationship between precipitation intensity, spatial extent, storm organization, and duration. Some precipitation regimes are becoming more intense and spatially concentrated even as other large-scale systems may expand.

That distinction is essential.


6. Shorter Storms Can Produce Longer Dry Intervals

The temporal component of the hypothesis may be even more important than storm size.

A study of precipitation characteristics under warming found that, in model simulations, increasing precipitation intensity was accompanied by changes in storm frequency, size, and duration. In particular, summertime precipitation systems became more intense and smaller, while winter systems also showed reductions in size and, in some cases, duration and frequency.

Meanwhile, observations provide direct evidence of increasing dry intervals in parts of the United States.

A USGS-supported study examined daily precipitation records from 337 long-term weather stations across the western United States from 1976–2019. It found reduced annual precipitation across much of the region, increasing precipitation variability, and increasing duration of dry intervals. The mean dry interval increased approximately 0.6 days per decade, while the longest dry interval increased approximately 2.4 days per decade.

This is precisely the type of change expected from a more episodic hydrologic cycle.

The atmosphere does not necessarily become uniformly drier.

Instead, precipitation can become less evenly distributed.


7. The Emerging Pattern: Flooding and Drought

The combined evidence suggests that the most important change may not be a simple shift toward “more rain” or “less rain.”

It may be a shift toward greater hydrologic variability.

A simplified conceptual model is:

Warming → Greater atmospheric moisture capacity → Longer moisture residence time → Longer moisture transport pathways → Greater moisture availability to precipitation systems → More intense precipitation → Greater runoff and flood potential

Meanwhile:

Longer intervals between precipitation events → Greater evapotranspiration and soil-moisture loss → Longer dry periods → Drought stress

Greater runoff and flood potential

This produces an apparent paradox:

More water falling during individual storms can coexist with less water available between storms.

The distinction is between precipitation flux and water storage.

A very intense storm can move enormous quantities of water through a watershed without necessarily increasing long-term water availability proportionally.

If rainfall arrives faster than soil infiltration capacity, a larger fraction can become surface runoff. That water rapidly enters streams and rivers rather than being retained in soils or replenishing groundwater.

Thus:

More precipitation ≠ more available water.


8. Snowpack: The Natural Water Reservoir Is Shrinking

Snowpack introduces another critical component.

Mountain snowpack functions as a natural seasonal reservoir, storing winter precipitation and releasing it gradually during spring and summer.

As temperatures rise, precipitation increasingly falls as rain rather than snow in marginal snow zones. Existing snow also melts earlier.

NOAA reports that average spring snowpack across the western United States declined by approximately 20% between 1955 and 2020.

The significance extends beyond skiing or mountain ecology.

Snowpack controls the timing of water delivery to downstream watersheds.

A precipitation regime that shifts from:

winter snow → spring melt → summer runoff

toward:

winter rain → immediate runoff

loses part of the natural storage function of the mountain snowpack.

This creates a second form of hydrologic episodicity.

Instead of storing water for future months, precipitation is increasingly capable of moving rapidly through the watershed.


9. A Changing Geography of Water

The 2026 moisture-transport research adds another dimension to the problem.

If the source of precipitation changes, the hydrologic security of a region can become increasingly dependent upon atmospheric processes occurring far beyond its borders.

The study found that portions of the United States are receiving moisture that has traveled farther through the atmosphere and that a greater share of the moisture is associated with oceanic rather than terrestrial sources.

This means the traditional concept of a watershed may be insufficient for understanding future water security.

A watershed describes where water flows after it reaches the surface.

Atmospheric moisture tracking describes where that water came from before it arrived.

The two systems are connected:

Ocean → atmosphere → atmospheric transport → precipitation → watershed → river/groundwater → ocean

Climate change can alter both the atmospheric and terrestrial portions of this cycle.

Consequently, two regions receiving similar annual precipitation totals may have substantially different water-security risks depending on:

  • moisture-source location,
  • atmospheric transport distance,
  • residence time,
  • precipitation intensity,
  • storm footprint,
  • dry-period duration,
  • snowpack,
  • evapotranspiration,
  • soil infiltration,
  • groundwater recharge,
  • and runoff.

10. Evaluation of the Hypothesis

The evidence can now be evaluated component by component.

Hypothesis componentEvidenceAssessment
Atmospheric moisture residence time is increasingTheory + observationsSupported
Moisture transport distance is increasing35-year U.S. moisture-tracking studySupported regionally
Oceanic moisture contribution is increasing in some U.S. regions2026 moisture-tracking studySupported regionally
Heavy precipitation is increasingLong-term U.S. observationsStrongly supported
Precipitation intensity is increasing with warmingObservational/model evidenceStrongly supported
Precipitation spatial extent is decreasingModeling/observational evidencePartially supported; highly regional
Precipitation duration is decreasingModel evidencePartially supported; storm-dependent
Dry intervals are increasingWestern U.S. observationsSupported regionally
Snowpack is decliningLong-term observationsStrongly supported in western U.S.
Water availability is becoming more spatially variableMultiple lines of evidenceSupported

The hypothesis therefore survives testing, but with an important modification.

The evidence does not support a universal reduction in moisture transport distance. It supports the opposite.

Nor does it establish that every precipitation event is becoming smaller or shorter.

Instead, the evidence supports a broader and more physically consistent hypothesis:

Anthropogenic warming is increasing atmospheric moisture availability and, in many regions, atmospheric moisture residence time and transport distance. At the same time, warming is increasing precipitation intensity and altering storm size, duration, frequency, and spatial organization. These changes can increase precipitation variability, producing heavier precipitation and flooding in some periods while lengthening dry intervals, reducing snowpack, and increasing water scarcity in others.


11. Implications for Flood Risk

This distinction has major implications for flood-risk assessment.

Traditional infrastructure design often relies heavily on historical precipitation statistics.

But if precipitation characteristics are changing, the historical distribution may no longer be stationary.

A watershed can experience:

longer dry periods

followed by

more intense rainfall

followed by

rapid runoff and flooding.

The flood hazard is therefore not necessarily proportional to annual precipitation.

Two watersheds receiving identical annual precipitation could have radically different flood risk if one receives its precipitation in fewer, more intense events.

This is particularly important for:

  • dams,
  • spillways,
  • stormwater systems,
  • culverts,
  • bridges,
  • retaining structures,
  • drainage systems,
  • floodplain management,
  • agricultural planning,
  • and reservoir operations.

The relevant engineering question increasingly becomes not simply:

How much precipitation does this watershed receive?

but:

How quickly can the atmosphere deliver precipitation to this watershed, how intensely does it fall, how spatially concentrated is it, and how rapidly can the watershed absorb or discharge it?


12. Implications for Water Management

The findings also suggest that water-management strategies based primarily on annual precipitation totals may become increasingly inadequate.

A reservoir can compensate for some variability by storing water, but natural storage systems such as snowpack and soil moisture cannot necessarily be replaced easily.

The loss of snowpack is particularly consequential because it changes the timing of water availability.

A warmer climate can therefore produce the following sequence:

More atmospheric water

→ more intense precipitation

→ more rapid runoff

→ greater flood risk

while simultaneously:

less snow storage

→ earlier runoff

→ lower summer streamflow

→ greater water scarcity

This is not contradictory.

It is the signature of a hydrologic system in which water moves through the system more rapidly and less predictably.


13. Conclusions

The hypothesis that climate warming is fundamentally altering atmospheric moisture transport and precipitation distribution is supported by multiple independent lines of evidence.

The strongest new evidence comes from atmospheric moisture tracking. A 35-year analysis of U.S. watersheds demonstrates that, in portions of the Southwest and southern Great Plains, atmospheric moisture is traveling farther and remaining airborne longer before precipitation. In some regions, the increase reaches approximately 50–80 km in transport distance and 2–4 hours in atmospheric residence time.

At the surface, heavy precipitation events have increased across the United States since the 1950s. Research further indicates that warming can alter precipitation-event size and duration, with some precipitation systems becoming more intense but spatially smaller and/or shorter-lived.

At the same time, observations from the western United States show increasing precipitation variability and longer dry intervals, while spring snowpack has declined substantially.

Taken together, these observations point toward a fundamental change in the structure of the hydrologic cycle.

The critical change may not be simply:

more precipitation vs. less precipitation.

It may instead be:

more variability → greater intensity → longer dry intervals → less natural storage → greater spatial and temporal disparities in water availability.

The atmosphere can transport moisture farther while precipitation becomes more concentrated when and where atmospheric conditions trigger rainfall. Consequently, longer moisture pathways and more localized precipitation are not contradictory processes.

The emerging picture is of a hydrologic cycle increasingly characterized by greater atmospheric moisture mobility, more intense precipitation events, altered storm dimensions, longer dry intervals, declining snow storage, and greater separation between flood and drought conditions.

This represents a shift from thinking about climate change primarily as a change in precipitation quantity toward understanding it as a change in water-cycle dynamics.

The most important future research should therefore integrate four previously separated measurements:

  1. Where atmospheric moisture originates
  2. How far and how long it travels
  3. How precipitation is distributed spatially and temporally when it arrives
  4. How efficiently the resulting water is retained as snow, soil moisture, groundwater, and reservoir storage

That integrated framework could provide a much more complete measure of whether climate change is producing an increasingly episodic hydrologic cycle—one in which water arrives in larger pulses but becomes less reliably available between those pulses.


Key References

  • Aerenson, T. et al. (2026). Precipitation Over the Contiguous United States Is Coming From Farther Away Than in the Past. Geophysical Research Letters.
  • Gimeno et al. (2021). The residence time of water vapour in the atmosphere. Nature Reviews Earth & Environment.
  • U.S. Environmental Protection Agency. Extreme Precipitation.
  • Chang et al. (2016). Changes in Spatio-temporal Precipitation Patterns in Changing Climate Conditions.
  • Matte, Christensen & Ozturk (2022). Spatial extent of precipitation events: when big is getting bigger. Climate Dynamics.
  • Zhang et al. (2021). Five decades of observed daily precipitation reveal longer and more variable drought events across much of the western United States. Geophysical Research Letters.
  • NOAA Climate.gov. Large declines in snowpack across the U.S. West.

The central finding is stronger than the original hypothesis in one respect: the evidence now indicates that warming is not simply redistributing precipitation closer to its moisture source. The atmosphere is carrying moisture farther, while the precipitation system can nevertheless deliver that moisture in increasingly intense, episodic pulses. That distinction may be the key to understanding why flooding and drought can intensify within the same changing hydrologic system.

bookmark_borderClimate Change and Moisture Transport

I’m wondering whether there is any way to quantify whether precipitation is now falling more rapidly over smaller areas and closer to where the moisture originates, potentially contributing to historically high-volume flooding. Conversely, could less precipitation falling over broader areas be contributing to worsening drought and diminishing inland snowpack? Is there any long-term tracking of atmospheric moisture transport distances that could show whether these patterns have changed over the decades?

Yes—what you’re describing is a real area of hydrologic and atmospheric research. Scientists can track both where atmospheric moisture originates and how far it travels before being precipitated out. In general, atmospheric moisture remains in the atmosphere for about 9 days before being “rained out” as precipitation.

Several measurements are useful for this:

* Integrated Vapor Transport (IVT) measures the amount and direction of water vapor being transported through the atmosphere. It is especially useful for tracking atmospheric rivers.
* Back-trajectory and moisture-source models can trace air parcels backward to estimate where their moisture originated and how long it remained in the atmosphere.
* Precipitable water measures the total amount of water vapor contained in an atmospheric column.
* Moisture recycling ratios estimate how much precipitation comes from local/regional evaporation versus moisture transported in from elsewhere.

Long-term reanalysis datasets allow researchers to examine changes in these patterns over decades.

So your hypothesis can actually be broken into several measurable questions:
Is atmospheric moisture traveling shorter distances before precipitating? Are precipitation events becoming more spatially concentrated? Is the duration or distance of moisture transport changing? Are moisture transport corridors becoming more intense?

There is an important distinction, though. A warmer atmosphere can hold substantially more water vapor—roughly **7% more per °C of warming**—which can increase the amount of moisture available to storms. At the same time, changes in circulation can alter where that moisture is transported and where it ultimately falls.

That could potentially contribute to the pattern you’re describing: **more intense precipitation over smaller areas in some regions, while other areas experience longer dry periods and declining snowpack.** But I wouldn’t assume that the moisture is necessarily traveling a shorter distance without testing it against the atmospheric-transport data.

What would be particularly interesting is to construct a **multi-decadal moisture-transport analysis** using reanalysis data. We could compare, say, 1950–1980, 1980–2000, and 2000–2025 for:

1. Average moisture-transport distance
2. Moisture residence time
3. Geographic source regions
4. IVT intensity
5. Size of precipitation footprints
6. Precipitation intensity within those footprints
7. Fraction of precipitation coming from local vs. remote moisture
8. Changes in snowpack and drought following changes in those patterns

That would let us test whether the hydrologic cycle is becoming **more spatially concentrated and more episodic**, rather than simply asking whether total precipitation is increasing or decreasing.

I think that is a very interesting question—and importantly, it is testable with existing atmospheric reanalysis and hydrologic datasets.

bookmark_borderConsumer Solar Panels

Michigan State University’s technology sounds amazing because it can turn almost any window into a power generator. However, there’s an inherent trade-off: allowing light to pass through the window means not absorbing the visible energy needed to generate electricity, which limits energy efficiency.

What may be even more promising are “balcony” solar panels. These systems can plug into existing outlets and feed electricity directly into a home, making solar generation possible without installing a traditional rooftop system. They’re becoming increasingly popular around the world.

Unfortunately, in the U.S., some utilities and regulatory policies are restricting or limiting their use.

Solar shingles have also been developed as an alternative to conventional rooftop solar panels. However, they have struggled to gain widespread market acceptance because integrating the solar technology into the roof can make it difficult to provide the same 20–30-year roofing warranty and long-term durability that traditional roofing systems can offer. The lack of a long-term guarantee can also make it more difficult to obtain the necessary homeowners insurance and mortgage approval, potentially creating complications when it comes time to sell the home.

This also applies to traditional rooftop solar panels. Solar panels do not replace the underlying roofing system, and replacing a roof after solar panels have been installed can be prohibitively expensive because the panels typically have to be removed and reinstalled.

In addition, some rooftop solar companies advertise “free installation,” but the homeowner may not actually own the system. Instead, the company retains ownership and places the homeowner under a long-term lease or power-purchase agreement. These agreements can complicate the sale of the property because the solar contract may need to be transferred to the buyer or paid off before the transaction can close.

bookmark_borderThree Irrefutable Lines of Evidence for Human-Caused Climate Change

by Daniel Brouse

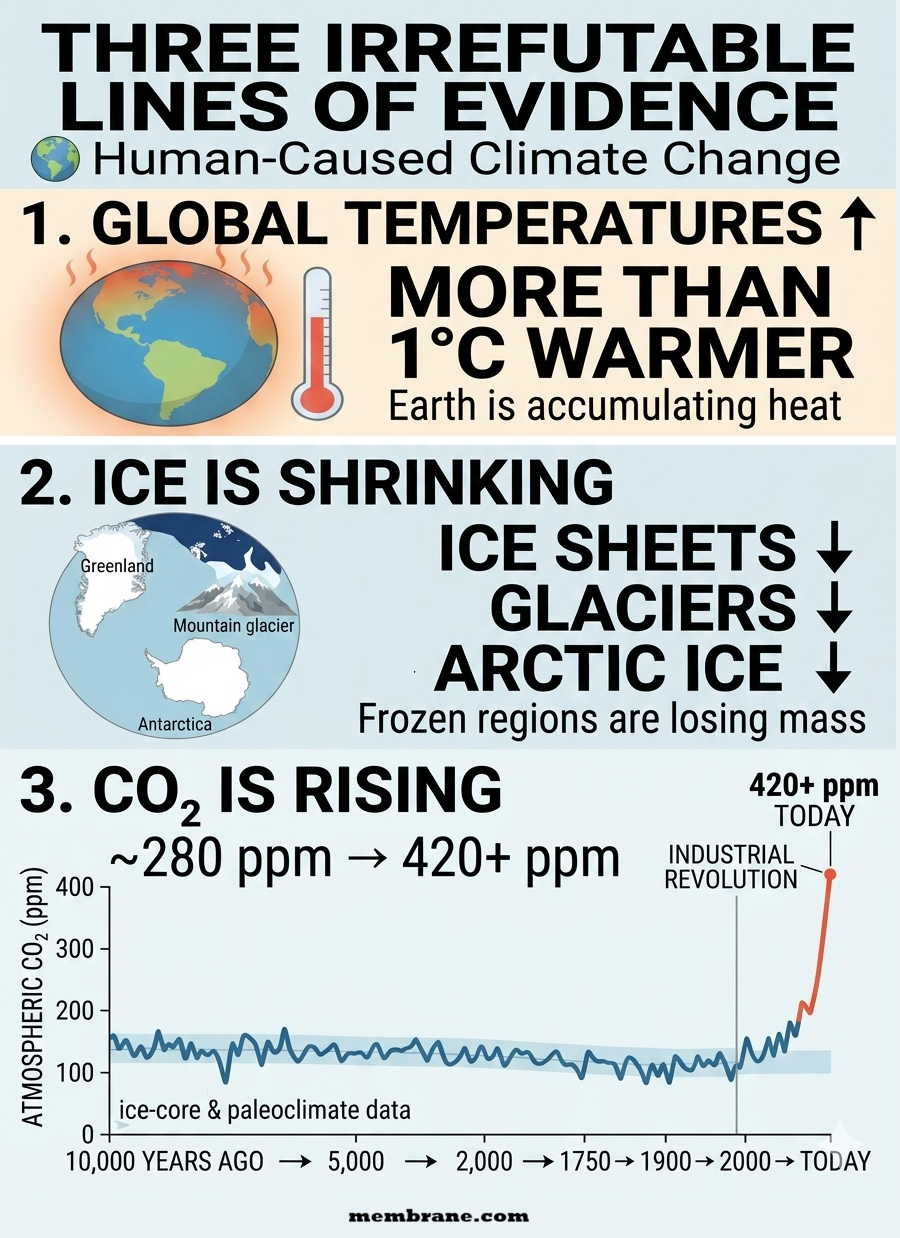
The evidence for human-caused climate change does not rest on a single temperature record, computer model, or scientific study. It comes from multiple independent lines of evidence that converge on the same conclusion.

Three of the clearest are rising global temperatures, shrinking ice sheets and glaciers, and rapidly increasing atmospheric carbon dioxide (CO₂) with a chemical fingerprint linked to fossil fuels.

Each observation is significant on its own. Together, they provide an exceptionally strong scientific case that human activities—especially the burning of coal, oil, and natural gas—are driving the modern warming of Earth’s climate.

1. Rising Global Temperatures

Earth’s average surface temperature has increased by more than 1°C since the late 19th century, with the great majority of that warming occurring since the mid-20th century.

The warming is occurring across the planet and is not limited to the atmosphere. The oceans are absorbing most of the excess heat accumulating in Earth’s climate system, resulting in rising ocean heat content and increasing sea-surface temperatures.

This broad pattern is exactly what scientists expect from an atmosphere increasingly enriched with heat-trapping greenhouse gases.

The evidence also extends beyond simple surface-temperature measurements. Changes in ocean heat, atmospheric temperatures, nighttime temperatures, seasonal patterns, and other components of the climate system independently demonstrate that Earth is undergoing sustained warming.

The planet is not merely experiencing a few unusually hot years. The entire climate system is accumulating heat.

2. Shrinking Ice Sheets, Glaciers, and Arctic Sea Ice

Earth’s frozen regions provide another powerful and highly visible record of climate change.

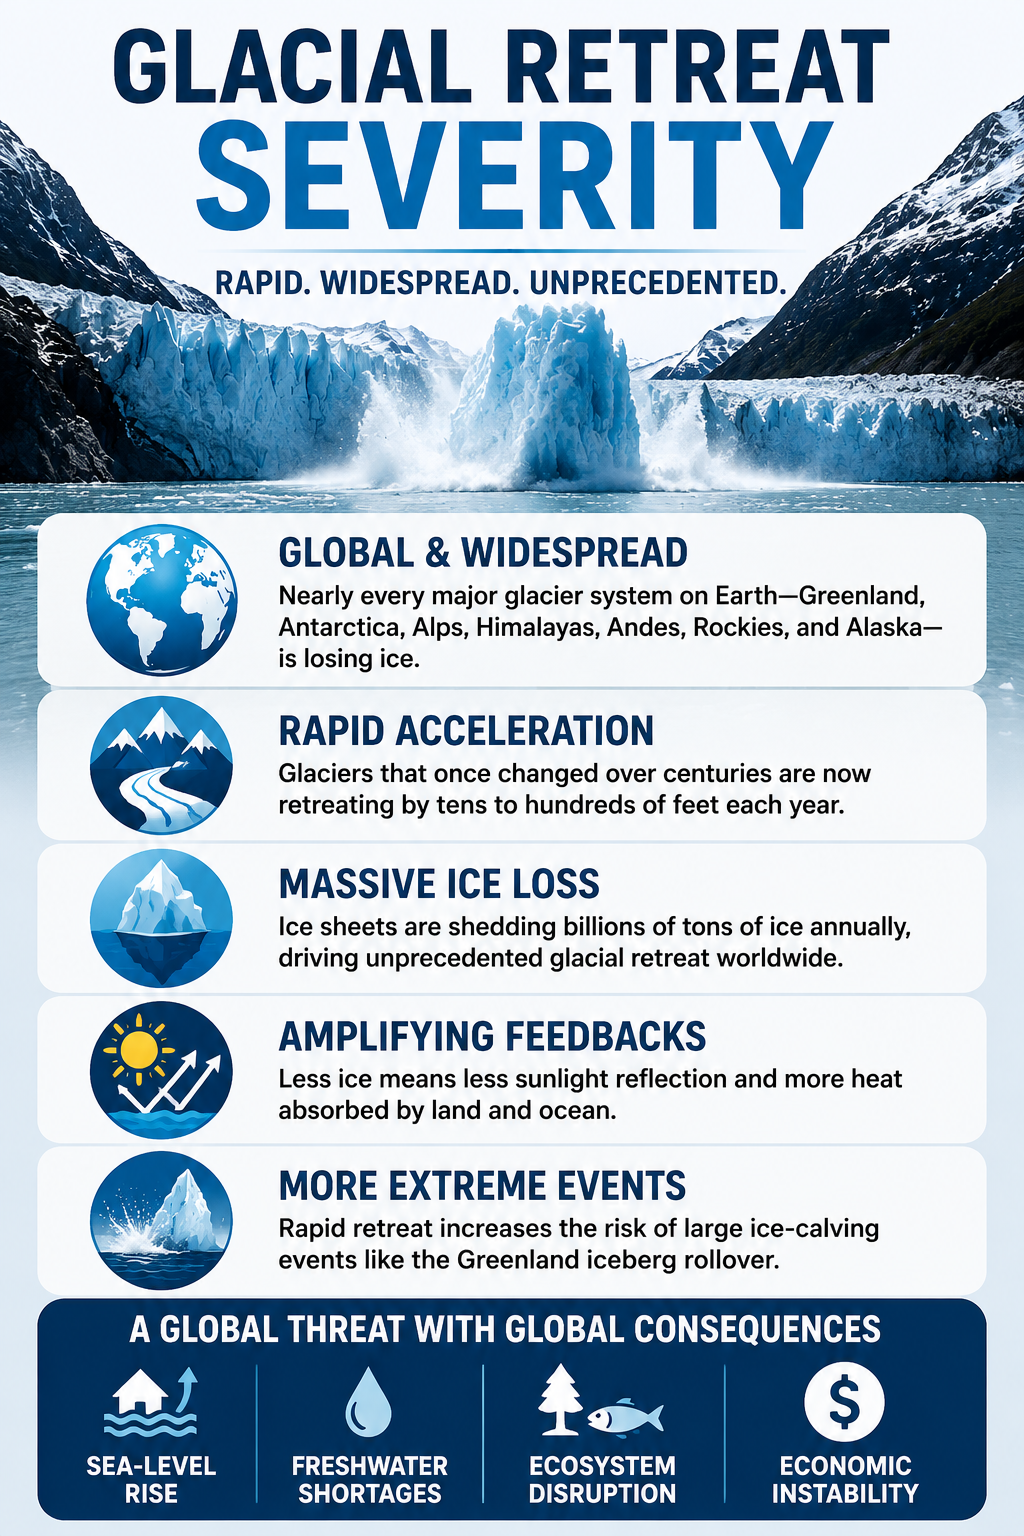
Greenland and Antarctica are losing ice mass. Glaciers are retreating in nearly every major mountain region, including the Alps, Himalayas, Rockies, Andes, and Alaska. Meanwhile, Arctic sea ice has declined substantially in both extent and thickness.

These changes matter because ice responds directly to changes in the climate system.

When temperatures rise persistently, glaciers retreat and ice sheets lose mass. As snow and ice disappear, darker land and ocean surfaces are exposed, allowing them to absorb more solar energy rather than reflecting it back into space. This creates an important ice-albedo feedback that can amplify warming.

The geographical reach of the changes is particularly important. Ice loss is not occurring at one isolated location. Multiple independent ice systems around the world are responding to a warming planet.

The retreat of glaciers, loss of polar ice, declining Arctic sea ice, and shrinking seasonal snow cover all point in the same direction.

3. Rising Atmospheric CO₂ and the Fossil-Fuel Fingerprint

Perhaps the most direct evidence of human influence comes from the atmosphere itself.

Before industrialization, atmospheric carbon dioxide concentrations were approximately 280 parts per million (ppm). Today, concentrations have risen to more than 420 ppm—an enormous increase occurring over a period far shorter than the natural changes that produced comparable atmospheric concentrations in the distant past.

But the evidence goes beyond simply measuring more CO₂.

Scientists can identify where the additional carbon is coming from.

The carbon added to the atmosphere has an isotopic signature consistent with carbon released from ancient organic material, including coal, oil, and natural gas. Atmospheric oxygen measurements and other observations provide additional evidence that fossil-fuel combustion is responsible for a substantial portion of the increase.

Human activities are therefore not merely occurring at the same time as rising CO₂. We can trace the additional carbon to its source.

And CO₂ has a well-established physical mechanism for affecting climate: it absorbs outgoing infrared radiation, reducing the amount of heat that escapes to space. Increasing its concentration strengthens the atmosphere’s greenhouse effect and produces warming.

Three Independent Signals—One Consistent Explanation

The strength of the evidence comes from the fact that these observations are connected but independently measurable:

Temperatures are rising.
Ice is shrinking.
CO₂ is increasing—and its chemical fingerprint identifies a major human source.

The observations also extend beyond these three indicators. Rising ocean heat, changing atmospheric circulation, shifting precipitation patterns, increasing ocean acidity, and numerous other changes are consistent with a planet responding to increased greenhouse-gas concentrations.

The critical point is that no single observation has to carry the entire argument.

If global temperatures were rising without increasing greenhouse gases, the explanation would be incomplete.

If atmospheric CO₂ were increasing without a corresponding physical mechanism for warming, the explanation would be incomplete.

If temperatures were rising while glaciers, ice sheets, and Arctic sea ice showed no response, the explanation would be incomplete.

Instead, the evidence converges.

The Climate Fingerprint

The modern climate system displays a coherent pattern:

Human activity increases greenhouse gases → greenhouse gases trap additional heat → Earth’s climate system accumulates energy → global temperatures rise → ice melts and glaciers retreat → oceans warm and expand → additional climate feedbacks amplify the changes.

This is not evidence based on one measurement or one institution. It is a conclusion supported by physics, atmospheric chemistry, temperature records, ocean measurements, satellite observations, glacier surveys, ice-sheet measurements, and paleoclimate evidence.

The overwhelming convergence of these independent observations makes the central conclusion extraordinarily robust:

Earth is warming, the warming is occurring across the climate system, atmospheric greenhouse gases are rising because of human activity, and the resulting enhanced greenhouse effect is driving the modern warming.

The evidence is not merely suggestive.

It is convergent, measurable, physically explainable, and unmistakably human-driven.

The Climate Crisis
Extreme Impacts:Extreme Weather Events | Violent Rain | Deadly Humid Heat | Sea Level Rise | Insurance
Ecosystems & Feedbacks:Ecosystem Collapse & Extinction Risks | Soil–Insect Climate Feedback Collapse | Insect Collapse | Soil | Trees & Deforestation
Human Health & Society:Climate Change Business & Economics | DIY Climate Control | Climate & Human Health | Climate Tax | Limits of Human Adaptability | Climate-Driven Health Collapse | Food & Water Security | Civilization Collapse


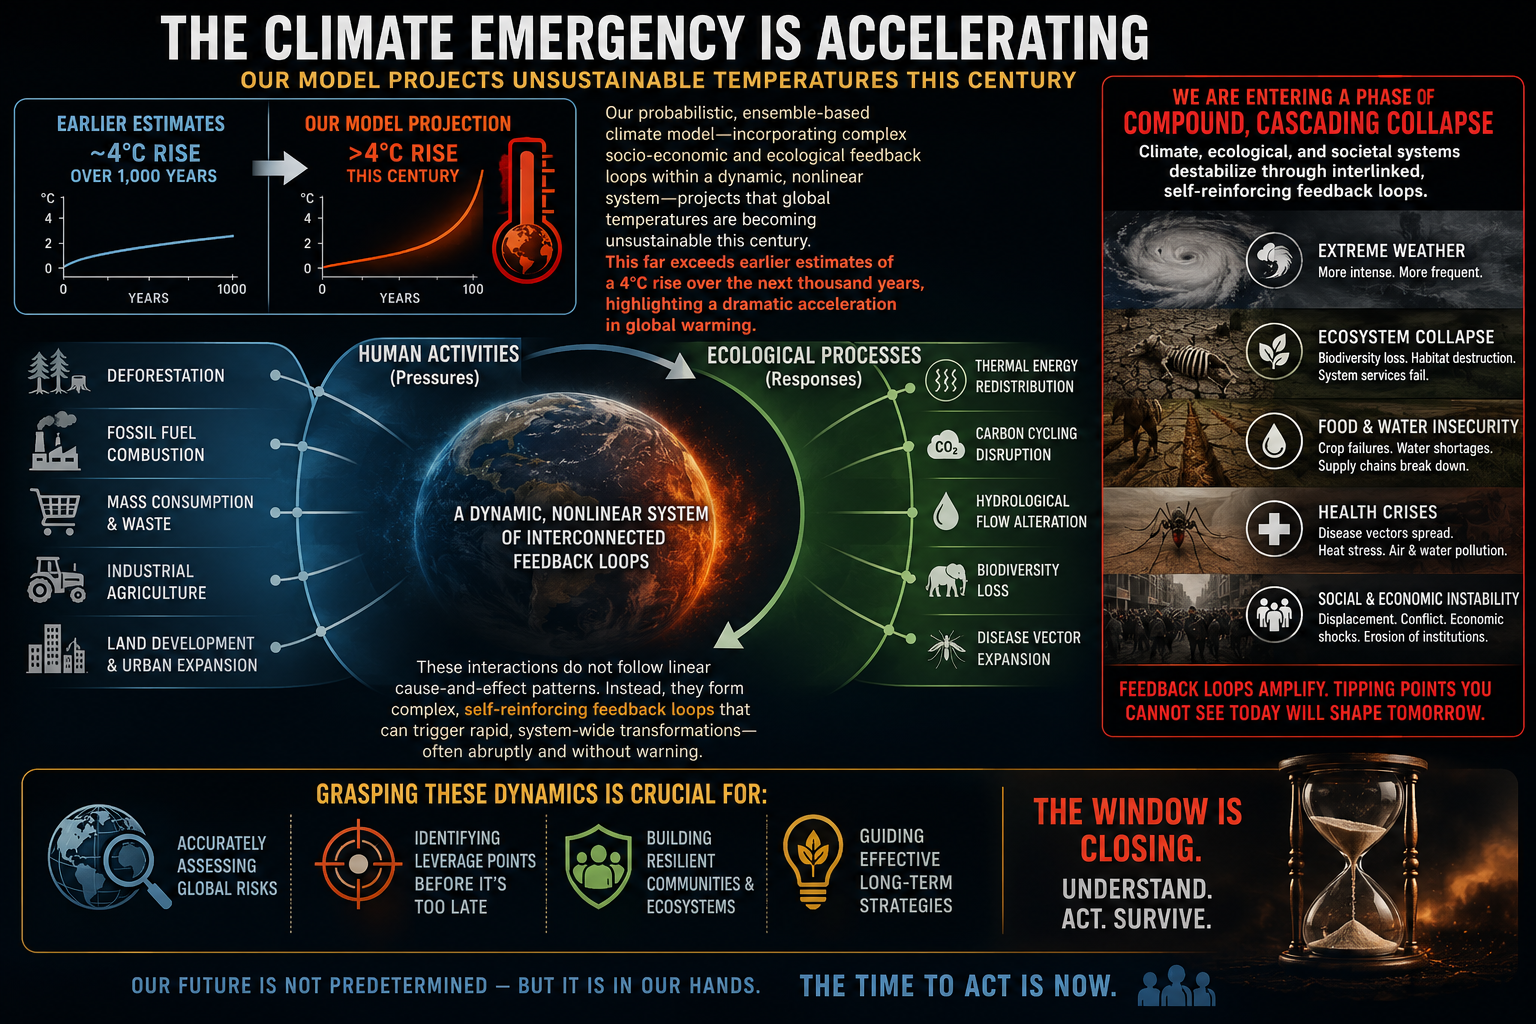
* Our probabilistic, ensemble-based climate model — which incorporates complex socio-economic and ecological feedback loops within a dynamic, nonlinear system — projects that global temperatures are becoming unsustainable this century. This far exceeds earlier estimates of a 4°C rise over the next thousand years, highlighting a dramatic acceleration in global warming. We are now entering a phase of compound, cascading collapse, where climate, ecological, and societal systems destabilize through interlinked, self-reinforcing feedback loops.

We examine how human activities — such as deforestation, fossil fuel combustion, mass consumption, industrial agriculture, and land development — interact with ecological processes like thermal energy redistribution, carbon cycling, hydrological flow, biodiversity loss, and the spread of disease vectors. These interactions do not follow linear cause-and-effect patterns. Instead, they form complex, self-reinforcing feedback loops that can trigger rapid, system-wide transformations — often abruptly and without warning. Grasping these dynamics is crucial for accurately assessing global risks and developing effective strategies for long-term survival.

Feedback Loops → Acceleration → Tipping Points → Acceleration → Domino Effect

Feedback loops amplify climate change and can push interconnected Earth systems past critical tipping points. As tipping points are crossed, they can trigger additional feedback loops and destabilize other climate systems. This cascading “Domino Effect” compresses timescales, accelerates change, and increases the risk of rapid, nonlinear climate transformations.

Bottom line:The question is no longer how warm the planet becomes, but how life on Earth can endure when change outpaces our ability to adapt.
We cannot control the laws of physics, but we can control our pollution. The most effective action is to stop burning fossil fuels.

For the basics: Climate Change Simplified

The Human Induced Climate Change Experiment

bookmark_borderGlacial Retreat and Climate Change Push the Rhine River to Historic Lows

by Daniel Brouse

The Rhine River has fallen to historic low levels at several critical measuring stations, disrupting one of Europe’s most important transportation corridors. At Lobith, near the Dutch border, the river dropped to 6.47 meters above NAP, surpassing the previous record set during the severe 2022 drought. River discharge has also plunged to approximately 692 cubic meters per second as prolonged drought and depleted Alpine snowpacks sharply reduce water flowing downstream.

Shipping and Economic Impacts

The Rhine carries hundreds of millions of tons of cargo each year, making low-water events a major economic concern.

  • Cargo restrictions: Freight vessels are operating at only 20% of normal capacity in some locations to avoid grounding on the riverbed.
  • Critical bottlenecks: Water levels at the key shipping gauge at Kaub, near Koblenz, have fallen to around 25 centimeters, matching the record lows experienced in 2018.
  • Rising costs: Reduced shipping capacity has significantly increased transportation costs, disrupted supply chains, and threatens economic growth across Central Europe.

Outlook

Forecasts indicate that river levels could continue falling if hot, dry conditions persist through the coming weeks.

Although authorities report no immediate threat to municipal drinking water supplies, voluntary water conservation measures are being encouraged as drought conditions intensify.

Why Climate Change Is Making Low Rhine Levels More Common

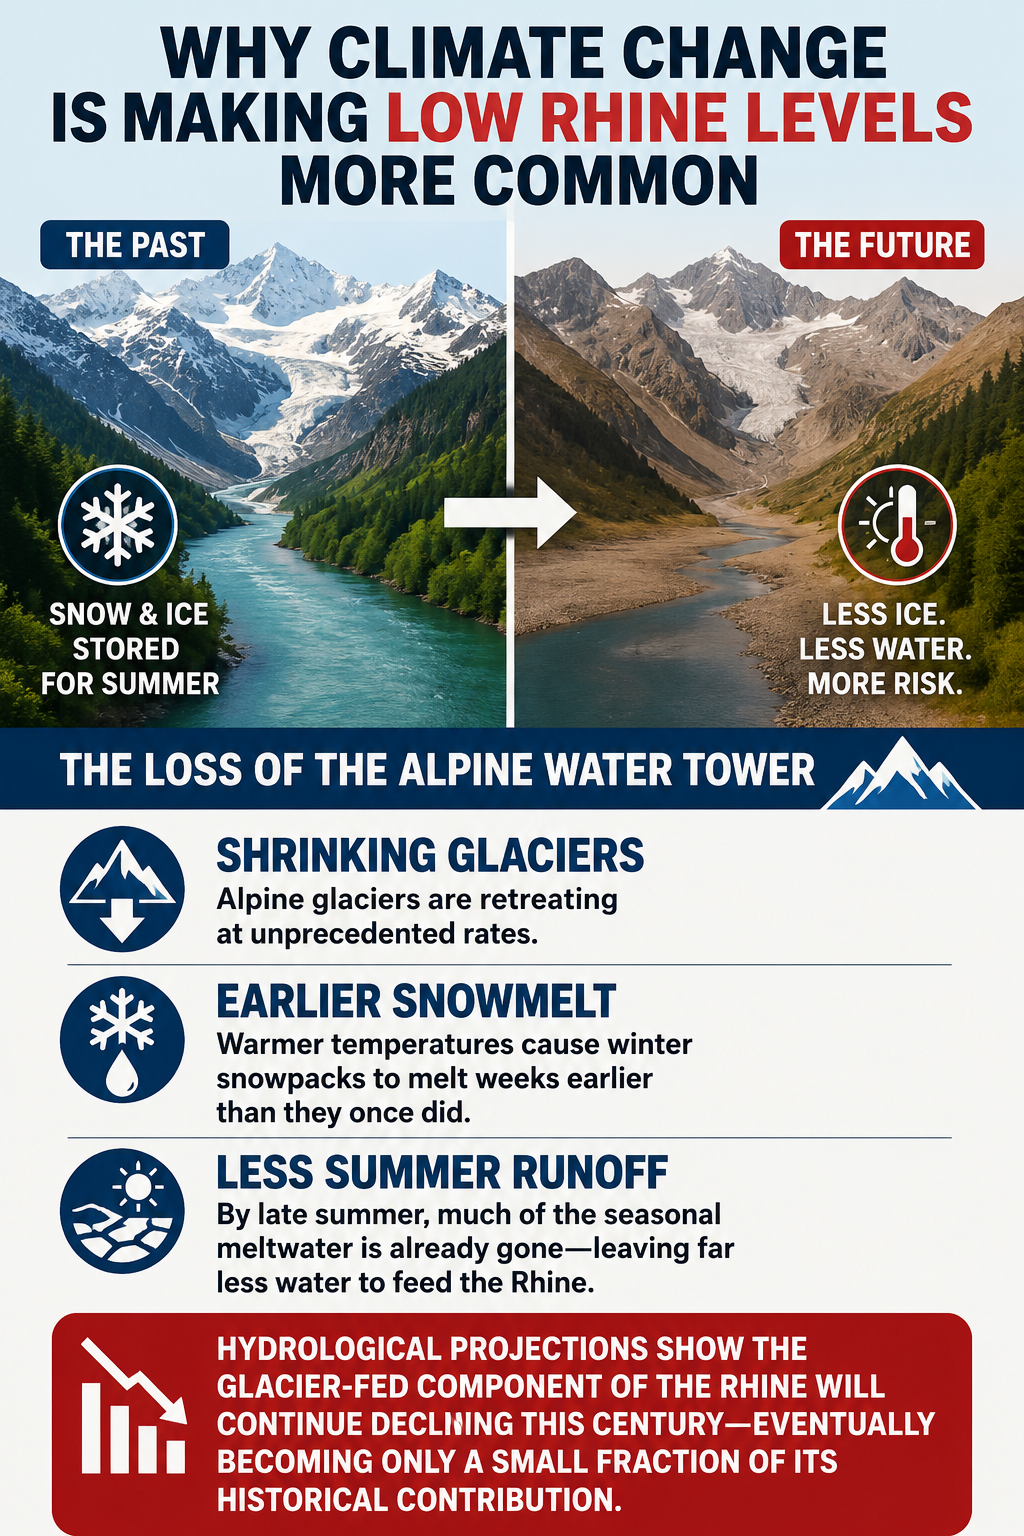
While the Rhine has experienced low-water periods throughout history, climate change is fundamentally altering the river’s hydrology. Research from European hydrological agencies shows that rising temperatures and accelerating glacial retreat are removing the natural systems that historically sustained river flows during dry summers.

The Loss of the Alpine Water Tower

The Alps have long acted as Europe’s natural water reservoir, storing winter snowfall and glacier ice that gradually melted throughout the summer.

That natural buffer is rapidly disappearing.

  • Shrinking glaciers: Alpine glaciers are retreating at unprecedented rates.
  • Earlier snowmelt: Warmer temperatures cause winter snowpacks to melt weeks earlier than they once did.
  • Less summer runoff: By late summer, much of the seasonal meltwater has already been exhausted, leaving far less water to feed the Rhine during periods of peak demand.

Hydrological projections indicate that the glacier-fed component of the Rhine will continue declining throughout this century, eventually becoming only a small fraction of its historical contribution.

A River Increasingly Dependent on Rainfall

As glacier and snowmelt decline, the Rhine is transitioning from a stable, meltwater-supported river into one increasingly dependent on rainfall.

This shift produces much greater variability:

  • Wetter winters with more intense precipitation.
  • Longer, hotter summer droughts.
  • More frequent and severe low-water events.
  • Increasing disruptions to commercial navigation and regional economies.

Without the stabilizing influence of Alpine snow and glacier melt, prolonged summer droughts now cause the Rhine to reach critical shipping thresholds far more quickly than in the past.

The Rhine’s record-low water levels are more than a short-term drought story—they illustrate how accelerating climate change is transforming Europe’s water resources. As glaciers continue to retreat and heatwaves become more frequent, extreme low-water events are expected to become increasingly common, posing growing risks to transportation, industry, agriculture, and water management across the continent.

bookmark_borderGreenland’s Melting Ice Is Slowing Earth’s Ocean Conveyor Belt (AMOC)

by Daniel Brouse

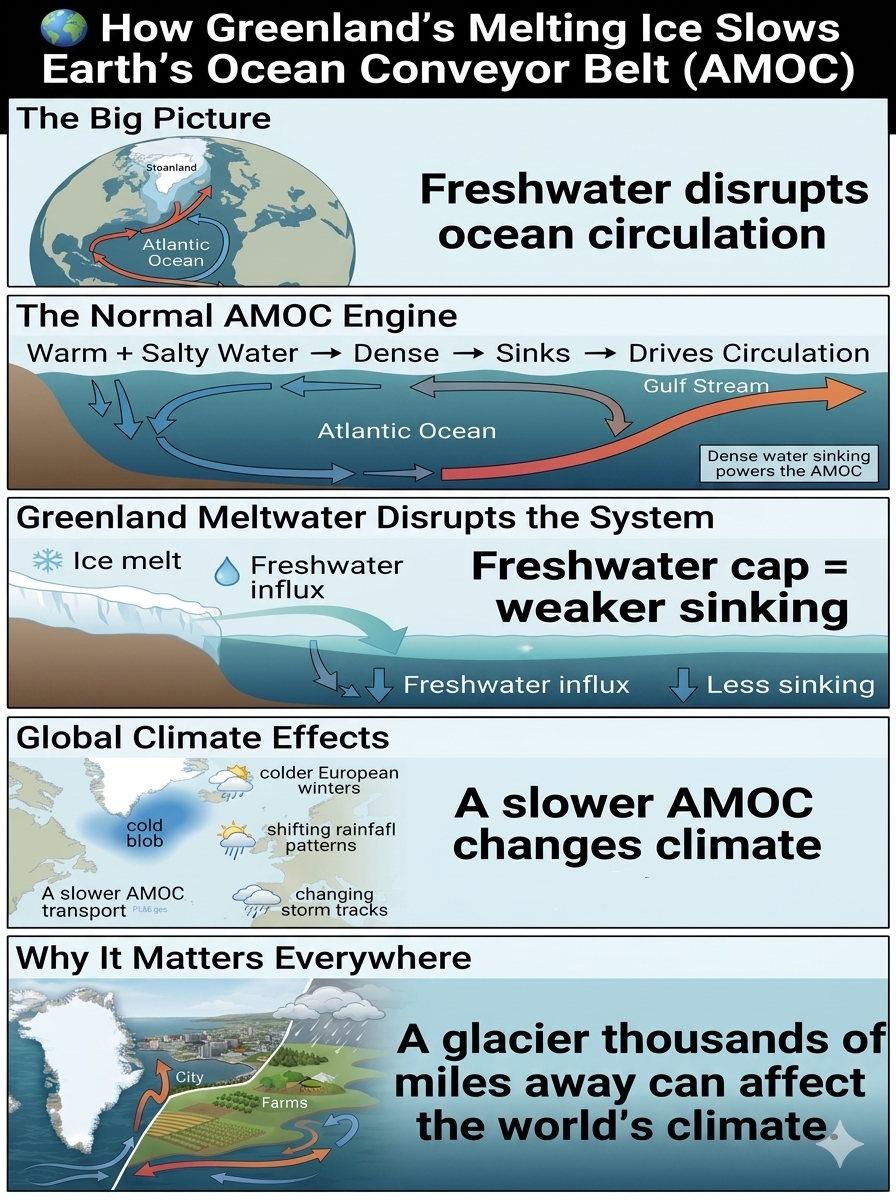
Glacial retreat is weakening the Atlantic Meridional Overturning Circulation (AMOC) by injecting enormous amounts of freshwater into the North Atlantic. This disrupts the natural “ocean conveyor belt” that redistributes heat around the planet and plays a critical role in regulating global climate patterns.

The Mechanics of the Slowdown

The AMOC depends on a delicate balance between temperature and salinity to maintain its circulation. Greenland’s accelerating ice loss is disturbing this balance through a chain reaction:

The Normal Engine: Sinking Water

Under normal conditions, warm, salty tropical water flows northward through the Gulf Stream into the North Atlantic. As this water reaches the subpolar regions near Greenland, it cools. Because cold, salty water is extremely dense, it sinks rapidly into the deep ocean.

This sinking motion acts like the engine of the AMOC, pulling more warm surface water northward while sending colder deep water back toward the tropics. This continuous cycle helps transport heat around the globe.

The Freshwater Cap

The accelerating retreat of the Greenland Ice Sheet is adding vast quantities of freshwater directly into these critical deep-water formation zones.

Unlike salty ocean water, freshwater is less dense. As meltwater accumulates at the surface, it creates a buoyant freshwater layer — sometimes described as a “cap” — that makes it more difficult for surface waters to sink.

Loss of Density: A Slower Conveyor

When surface waters cannot sink efficiently, the downward circulation weakens. The reduced sinking disrupts the entire AMOC system, slowing the transport of heat and altering ocean circulation patterns across the Atlantic basin.


Compounding Regional Feedbacks

The Atlantic “Cold Blob”

One of the most visible signs of AMOC weakening is a persistent region of unusually cold water south of Greenland and near the North Atlantic subpolar gyre, often called the Atlantic Cold Blob.

As the AMOC slows, less tropical heat is transported northward, creating a localized cooling pattern within an otherwise warming planet. This cold region acts as a fingerprint of changing ocean circulation.

Glacial Changes Beyond Greenland

The AMOC is not isolated from the rest of the planet. Research suggests that melting glaciers and ice sheets in other regions can influence global ocean salinity patterns.

Freshwater entering the Pacific Ocean from retreating glaciers and melting icebergs can alter large-scale ocean circulation pathways, potentially affecting the Atlantic system thousands of miles away.


Current Impact and Future Outlook

Observations indicate that the AMOC has weakened compared with conditions in the mid-20th century, although the exact magnitude of the slowdown remains an active area of scientific research because direct measurements of the full system only began recently.

Earlier climate discussions often focused on the possibility of a sudden, abrupt AMOC collapse. More recent high-resolution climate simulations generally suggest that Greenland meltwater is more likely to contribute to a progressive weakening rather than an immediate shutdown.

However, a substantial long-term slowdown would still have major consequences:

  • 🌊 Changes in Atlantic heat transport
  • ❄️ More extreme winter patterns in parts of Europe
  • 🌧️ Shifts in tropical rainfall and monsoon systems
  • 🌪️ Altered storm tracks and regional weather extremes
  • 🌍 Greater disruption of Earth’s climate balance

The AMOC is a reminder that Earth’s climate system is not a collection of isolated parts. A glacier melting thousands of miles away can influence ocean currents, weather patterns, and societies around the world.

The fate of Greenland’s ice is not just an Arctic issue — it is a global climate signal.

Greenland’s Melting Glaciers: Why Their Retreat Affects Everyone

Greenland’s Giant Iceberg Flip: A Dramatic Sign of a Rapidly Changing Arctic

bookmark_borderGreenland’s Melting Glaciers: Why Their Retreat Affects Everyone

by Daniel Brouse

The overwhelming interest in Greenland’s dramatic iceberg rollover has raised an important question: Why should people who live thousands of miles from a glacier care?

Glacial retreat reshapes nearby landscapes almost immediately, but its most significant impacts extend far beyond the Arctic. As glaciers disappear, the effects ripple through water supplies, food production, energy systems, coastlines, and the global economy.

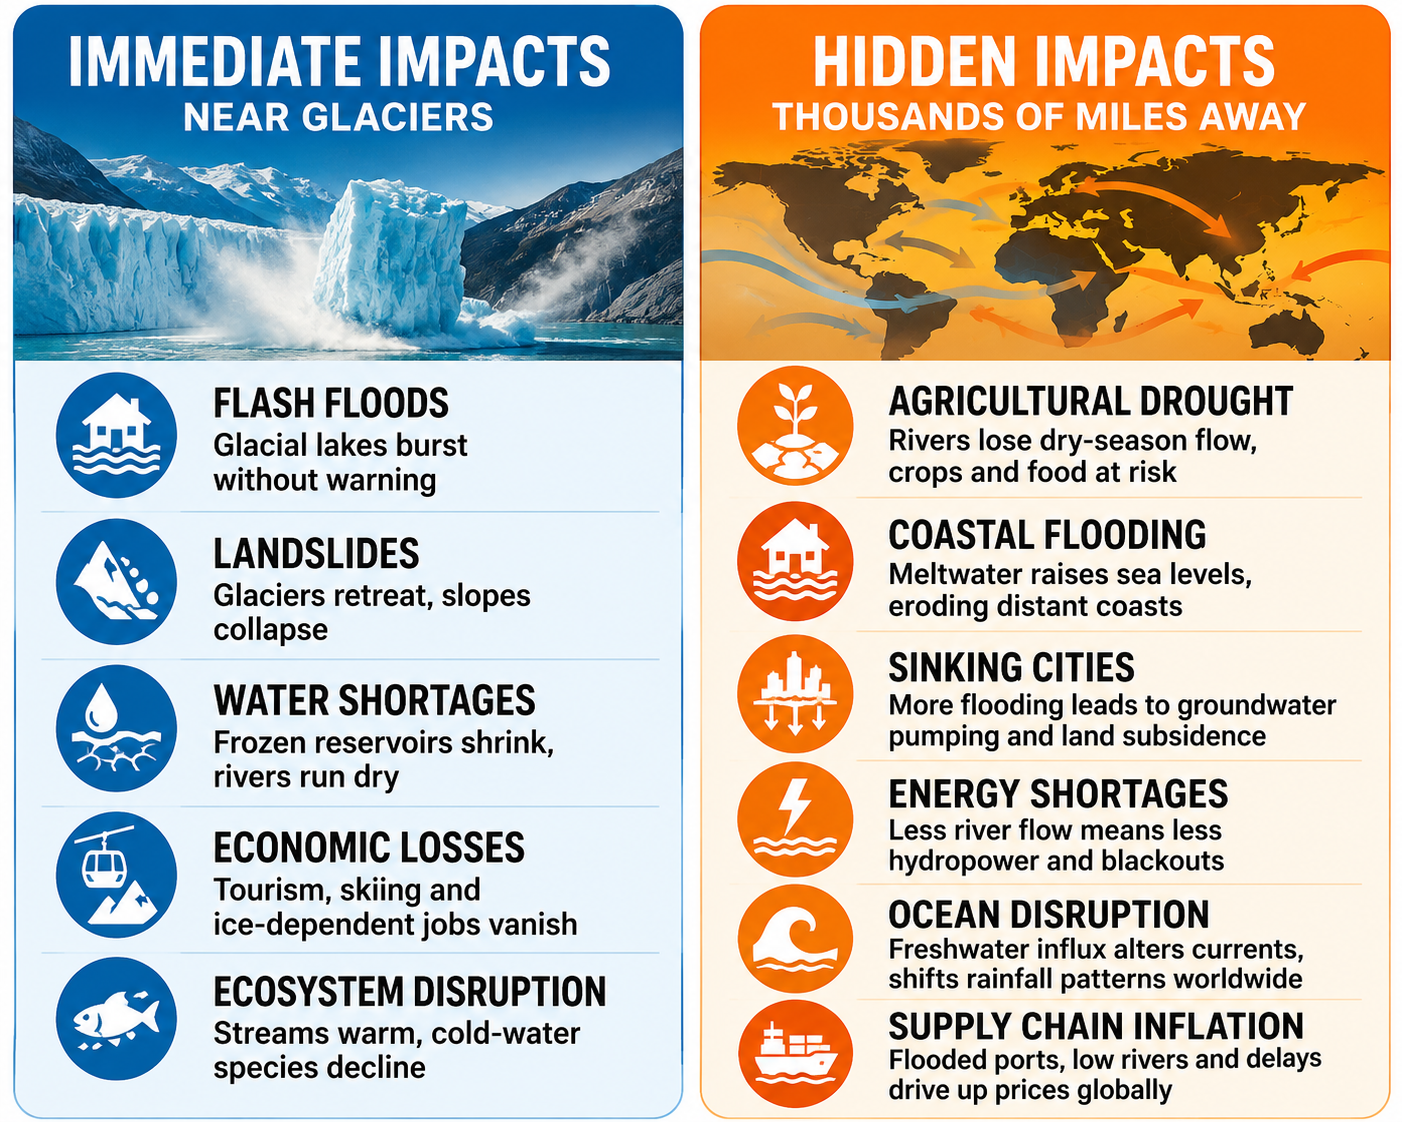
Immediate Impacts Near Glaciers

  • Flash floods: Melting ice forms unstable glacial lakes that can burst without warning, devastating downstream communities.
  • Landslides: As glaciers retreat, they remove the support that stabilizes steep mountain slopes, increasing the risk of massive rockfalls.
  • Water shortages: Many communities lose the frozen reservoirs that supply rivers during the dry summer months.
  • Economic losses: Glacier tourism, skiing, and other ice-dependent industries decline as glaciers disappear.
  • Ecosystem disruption: Cold-water species, including trout and salmon, struggle as streams warm and habitats shrink.

Hidden Impacts Thousands of Miles Away

  • Agricultural drought: Rivers fed by glaciers lose their dry-season flow, reducing irrigation water for farms far downstream.
  • Coastal flooding: Meltwater from Greenland and other glaciers raises global sea levels, increasing flooding and shoreline erosion worldwide.
  • Sinking cities: More frequent coastal flooding often leads to increased groundwater pumping, accelerating land subsidence in vulnerable urban areas.
  • Energy shortages: Hydroelectric systems that depend on glacier-fed rivers face declining water supplies and reduced power generation.
  • Disrupted ocean circulation: Large freshwater inputs can alter ocean currents, shifting weather patterns and rainfall across continents.
  • Higher prices: Lower river levels, flooded ports, and damaged transportation infrastructure disrupt global supply chains, increasing the cost of food, energy, and consumer goods.

Glacial retreat is far more than the loss of scenic ice. It is a global chain reaction that affects freshwater, agriculture, infrastructure, ecosystems, economies, and the stability of the climate system. What begins with melting ice in Greenland ultimately influences the lives of billions of people around the world.

Glacial Retreat Severity

Glacial retreat is accelerating at an unprecedented rate as rising global temperatures drive record levels of melting. Nearly every major glacier system on Earth—from Greenland and Antarctica to the Alps, Himalayas, Andes, Rockies, and Alaska—has experienced sustained ice loss over recent decades. In many regions, glaciers that once changed slowly over centuries are now retreating by tens to hundreds of feet each year, while ice sheets are shedding billions of tons of ice annually. This rapid loss reduces Earth’s ability to reflect sunlight, exposes darker land and ocean surfaces that absorb more heat, and increases the likelihood of large ice-calving events like the recent Greenland iceberg rollover. As these feedback loops intensify, glacial retreat is no longer just a regional environmental issue—it has become a global driver of sea-level rise, freshwater shortages, ecosystem disruption, and economic instability.