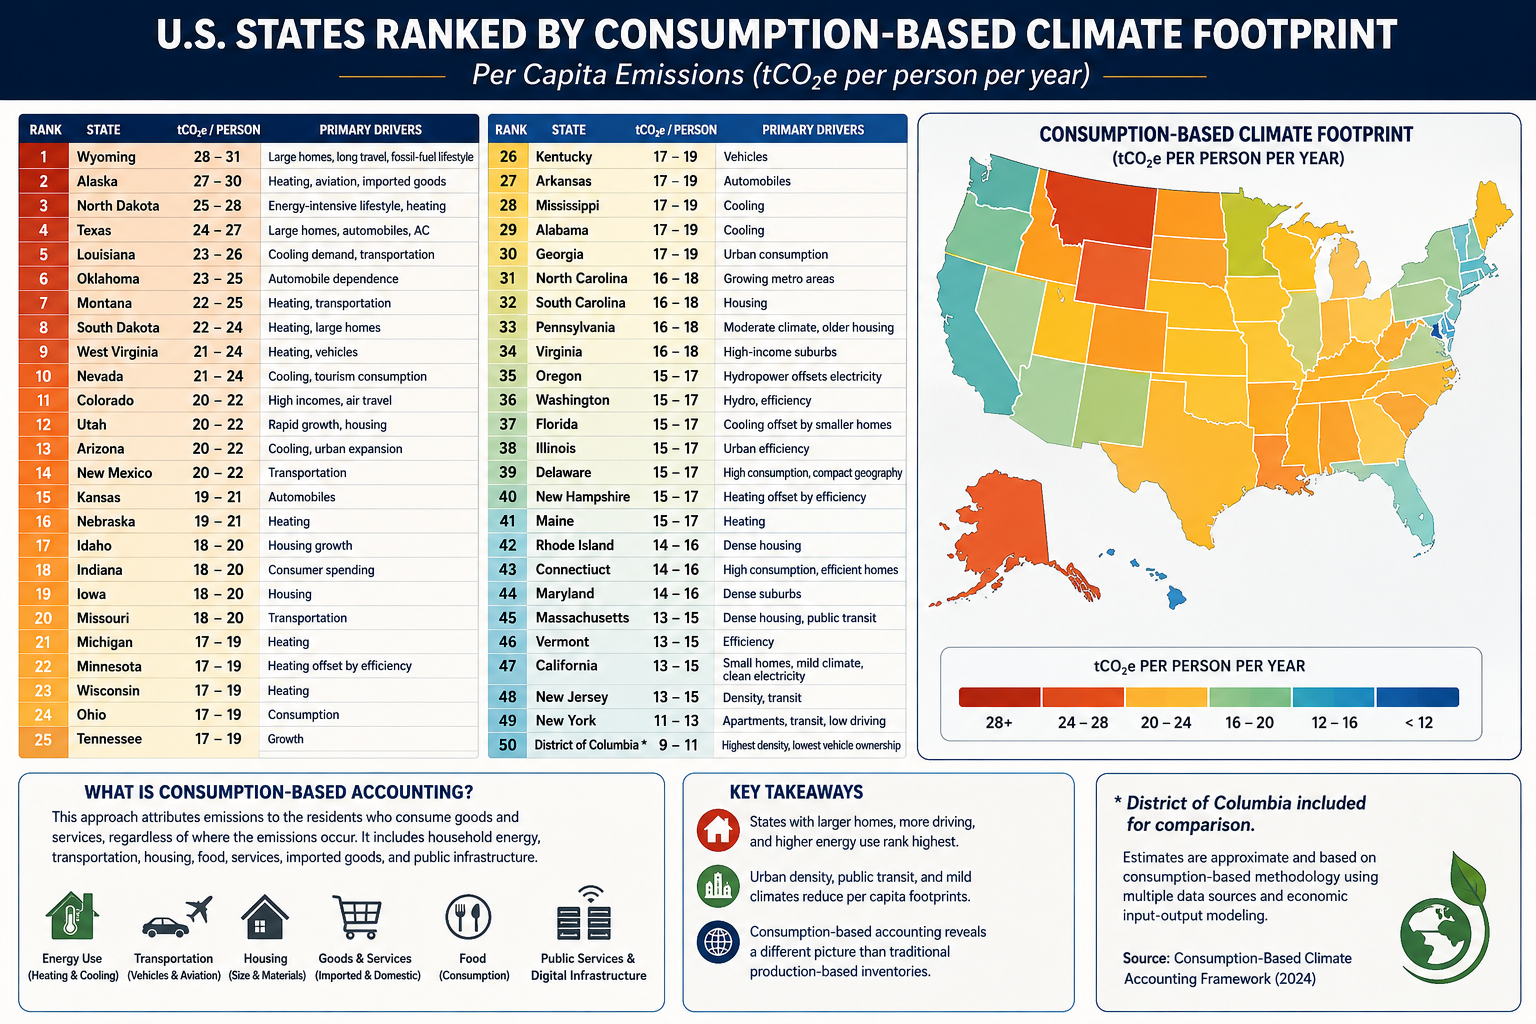
Estimated Consumption-Based Climate Footprint
(tCO₂e per person per year)
| Rank | State | Estimated Footprint | Primary Drivers |
|---|---|---|---|
| 1 | Wyoming | 28–31 | Large homes, long travel distances, fossil-fuel lifestyle |
| 2 | Alaska | 27–30 | Heating, aviation, imported goods |
| 3 | North Dakota | 25–28 | Energy-intensive lifestyle, heating |
| 4 | Texas | 24–27 | Large homes, automobiles, air conditioning |
| 5 | Louisiana | 23–26 | Cooling demand, transportation |
| 6 | Oklahoma | 23–25 | Automobile dependence |
| 7 | Montana | 22–25 | Heating, transportation |
| 8 | South Dakota | 22–24 | Heating, large homes |
| 9 | West Virginia | 21–24 | Heating, vehicles |
| 10 | Nevada | 21–24 | Cooling, tourism consumption |
| 11 | Colorado | 20–22 | High incomes, air travel |
| 12 | Utah | 20–22 | Rapid growth, housing |
| 13 | Arizona | 20–22 | Cooling, urban expansion |
| 14 | New Mexico | 20–22 | Transportation |
| 15 | Kansas | 19–21 | Automobiles |
| 16 | Nebraska | 19–21 | Heating |
| 17 | Idaho | 18–20 | Housing growth |
| 18 | Indiana | 18–20 | Consumer spending |
| 19 | Iowa | 18–20 | Housing |
| 20 | Missouri | 18–20 | Transportation |
| 21 | Michigan | 17–19 | Heating |
| 22 | Minnesota | 17–19 | Heating offset by efficiency |
| 23 | Wisconsin | 17–19 | Heating |
| 24 | Ohio | 17–19 | Consumption |
| 25 | Tennessee | 17–19 | Growth |
| 26 | Kentucky | 17–19 | Vehicles |
| 27 | Arkansas | 17–19 | Automobiles |
| 28 | Mississippi | 17–19 | Cooling |
| 29 | Alabama | 17–19 | Cooling |
| 30 | Georgia | 17–19 | Urban consumption |
| 31 | North Carolina | 16–18 | Growing metro areas |
| 32 | South Carolina | 16–18 | Housing |
| 33 | Pennsylvania | 16–18 | Moderate climate, older housing |
| 34 | Virginia | 16–18 | High-income suburbs |
| 35 | Oregon | 15–17 | Hydropower offsets electricity |
| 36 | Washington | 15–17 | Hydro, efficiency |
| 37 | Florida | 15–17 | Cooling offset by small homes |
| 38 | Illinois | 15–17 | Urban efficiency |
| 39 | Delaware | 15–17 | High consumption, compact geography |
| 40 | New Hampshire | 15–17 | Heating offset by efficiency |
| 41 | Maine | 15–17 | Heating |
| 42 | Rhode Island | 14–16 | Dense housing |
| 43 | Connecticut | 14–16 | High consumption, efficient homes |
| 44 | Maryland | 14–16 | Dense suburbs |
| 45 | Massachusetts | 13–15 | Dense housing, public transit |
| 46 | Vermont | 13–15 | Efficiency |
| 47 | California | 13–15 | Small homes, mild climate, clean electricity |
| 48 | New Jersey | 13–15 | Density, transit |
| 49 | New York | 11–13 | Apartments, transit, low driving |
| 50 | District of Columbia* | 9–11 | Highest density, lowest vehicle ownership |
(*Included for comparison.)
Accounting Method
Using the methodology from your consumption-based accounting paper, the rankings would look quite different from conventional state CO₂ inventories. Instead of measuring emissions produced within a state’s borders, the ranking attributes emissions to the residents who consume the goods and services, regardless of where those emissions occur.
The principal variables would include:
- Household energy consumption
- Heating and cooling demand
- Transportation (vehicle ownership, VMT, aviation)
- Housing size
- Household income and purchasing power
- Consumption of imported manufactured goods
- Food consumption
- Public and private services
- Data center and digital infrastructure usage
- Construction materials and embodied carbon
Because imported goods are attributed to consumers, states with high incomes and high levels of consumption generally rise in the rankings, while manufacturing states fall relative to production-based inventories.
What stands out?
Highest per-capita footprints
These states combine several characteristics:
- Large single-family homes
- Long commuting distances
- High vehicle ownership
- Significant heating or cooling demand
- Frequent air travel
- Higher embodied consumption in housing and infrastructure
Texas, Alaska, Wyoming, and North Dakota score highly not simply because of fossil-fuel production, but because residents tend to consume more energy per person.
Lowest per-capita footprints
The Northeast and California benefit from:
- Smaller living spaces
- Greater urban density
- More public transportation
- Lower vehicle miles traveled
- Cleaner electricity
- Higher building efficiency
New York illustrates the effect well. Although it has one of the largest economies in the world, the average resident lives in a much smaller dwelling, drives less, and relies more on mass transit than residents of most other states, resulting in one of the lowest per-capita consumption footprints.
Comparison with traditional accounting
Under conventional EPA production-based accounting:
- Texas is by far the largest emitter because of industry and energy production.
- California appears relatively high due to its large economy.
- Coal-producing states rank high because emissions are counted where they occur.
Under consumption-based accounting, the question changes to:
“How much climate impact does the average resident’s lifestyle require?”
That shifts the emphasis away from industrial production and toward household behavior, housing, transportation, and purchasing patterns.
For an even more rigorous version suitable for publication, you could develop a state-level Multi-Regional Input-Output (MRIO) model analogous to your international consumption framework. Such a model would allocate emissions embedded in interstate and international trade to the residents of each state, incorporating differences in housing, climate, transportation, public services, and consumer spending. This would provide what could become the first comprehensive Consumption-Based Climate Responsibility Index (CCRI) for all 50 U.S. states.