By Daniel Brouse
April 16, 2025
Exceeding a standard deviation means that a data point is significantly different from the average — a statistical red flag.
In finance or economics:
-
A move of 1 standard deviation is unusual but not rare.
-
2 or more indicates extreme behavior — often signaling stress, instability, or systemic change.
When U.S. Treasury bonds — historically the world’s most stable asset — move multiple standard deviations, it’s not just noise. It suggests deep structural shifts in fiscal policy, market confidence, or macroeconomic expectations.
U.S. Treasury bonds — especially long-duration ones like the 10-year and 30-year Treasuries — have recently deviated by multiple standard deviations from historical norms in several key dimensions:
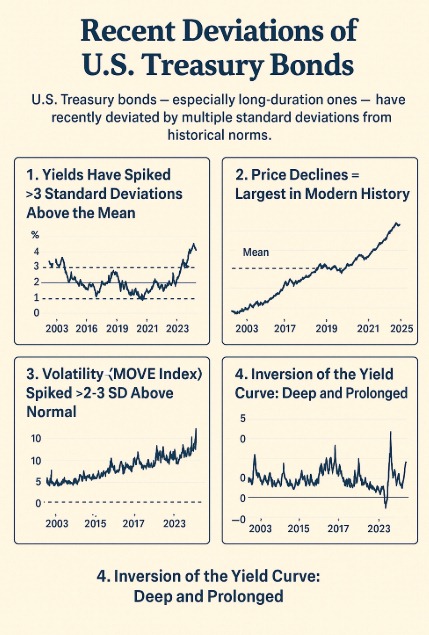
Historic Deviations in U.S. Treasury Bonds
1. Yields Have Spiked >3 Standard Deviations Above the Mean
-
As of late 2023 and early 2024, 10-year Treasury yields rose to around 4.5%–5%, levels 3+ standard deviations above the post-2008 average (~2%).
-
30-year yields followed a similar pattern.
-
This is a massive deviation in historical bond market terms, which are usually stable and mean-reverting.
This is a “once-in-a-generation” spike — the bond market equivalent of a hundred-year flood.
2. Price Declines = Largest in Modern History
-
Bond prices move inversely to yields.
-
The Bloomberg U.S. Treasury Index logged a historic drawdown (over –15%) in 2022–2023 — the worst since the 1780s in real terms.
-
That decline represents a >4 standard deviation move in price terms — practically unheard of in government bond history.
3. Volatility (MOVE Index) Spiked >2–3 SD Above Normal
-
The MOVE Index (bond market’s version of the VIX) soared past 160 in 2023.
-
Its long-term average is around 80–100.
-
A reading above 150 is a 3-sigma event — indicating extreme stress and uncertainty.
4. Inversion of the Yield Curve: Deep and Prolonged
-
The 2-year vs. 10-year yield inversion (short-term yields higher than long-term) has persisted at extreme levels — >1 standard deviation deeper and longer than historical precedent.
-
This inversion is a classic recession signal, but now it’s part of a structurally altered interest rate environment.
Summary: What’s Askew in U.S. Treasury Bonds
| Metric | Deviation from Norm | Std. Dev. Estimate |
|---|---|---|
| 10-yr Yield | Sharp rise | +3 to +4 SD |
| Treasury Price Index | Historic loss | –4+ SD |
| MOVE Volatility Index | Sustained high volatility | +2 to +3 SD |
| Yield Curve Inversion Depth | Longest & deepest in decades | >1 SD |
Why It Matters
-
Bonds are usually the “safe haven” — but now they’re chaotic, cracked, and misaligned.
-
This upends traditional risk models used by banks, pensions, and governments.
-
It’s also a signal of fiscal fragility — markets demanding higher compensation for lending to the U.S.
The Big Question: What If the Dollar Loses Its Reserve Status?
Ultimately, the darkest scenario is no longer unthinkable: What happens if the U.S. dollar loses its status as the world’s reserve currency?
This would unleash a profound economic reset, marked by:
-
Exploding U.S. borrowing costs
-
A collapse in consumer purchasing power
-
Global capital flight from U.S. assets
-
Severe contraction in both trade and credit
-
Domestic political and economic instability unlike anything in modern history
Conclusion: We Are In the Experiment Now
Capital Preservation During Trumpenomics
- Economic Survival 101: Liquidity & Long-Term Strategy
- Dump Trump: Buy and Hold Doesn’t Hold
- Mandated Buyers vs Emotional Sellers: The Battle Behind Every Crash
(Why doesn’t the stock market just crash in a straight line?) - The Great Depression vs. The Climate Crisis: Why the Stock Market May Never Recover
- Gold: A Growing Influence in Today’s Market
- Tariffs and the Liquidity Crisis in Long U.S. Treasuries
The Inevitable Collapse: How Trump’s Policies and Climate Neglect Will Reshape the Economy