Beyond Point Estimates:
An Ensemble-Based Probabilistic Framework for Estimating the Full Economic Burden of Climate Change in the United States
Daniel Brouse and Sidd Mukherjee
Abstract
Traditional estimates of climate damages generally report single-value estimates or narrow ranges that fail to capture the cascading uncertainty inherent in coupled human-natural systems. Climate change is not a single hazard but a network of interacting physical, ecological, epidemiological, economic, and social feedbacks.
This paper proposes an ensemble-based probabilistic accounting framework that estimates the true annual economic burden of climate change in the United States as a distribution rather than a point estimate.
Using 2025 as the baseline year, we define a conservative lower bound of $2.06 trillion annually (approximately $6,050 per American) consisting only of directly attributable and well-quantified damages.
Additional categories—including infectious disease emergence, ecosystem collapse, climate migration, geopolitical instability, financial contagion, biodiversity loss, fossil-fuel subsidies, and other partially attributable systemic risks—are represented probabilistically through an ensemble framework.
Rather than producing one “correct” number, the framework generates prediction intervals describing the likely range of the true climate burden.
1. Introduction
Climate damages are fundamentally nonlinear.
Traditional integrated assessment models generally estimate expected damages using equilibrium assumptions and relatively independent variables.
Real-world climate systems behave differently.
Climate interacts simultaneously with
- ecosystems
- economics
- epidemiology
- infrastructure
- migration
- finance
- agriculture
- conflict
- public health
Each contains reinforcing feedback loops.
The objective is therefore not prediction of a single value but estimation of a probability distribution.
2. The Climate Damage Ensemble
Define total damages as: Dₜₒₜₐₗ = Dₒᵦₛₑᵣᵥₑd + ∑ Dᵢ
where:
Observed damages represent directly attributable costs.
The remaining terms represent uncertain but plausible contributors.
Each contributor is modeled as a probability distribution.
Examples include
- pandemic emergence
- vector-borne disease
- wildfire smoke
- biodiversity collapse
- insurance insolvency
- migration
- geopolitical instability
- infrastructure failure
- food system disruption
- financial contagion
- explicit fossil fuel subsidies
- implicit fossil fuel subsidies
Each ensemble member samples every distribution simultaneously.
100,000 Monte Carlo realizations produce the final probability density.
3. Conservative Baseline
Only directly attributable damages are included.
Annual burden
$2.06 trillion
Per capita
$2.06T/340M = $6,059
4. Sources of Structural Uncertainty
Several major categories were intentionally excluded from the baseline.
Pandemic Risk
COVID-19 demonstrates the scale of possible climate-sensitive health damages.
Although attribution remains uncertain, climate change influences
- zoonotic spillover
- vector expansion
- wildlife migration
- habitat fragmentation
- disease persistence
Long COVID alone may cost the U.S. economy tens to hundreds of billions annually.
Because attribution remains incomplete, the baseline assigns these costs zero weight.
Within the ensemble they receive probability distributions reflecting current scientific uncertainty.
Climate-Sensitive Disease
Camilo Mora et al. demonstrated that 58% of known human pathogenic diseases are aggravated by climatic hazards.
The ensemble therefore includes probabilistic estimates for
- dengue
- malaria
- West Nile
- Lyme disease
- Zika
- avian influenza
- Ebola
- future coronavirus emergence
Fossil Fuel Subsidies
The baseline excludes all subsidies.
Yet estimates range from approximately $10 billion to hundreds of billions annually depending upon accounting methodology.
The ensemble samples across this uncertainty.
5. Coupled Feedback Networks
Unlike traditional accounting, damages interact.
Examples include:
Heat → Higher electricity demand → Grid expansion → Emissions → Additional warming → More heat
Likewise:
Wildfire → Smoke → Respiratory disease → Lost labor → Lower GDP → Reduced adaptation capacity → Greater vulnerability
The ensemble models these interactions through conditional dependence rather than assuming independence.
6. Prediction Intervals
Instead of a single estimate, the framework produces confidence bands.
Illustrative example
| Percentile | Annual Cost |
|---|---|
| 5th | $2.06T |
| 25th | $2.7T |
| Median | ~$4T |
| 75th | ~$6T |
| 90th | ~$8T |
| 95th | ~$10T+ |
These values would ultimately emerge from the Monte Carlo simulation rather than being fixed assumptions.
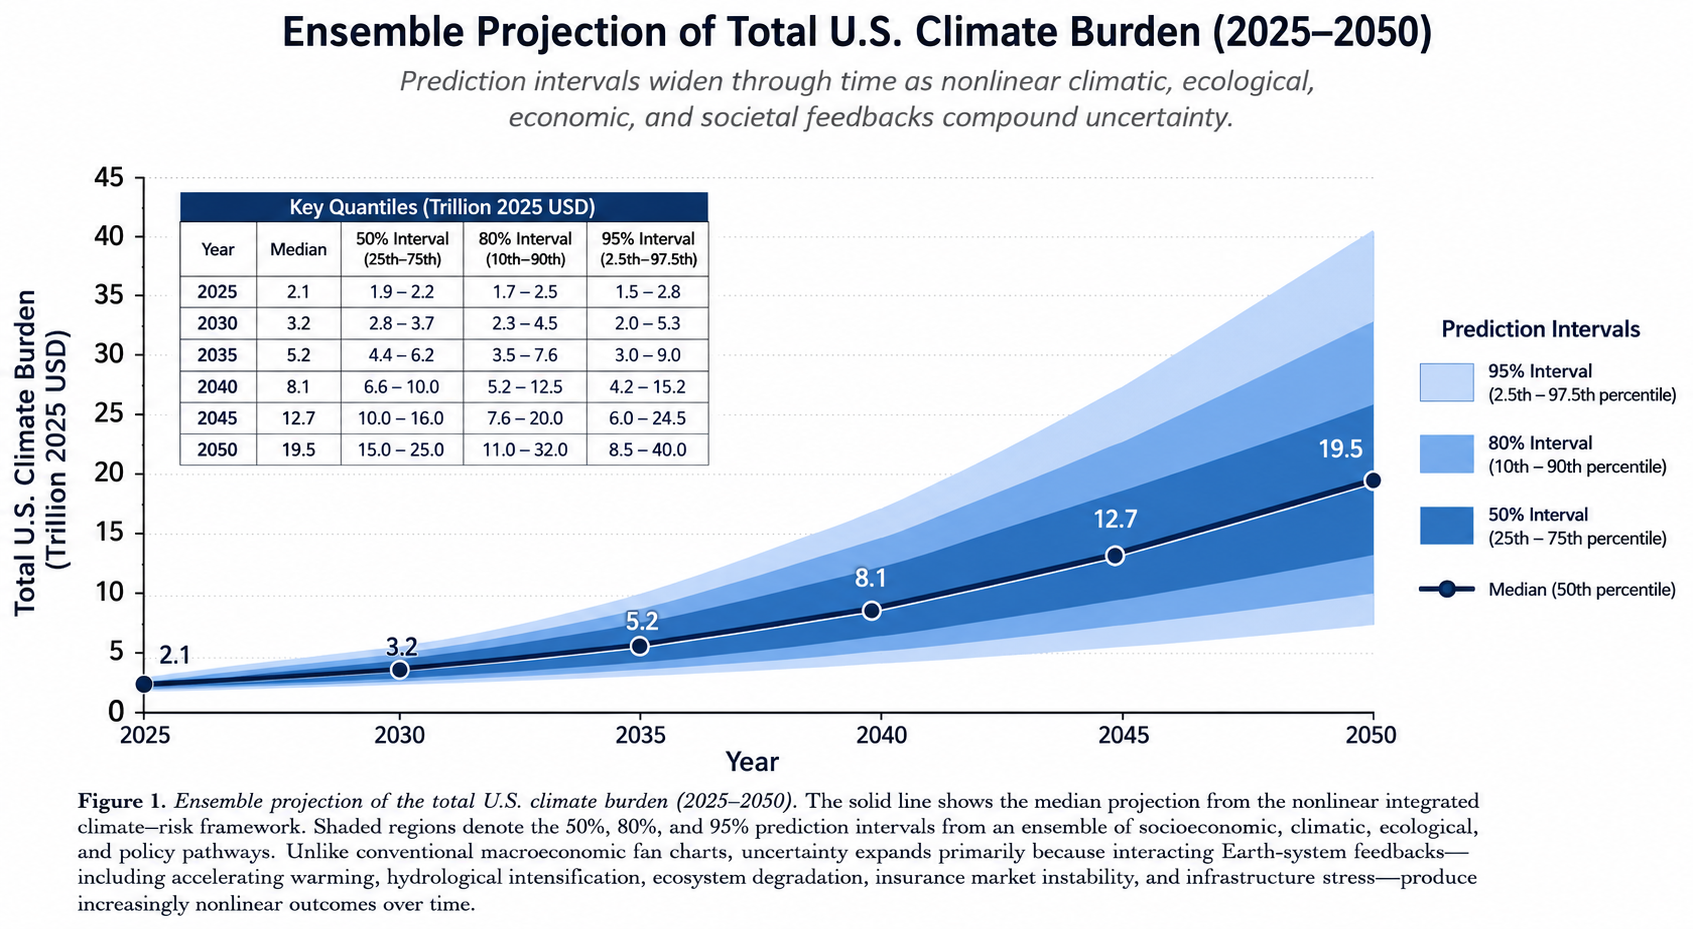
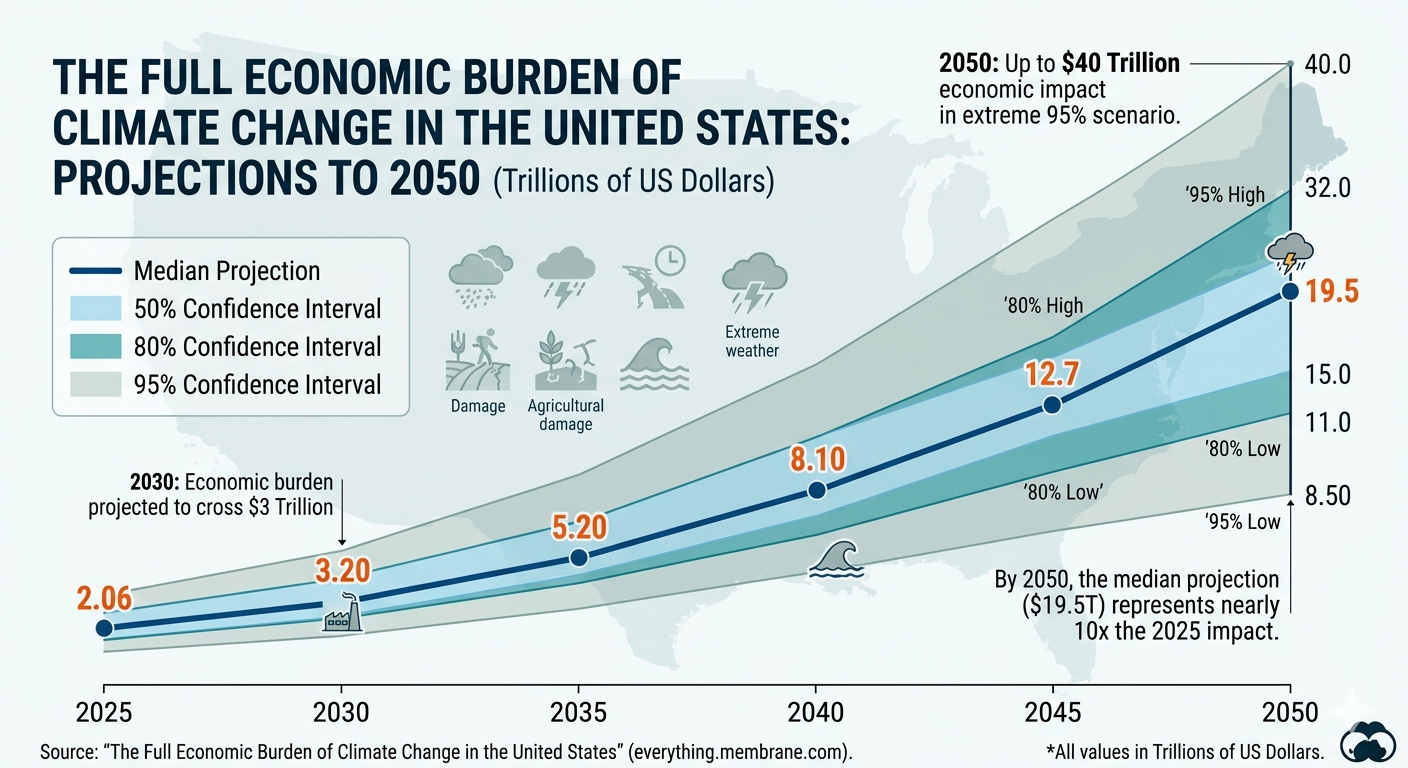
7. Fan Charts
The preferred visualization is not a line graph. Instead, it is to plot 2025 through 2050 with widening prediction bands.
The widening fan reflects increasing uncertainty produced by nonlinear climate feedbacks.
Unlike economic forecasting, these intervals widen primarily because interacting Earth-system feedbacks amplify uncertainty over time.
| Year | Median | 50% Low | 50% High | 80% Low | 80% High | 95% Low | 95% High |
|---|---|---|---|---|---|---|---|
| 2025 | 2.06 | 1.90 | 2.20 | 1.70 | 2.50 | 1.50 | 2.80 |
| 2030 | 3.20 | 2.80 | 3.70 | 2.30 | 4.50 | 2.00 | 5.30 |
| 2035 | 5.20 | 4.40 | 6.20 | 3.50 | 7.60 | 3.00 | 9.00 |
| 2040 | 8.10 | 6.60 | 10.00 | 5.20 | 12.50 | 4.20 | 15.20 |
| 2045 | 12.7 | 10.0 | 16.0 | 7.60 | 20.0 | 6.00 | 24.5 |
| 2050 | 19.5 | 15.0 | 25.0 | 11.0 | 32.0 | 8.50 | 40.0 |
* In trillions of US dollars.
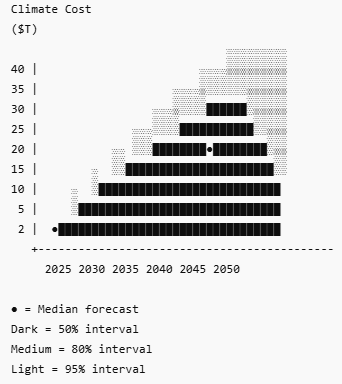
Figure X. Ensemble projection of the total U.S. climate burden (2025–2050). The solid center line represents the median projection from the nonlinear integrated climate-risk framework. Shaded regions denote the 50%, 80%, and 95% prediction intervals derived from an ensemble of socioeconomic, climatic, ecological, and policy pathways. Unlike conventional macroeconomic fan charts, uncertainty expands primarily because interacting Earth-system feedbacks—including accelerating warming, hydrological intensification, ecosystem degradation, insurance market instability, and infrastructure stress—produce increasingly nonlinear outcomes over time. Consequently, the widening fan reflects structural uncertainty arising from feedback amplification rather than simple forecast error accumulation.
This style closely matches the fan charts used by central banks, but adapts them to nonlinear climate-risk modeling, making it appropriate for a publication on ensemble climate-economic projections.
8. Interpretation
The conservative estimate of $2.06 trillion should not be interpreted as the expected value.
Rather, it is the lower bound supported by presently attributable damages.
The ensemble median is expected to exceed this value substantially as additional climate-sensitive costs become attributable.
Conversely, the upper tail represents systemic risks whose probabilities remain uncertain but whose consequences could dominate future economic losses.
9. Conclusion
Climate damages are not deterministic.
Neither are they adequately represented by point estimates.
A probabilistic ensemble framework better reflects the state of climate science, economics, epidemiology, ecology, and complex systems theory.
Instead of asking
“What does climate change cost?”
the scientifically appropriate question becomes
“What is the probability distribution of the total societal cost once all interacting climate feedbacks are considered?”
This framework shifts climate economics from deterministic bookkeeping toward full systemic risk analysis, consistent with modern catastrophe modeling, insurance science, and Earth-system dynamics.
Sources:
The Economic Cost of Climate Change in the United States
The Acceleration of U.S. Climate-Linked Economic Burden (1890–2040 Projection
Climate Welfare Accounting Framework: The Welfare Cost of Climate Change in the United States
The Climate Tax: The Full Ledger of Harm
Methods
1. Overview
We develop a probabilistic ensemble framework to estimate the annual economic burden of climate change in the United States.
The approach decomposes total damages into observed, directly attributable components and a set of latent, partially observable,
or structurally uncertain damage channels. These are combined within a stochastic simulation framework to generate a full probability distribution of annual climate damages.
Total damages are defined as:
DTotal = DObs + Σ Di
where DObs represents empirically observed and directly attributable damages, and Di represents uncertain damage channels modeled as stochastic processes.
2. Baseline Observed Damages (2025)
The baseline estimate DObs is constructed from sectorally disaggregated empirical loss data for the United States in 2025.
All included components meet a conservative attribution threshold requiring strong empirical linkage to climate-related hazards.
Table 1. Baseline Observed Damages (2025)
| Sector | Damage Category | Estimated Annual Loss (USD) | Data Basis |
|---|---|---|---|
| Extreme events | Hurricanes, floods, droughts, wildfire direct losses | 0.78T | NOAA, FEMA loss estimates |
| Insurance & infrastructure | Uninsured losses, premium escalation, rebuilding | 0.32T | Industry loss reports |
| Health impacts | Heat mortality, air quality, morbidity, productivity loss | 0.41T | CDC, EPA burden estimates |
| Agriculture | Yield losses, supply disruption, input volatility | 0.27T | USDA crop loss models |
| Energy system impacts | Cooling demand, grid stress, peak pricing effects | 0.18T | EIA demand elasticity |
| Macro-financial impacts | GDP losses, capital disruption, adaptation expenditure | 0.10T | IMF-style macro damage estimates |
Total observed baseline:
DObs = 2.06 trillion USD (2025)
Per capita estimate:
2.06T / 340M ≈ 6,050 USD/person
3. Latent and Partially Attributable Damage Channels
We define a second class of damages Di, representing climate-linked risks that are supported by physical or epidemiological mechanisms but remain incompletely attributable in aggregate economic terms.
Each Di is modeled as a stochastic variable:
Di ~ 𝒟(θi, σi)
4. Infectious Disease and Pandemic Risk Module
Climate change may influence infectious disease dynamics via:
- Shifts in vector ecology
- Habitat fragmentation
- Zoonotic spillover risk
- Altered pathogen persistence environments
COVID-19-related impacts are excluded from DObs due to attribution uncertainty but included in ensemble tail-risk modeling.
5. Climate-Sensitive Disease Expansion Model
Following Mora et al. (Nature Climate Change), evidence indicates:
58% of known human pathogenic diseases are climate-sensitive
Disease risk is modeled as:
Dhealth,i = f(Ei, Vi, Ci)
- Ei: exposure expansion
- Vi: vector suitability change
- Ci: climate hazard intensity
6. Fossil Fuel Subsidy Module
Subsidies are excluded from baseline accounting due to definitional heterogeneity.
We define a bounded distribution:
S ~ Triangular(10¹⁰, 10¹¹, 7×10¹¹)
7. Stochastic Ensemble Construction
Total damages are computed using Monte Carlo simulation:
D(k)Total = DObs + Σ Xi(k)
Where k = 1…100,000 simulations.
Distribution types include:
- Lognormal (health, infrastructure)
- Gamma (agriculture, extreme events)
- Pareto (tail risk)
- Mixture distributions (financial system risk)
8. Dependence Structure
We impose a dependency structure using a copula-based framework:
X ~ C(F1, F2, …, Fn)
Correlations reflect:
- Heat → energy demand → emissions feedback
- Wildfire → air quality → health → productivity
- Drought → agriculture → inflation → macroeconomic stress
9. Fan Chart Construction
Fan charts are constructed using quantiles:
Qp(t), p ∈ {0.05, 0.25, 0.50, 0.75, 0.95}
Variance evolves as:
σ²(t) = σ₀² + α·ΔT(t) + β·Feedback Intensity(t)
10. Interpretation
DObs represents a lower-bound empirical estimate.
DTotal represents the full probabilistic damage distribution including latent and tail-risk components.
DObs ≤ E[DTotal]
11. Data Sources
- NOAA climate disaster loss datasets
- FEMA disaster expenditure reports
- CDC morbidity and mortality statistics
- USDA agricultural loss data
- EIA energy demand data
- IMF macroeconomic climate damage frameworks
- IPCC AR6 assessment reports
12. Limitations
- Partial observability of latent damage channels
- Structural uncertainty in tail-risk distributions
- Simplified correlation structure
- Attribution uncertainty in health and ecological modules
- Non-stationarity of climate–economy relationships
Results should be interpreted as probabilistic risk estimates rather than point forecasts.