by Daniel Brouse
Why Traditional Carbon Accounting Underestimates Responsibility
Climate responsibility is often measured using territorial emissions: the greenhouse gases released within a country’s borders. While useful, this approach does not capture the full climate footprint of modern economies because it ignores global supply chains, outsourced manufacturing, land-use change, and upstream fossil fuel emissions.
A more complete measure requires calculating Per Capita Total Contribution—a footprint-based accounting system that assigns responsibility based on the full lifecycle of consumption and environmental impact.
This approach combines:
- Consumption-based emissions accounting — tracking emissions embedded in imported goods and services.
- Land Use Change (LUC) — including deforestation, agricultural expansion, and ecosystem conversion.
- Upstream fossil fuel emissions — including methane leaks, flaring, and coal mine emissions.
- International transportation — including aviation and shipping.
- All greenhouse gases — not just carbon dioxide, but methane, nitrous oxide, and other climate pollutants.
Using this broader framework, humanity’s total annual climate footprint rises to approximately 53.5 billion tonnes of CO₂-equivalent (CO₂e), or about 6.6 tonnes of CO₂e per person globally.
However, once these factors are included, the global map of climate responsibility changes dramatically.
1. The Hidden Carbon Footprint of Global Trade
Outsourced Emissions: When Consumption Drives Pollution Elsewhere
Traditional accounting assigns emissions to the country where goods are produced. This creates a major distortion in a globalized economy.
Consumption-based accounting reverses this by:
- Subtracting emissions from exports.
- Adding emissions embedded in imports.
- Assigning responsibility to the final consumer.
This reveals a significant shift:
Western Consumption Footprints Expand
Many wealthy nations have reduced domestic industrial emissions partly by moving manufacturing overseas. Electronics, clothing, machinery, and other consumer products may be manufactured in China or Southeast Asia, but much of the demand originates in North America and Europe.
The emissions occur in the producing country, but the consumption benefit occurs elsewhere.
Carbon Exporters vs. Carbon Importers
Under territorial accounting:
- Manufacturing nations appear more responsible.
- Consumer nations appear cleaner.
Under footprint accounting:
- Major consumer economies become large net importers of carbon emissions.
- Manufacturing hubs become net exporters of embedded carbon.
2. The Missing Climate Cost of Land Use Change
Deforestation and land conversion contribute roughly 10% of global greenhouse gas emissions.
However, these emissions are rarely assigned to the ultimate consumers driving demand.
A complete accounting system tracks:
- Beef production linked to Amazon clearing.
- Soy expansion replacing forests.
- Palm oil plantations.
- Timber extraction.
- Agricultural conversion.
Consumer-Driven Deforestation Footprints
Some nations experience a substantial increase in their climate footprint when imported commodities are included.
Examples:
- Wealthy food-importing nations may carry a larger footprint because their consumption drives land clearing elsewhere.
- Countries such as Brazil and Indonesia receive major additions from domestic land-use change before those emissions are redistributed through trade.
3. Fossil Fuel Extraction: Counting the Full Climate Cost
Burning fossil fuels is only part of their climate impact.
A complete footprint must include emissions from extraction:
- Methane leakage from oil and gas production.
- Coal mine methane releases.
- Flaring.
- Venting during production and transport.
Methane is especially important because it is approximately 30 times more powerful than carbon dioxide over a 100-year period.
Territorial accounting can distort responsibility:
- Fossil fuel exporters may appear responsible for extraction emissions occurring within their borders.
- Consumer nations benefit from the energy but avoid the associated extraction footprint.
A true accounting system assigns these emissions across the entire fossil fuel supply chain, including the countries ultimately consuming the energy.
The Recalculated Climate Responsibility Landscape
| Country / Region | Standard Territorial CO₂ (Fossil Fuels Only) | Estimated Total Contribution (All GHGs + Trade + Land Use + Transport) | Primary Driver of Change |
|---|---|---|---|
| United States | ~14.9 tonnes/person | ~19.5–21.0 tonnes/person | High consumption, imported manufacturing, carbon-intensive lifestyles |
| Western Europe | ~4.5–7.0 tonnes/person | ~8.5–11.5 tonnes/person | Outsourced manufacturing and imported goods |
| China | ~8.0 tonnes/person | ~7.5–8.5 tonnes/person | Large manufacturing exporter offsets domestic emissions |
| Brazil | ~2.3 tonnes/person | ~6.0–7.5 tonnes/person | Deforestation and agricultural land conversion |
| India | ~2.0 tonnes/person | ~2.2 tonnes/person | Lower consumption footprint |
| Sub-Saharan Africa | <1.0 tonnes/person | <1.2 tonnes/person | Low consumption and limited industrial emissions |
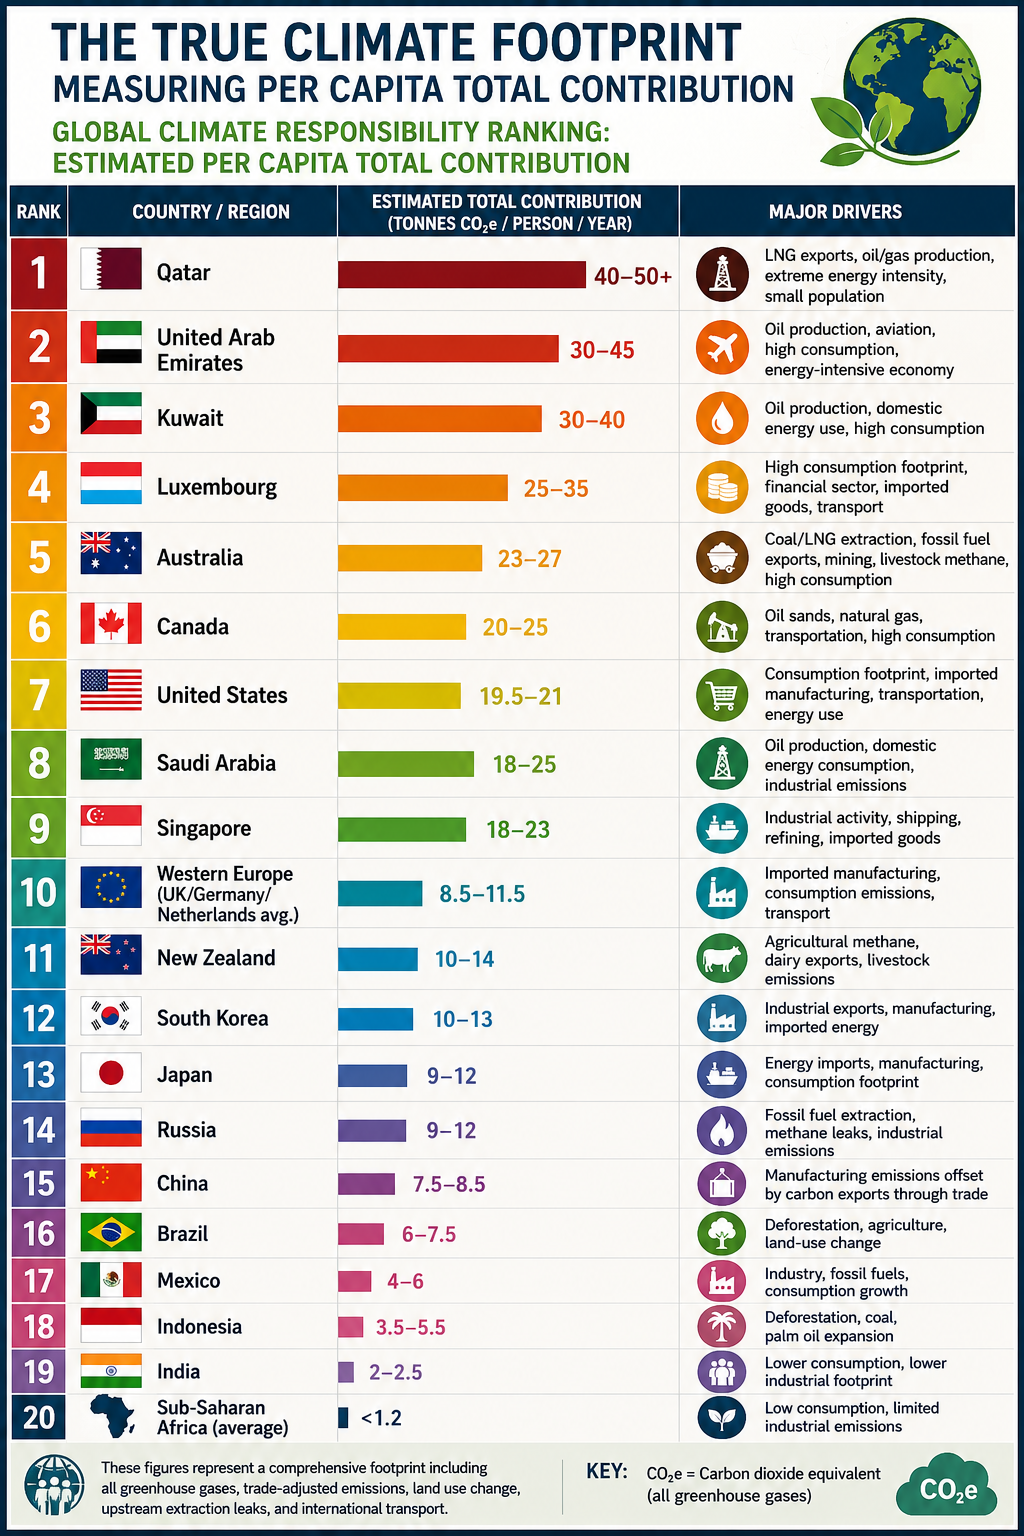
Global Climate Responsibility Ranking: Estimated Per Capita Total Contribution
| Rank | Country / Region | Estimated Total Contribution (Tonnes CO₂e/person/year) | Major Drivers |
|---|---|---|---|
| 1 | Qatar | 40–50+ | LNG exports, oil/gas production, extreme energy intensity, small population |
| 2 | United Arab Emirates | 30–45 | Oil production, aviation, high consumption, energy-intensive economy |
| 3 | Kuwait | 30–40 | Oil production, domestic energy use, high consumption |
| 4 | Luxembourg | 25–35 | High consumption footprint, financial sector, imported goods, transport |
| 5 | Australia | 23–27 | Coal/LNG extraction, fossil fuel exports, mining, livestock methane, high consumption |
| 6 | Canada | 20–25 | Oil sands, natural gas, transportation, high consumption |
| 7 | United States | 19.5–21 | Consumption footprint, imported manufacturing, transportation, energy use |
| 8 | Saudi Arabia | 18–25 | Oil production, domestic energy consumption, industrial emissions |
| 9 | Singapore | 18–23 | Industrial activity, shipping, refining, imported goods |
| 10 | Western Europe (UK/Germany/Netherlands average) | 8.5–11.5 | Imported manufacturing, consumption emissions, transport |
| 11 | New Zealand | 10–14 | Agricultural methane, dairy exports, livestock emissions |
| 12 | South Korea | 10–13 | Industrial exports, manufacturing, imported energy |
| 13 | Japan | 9–12 | Energy imports, manufacturing, consumption footprint |
| 14 | Russia | 9–12 | Fossil fuel extraction, methane leaks, industrial emissions |
| 15 | China | 7.5–8.5 | Manufacturing emissions offset by carbon exports through trade |
| 16 | Brazil | 6–7.5 | Deforestation, agriculture, land-use change |
| 17 | Mexico | 4–6 | Industry, fossil fuels, consumption growth |
| 18 | Indonesia | 3.5–5.5 | Deforestation, coal, palm oil expansion |
| 19 | India | 2–2.5 | Lower consumption, lower industrial footprint |
| 20 | Sub-Saharan Africa (average) | <1.2 | Low consumption, limited industrial emissions |
The Real Climate Equation: Consumption × Population × Technology
The climate challenge is often framed as a population problem. However, the dominant driver of emissions is not simply the number of people on Earth—it is the per capita intensity of resource consumption and pollution.
A more accurate equation is:Total Climate Impact=Population×Per Capita Consumption×Carbon Intensity
Population matters, but consumption patterns and technology determine the magnitude of environmental impact.
A world with billions more people using efficient, low-carbon systems could have a smaller footprint than a smaller population consuming resources at current high-intensity levels.
Toward a Fairer Climate Accounting System
Territorial emissions remain useful for tracking national inventories, but they do not fully capture responsibility in a globalized economy.
A true Per Capita Total Contribution framework recognizes that climate change is driven by:
- Who consumes resources.
- Who benefits from production.
- Who drives land conversion.
- Who extracts and burns fossil fuels.
- Who has the technological and economic capacity to reduce emissions.
The future of climate accountability depends on moving beyond borders and measuring the complete human footprint on Earth.
Conclusion
The climate conversation has focused on the wrong number.
The problem isn’t simply how many people live on Earth.
It’s how each of us lives.
The average person on the planet is responsible for about 6.6 tonnes of CO₂e per year, but the differences between countries are staggering. Some affluent societies generate 20–50+ tonnes per person, while much of the developing world contributes less than 2 tonnes.
That’s why climate responsibility is better measured by per capita total contribution—including consumption, outsourced manufacturing, deforestation, fossil fuel extraction, agriculture, and transportation—not just emissions produced within national borders.
A child born into a high-consumption lifestyle can have a climate footprint many times larger than several people living in low-consumption economies.
The challenge is not humanity itself.
The challenge is how we consume, how we produce, and how much we extract from the planet.
Changing lifestyles, improving efficiency, and transitioning to cleaner energy can reduce our impact without reducing our humanity.
The future depends less on the number of people—and more on the choices each of us makes.