bookmark_borderGraupel

Recently, parts of Pennsylvania witnessed graupel. Graupel is not snow, nor is it hail. Wikipedia defines graupel as:

Graupel (German pronunciation: [ˈɡʁaʊpɛl]; English /ˈɡraʊpəl/, also called soft hail or snow pellets) is precipitation that forms when supercooled droplets of water are collected and freeze on a falling snowflake, forming a 2–5 mm (0.079–0.197 in) ball of rime. The term graupel comes from the German language.

Graupel is distinct from hail, small hail and ice pellets: the World Meteorological Organization defines small hail as snow pellets encapsulated by ice, a precipitation halfway between graupel and hail. The METAR code for graupel is GS.

bookmark_borderNews from the Ice Wars

The Membrane Domain has been conducting Human Induced Climate Change Experiments since 1999. One of the first scientist to hypothesize that global warming was exponential (as opposed to the linear models) requested fellow scientists to conduct studies.

One Membrane Domain scientists began a study on the decline of the ice mass. The analysis is on-going; however, recent data leads to the conclusion that the process is exponential:

The two largest ice sheets on earth, Greenland and Antarctica, are losing mass faster and faster. The figure below is from Velicogna and Wahr, “Time-variable gravity observations of ice sheet mass balance: Precision and limitations of the GRACE satellite data” GEOPHYSICAL RESEARCH LETTERS, VOL. 40, 3055-3063, doi:10.1002/grl.50527, 2013

Mass loss for Greenland and  Antarctica from 2003-2013

For reference, 360 GTonne of mass loss results in 1 mm sea level rise. Greenland lost more than that in 2012 alone.

Causes of Mass Loss

I. Marine terminated glaciers flow to the ocean and calve off icebergs. The figure below is from Rignot and Mouginot,”Ice flow in Greenland for the International Polar Year 2008-2009,” GEOPHYSICAL RESEARCH LETTERS, VOL. 39, L11501, doi:10.1029/2012GL051634, 2012

Read More on the Decline of the Ice Mass

bookmark_borderGlobal Warming Proof

by the Institute for Marine and Antarctic Studies

Ocean measurements taken more than 135 years ago during the scientific expedition of HMS Challenger have provided further confirmation of human-produced global warming over the past century.

The researchers also found the thermal expansion of sea water caused by this global warming contributed to around 40 per cent of the total sea level rise seen in tide gauges from 1873 to 1955. The remaining 60 per cent was likely to have come from the melting of ice sheets and glaciers.

“Our research revealed warming of the planet can be clearly detected since 1873 and that our oceans continue to absorb the great majority of this heat,” said lead author Dr Will Hobbs, a researcher at the University of Tasmania’s Institute for Marine and Antarctic Studies and the Australian Research Council’s Centre of Excellence for Climate System Science.

“Currently scientists estimate the oceans absorb more than 90 per cent of the heat trapped by greenhouse gases, and we attribute the global warming to anthropogenic causes.”

The Challenger expedition, from 1872-1876, was the world’s first global scientific survey of life beneath the ocean surface. Along the way scientists measured ocean temperatures, lowering thermometers hundreds of metres deep on ropes made from Italian hemp during its voyage.

Researchers combined these data with modern observations and used both in state-of-the-art climate models to get a picture of how the world’s oceans have changed since the Challenger’s voyage.

“The key to this research was to determine the range of uncertainty for the measurements taken by the crew of the Challenger,” said study co-author Josh Willis, a climate scientist at NASA’s Jet Propulsion Laboratory.

“After we had taken all these uncertainties into account, it became apparent that the rate of warming we saw across the oceans far exceeded the degree of uncertainty around the measurements.

“So, while the uncertainty was large, the warming signal detected was far greater.”

Uncertainties around the Challenger’s measurements were caused by the limited areas measured during the voyage; the actual depths the thermometers descended to and the likely natural variation in temperature that could occur in each region during the voyage.

To get the most reliable results the researchers used the most conservative estimates after taking into account the maximum possible variation caused by these uncertainties.

“Because we took the most conservative outcome, we are likely to have underestimated the true temperature rise,” said Dr Hobbs.

“A simple analysis of our results suggests we may have underestimated the warming by as much as 17 per cent. In fact many of the stations most prone to bias were in the Eastern Pacific – a region showing one of the strongest ocean warming trends – so the true warming may be even larger than that.”

In addition to determining the increase in temperatures, the measurements from the Challenger expedition revealed the amount of thermal expansion in sea level rise in the oceans before the 1950s. Prior to this research, climate models offered the only way to estimate the change.

“This research adds yet another suite of compelling data that shows human activity continues to have a dramatic influence on the Earth’s climate,” said Dr Hobbs.

bookmark_borderOh No Snow

BOZEMAN, Mont. – Warmer spring temperatures since 1980 are causing an estimated 20 percent loss of snow cover across the Rocky Mountains of western North America, according to new research from the U.S. Geological Survey.

The new study builds upon a previous USGS snowpack investigation which showed that, until the 1980s, the northern Rocky Mountains experienced large snowpacks when the central and southern Rockies experienced meager ones, and vice versa. Yet, since the 1980s, there have been simultaneous snowpack declines along the entire length of the Rocky Mountains, and unusually severe declines in the north.

The new study has teased apart and quantified the different influences of winter temperature, spring temperature, and precipitation on historic snowpack variations and trends in the region. To distinguish those varying influences, the researchers implemented a regional snow model that uses inputs of monthly temperature and precipitation data from 1895 to 2011.

“Each year we looked at temperature and precipitation variations and the amount of water contained within the snowpack as of April,” said USGS scientist Greg Pederson, the lead author of the study. “Snow deficits were consistent throughout the Rockies due to the lack of precipitation during the cool seasons during the 1930s – coinciding with the Dust Bowl era. From 1980 on, warmer spring temperatures melted snowpack throughout the Rockies early, regardless of winter precipitation. The model in turn shows temperature as the major driving factor in snowpack declines over the past thirty years.”

Runoff from Rocky Mountain winter snowpack accounts for 60 to 80 percent of the annual water supply for more than 70 million people living in the western U.S., and is influenced by factors such as the snowpack’s water content, known as snow water equivalent, and the timing of snowmelt.

The timing of snowmelt affects not only when water is available for crop irrigation and energy production from hydroelectric dams, but also the risk of regional floods and wildfires. Earlier and faster snowmelt could have repercussions for water supply, risk management, and ecosystem health in western watersheds.

Regional snowpack accumulation is highly sensitive to variations in both temperature and precipitation over time. Patterns and sources of these variations are difficult to discern due to complex mountain topography, the different influence of Pacific Ocean climate, like La Niña and El Niño, on winter precipitation in the northern versus southern and central Rockies, and the brevity and patchiness of detailed snow records.

In the study, the regional snow model used by Pederson and his USGS colleagues Julio Betancourt and Greg McCabe allows estimation of snow water and cover variability at different latitudes and elevations during the last century regardless of the absence of direct and long-term observations everywhere. Recent snowpack variations also were evaluated in the context of snowpack evidence from tree-rings, allowing the scientists to compare recent observations to measurements from the past 800 years.

McCabe, co-author of the study, explains that “recent springtime warming also reduced the extent of snow cover at low to middle elevations where temperature has had the greatest impact.”

“Both natural variability in temperature and anthropogenic warming have contributed to the recent snowpack decline, though disentangling their influences exactly remains elusive.” Betancourt said,

“Regardless of the ultimate causes, continuation of present snowpack trends in the Rocky Mountains will pose difficult challenges for watershed management and conventional water planning in the American West.”

The study, “Regional patterns and proximal causes of the recent snowpack decline in the Rocky Mountains,” is available from Geophysical Research Letters, a journal of the American Geophysical Union.

bookmark_borderMore Fire, Less Snow

If a tree falls in a forest and no one is around to hear it, does it make a sound?

The answer is yes, if it happened in New Mexico’s Jemez River Basin on June 26, 2011, at 1 p.m. local time.

The tipping of one tree as it creaked and fell hinted at a crackle soon to come, a fast-burning wildfire. Ultimately, the fire blazed through a large part of a 1.5 million-acre national forest.

On the day the fire started, strong, unpredictable winds blew through the trees, rustling leaves and creaking dead wood. Perhaps in a gust, a lone tree fell. On the way down, it took out a power line and sparked a fire that–by high noon the next day–had burned 43,000 acres, an acre every two seconds.

At sundown that next day, the Las Conchas Fire, as it came to be called, still ran wild. The toll had climbed to more than 61,000 acres of forest. Egged on by north winds, it jumped the trails of Pajarito Mountain Ski Area. Then it turned and raged south, threatening the town of Cochiti, N.M.

Within four days, it had singed more than 103,000 acres, making it the largest fire in New Mexico history at the time.

The forest and the watershed–the critical zone–left behind

What happened to the forests, rivers and streams the Las Conchas Fire left behind?

To find out, scientists at the National Science Foundation (NSF) Jemez River Basin and Santa Catalina Mountains Critical Zone Observatory (CZO), one of six such NSF CZOs in watersheds across the country, lit out for the hills.

The Jemez River Basin and Santa Catalina Mountains CZO is formed by twin sites: one in the Jemez River Basin in the Valles Caldera National Preserve north of Albuquerque, N.M., in the greater Rio Grande Basin; the other in the Santa Catalina Mountains northeast of Tucson, Ariz., in the Colorado River Basin.

In addition to the Jemez River Basin and Santa Catalina Mountains site in New Mexico and Arizona, NSF CZOs are located in the Southern Sierra Nevada, Christina River Basin on the border of Delaware and Pennsylvania, Susquehanna Shale Hills in Pennsylvania, Boulder Creek in the Colorado Rockies, and Luquillo National Forest in Puerto Rico.

CZO scientists provide a new understanding of the critical zone–the thin veneer of Earth that extends from the top of the forest canopy to the base of weathered bedrock.

At the Jemez River and Santa Catalina Mountains CZO, researchers are asking questions such as: How does climate variation affect arid and semi-arid ecosystems? And, how do feedbacks between critical zone structure and the cycling of water and carbon alter short-term hydrology and long-term landscape evolution?

The water cycle, the breakdown of rocks and the eventual formation of soil, the evolution of rivers and valleys, the patterns of plant growth and landforms, all result from processes that take place in the critical zone.

“The critical zone is our living environment,” says Enriqueta Barrera, program director in NSF’s Division of Earth Sciences, which funds the CZO network. “The CZOs offer us new knowledge about this important zone and its response to climate and land-use change.”

The CZOs are the first systems-based observatories dedicated to understanding how Earth’s surface processes are coupled, she says. “They will help us predict how the critical zone affects the ecosystem services on which society depends.”

Fire burns long after it’s out

Water is at the top of that list of ecosystem services.

The freshwater supplies of the American West rely, for the most part, on snow.

As snow melts into water, it begins a journey that starts in the mountains and ends in faucets. When people turn on the shower or the sprinkler, they’re watering themselves, lawns and food crops with melted snow.

The Colorado River, the Rio Grande and other rivers in the intermountain west are the main sources of water for some of the driest parts of the country, say Jemez River Basin and Santa Catalina Mountains CZO scientists Jon Chorover and Paul Brooks of the University of Arizona and Adrian Harpold of the University of Colorado.

“Their flows are predominantly fed by snowmelt from high-elevation forests and meadows,” says Brooks.

Snow-covered forests are “a critical source of water in the western U.S.,” agrees Chorover. “Forests’ ability to ‘hold snow’ can be affected by fires, tree diseases, insect-caused die-offs and other factors.”

The Las Conchas Fire provided a unique opportunity to “evaluate how forest fires interact with a changing climate,” says Harpold, first author of a recent paper on the fire’s effects on winter snow and spring snowmelt published in the journal Ecohydrology. Brooks and other scientists are co-authors.

“Forest fires have been increasing in size and severity for the last several decades,” Harpold says. “Drier and warmer than average conditions in New Mexico in 2011 contributed to fires like Las Conchas.

“When the fire removed the forest canopy, more water vapor was lost from the snow surface to the dry atmosphere, reducing the amount of water stored in the snowpack and released the following spring.”

In essence, the scientists found, areas not burned in the fire retained more snow–and snowmelt water.

Into the Valles Caldera

The Valles Caldera National Preserve, it’s called, a parkland that surrounds the Valles Caldera, a 13.7 mile wide volcanic caldera in the Jemez Mountains of northern New Mexico. The preserve overlaps the Jemez River Basin CZO.

Valles Caldera National Preserve was the site of the scientists’ study; their research was conducted on Rabbit Mountain near the park’s southern boundary.

In November 2011, the researchers placed instruments in several catchments, or river basins, on Rabbit Mountain. The resulting information is being used to better understand the effects of fire on the water, carbon and energy cycles of the entire Jemez River Basin.

“The Jemez River Basin CZO is perfectly situated to learning how fire affects water resources,” says Brooks.

In the winter and spring of 2012, Brooks and Harpold, along with other researchers and students, collected and analyzed thousands of data points on snow depth and density in burned and unburned forests on Rabbit Mountain.

“We obtained one of the most complete data sets to date on snow hydrology and fire,” says Brooks.

Spruce-fir forests dominate Rabbit Mountain’s heights; ponderosa pines and oak scrublands cover the lower mountain.

Whether in spruce-fir or pine-oak, the Las Conchas Fire left much of Rabbit Mountain with severe burns. Dead, limbless trees, ghosts of the forest, line the horizon.

In unburned forests, about one-third of the fresh snow that fell in the winter of 2012 was caught in trees before it reached the ground. There shade and wind protection allowed it to accumulate over the winter.

Where trees were lost to the fire, more fresh snowfall made it to the ground. In the end, however, that was a double-edged sword: lack of shelter from the forest canopy resulted in more of the snowpack disappearing over the winter.

“Such changes in snowpack depth have important ramifications,” says Chorover, “for ecological health and for downstream water resources.”

After the Las Conchas Fire, if a tree falls in the forest and no one is around to hear it, does it make a sound?

If you’re listening for burbling spring brooks or streaming kitchen faucets, you may hear nothing but drip, drip, drip. Or silence.
— Cheryl Dybas, NSF (703) 292-7734 cdybas@nsf.gov

bookmark_borderSnow Covered Desert

While snow coverage has been retreating in the Northeastern United States, the increased volatile weather systems being caused by global warming are causing it to snow in the desert.

Snow-Covered Desert

Snow-covered deserts are rare, but that’s exactly what the Moderate Resolution Imaging Spectroradiometer (MODIS) on NASA’s Aqua satellite observed as it passed over the Taklimakan Desert in western China on Jan. 2, 2013. Snow has covered much of the desert since a storm blew through the area on Dec. 26. The day after the storm, Chinese Central Television (CNTV) reported that the Xinjian Uygyr autonomous region was one of the areas hardest hit.

The Taklimakan is one of the world’s largest—and hottest—sandy deserts. Water flowing into the Tarim Basin has no outlet, so over the years, sediments have steadily accumulated. In parts of the desert, sand can pile up to 300 meters (roughly 1,000 feet) high. The mountains that enclose the sea of sand—the Tien Shan in the north and the Kunlun Shan in the south—were also covered with what appeared to be a significantly thicker layer of snow in January 2013.

Snow In The Desert
Snow In The Desert

bookmark_borderRocky Mountain Snow

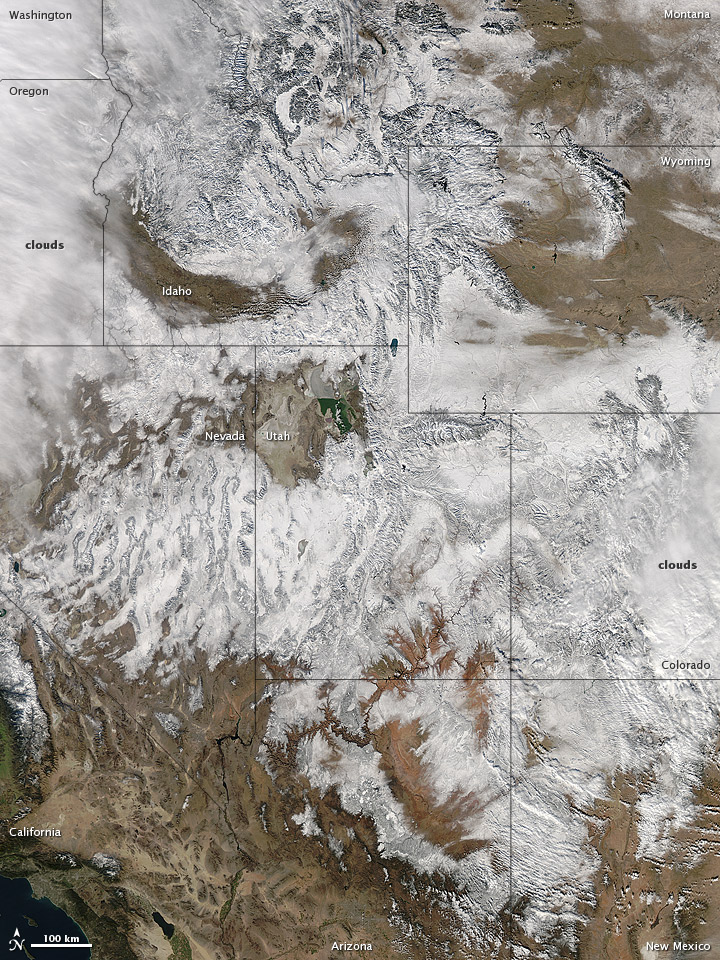
In time for the 2012 winter solstice, a storm dropped snow over most of the Rocky Mountains in the United States. On December 20, the National Weather Service reported snow depths exceeding 100 centimeters (39 inches) in some places—the result of the recent snowfall plus accumulation from earlier storms.

The Moderate Resolution Imaging Spectroradiometer (MODIS) on NASA’s Aqua satellite captured this natural-color image on December 19, 2012. Clouds had mostly cleared from the region, though some cloud cover lingered over parts of the Pacific Northwest and Colorado. Showing more distinct contours than the clouds, the snow cover stretched across the Rocky Mountains and the surrounding region, from Idaho to Arizona and from California to Colorado.

Snowfall did not stop in Colorado, as the storm continued moving eastward across the Midwest. By December 20, 2012, a combination of heavy snow and strong winds had closed schools, iced roads, and delayed flights, complicating plans for holiday travelers.

Though troublesome for travel, the snow brought much-needed moisture; multiple cities had set new records for consecutive days without measurable snow, CBS news reported. As of December 18, the U.S. Drought Monitor stated that a substantial portion of the continental United States continued to suffer from drought, and “exceptional” drought conditions extended from South Dakota to southern Texas.

Reference
CBS News. (2012, December 20) Snowstorm blows out of Rockies, into Midwest. Accessed December 20, 2012.
National Weather Service. (2012, December 20) National Snow Analyses. Accessed December 20, 2012.
University of Nebraska-Lincoln. (2012, December 18) U.S. Drought Monitor. Accessed December 20, 2012.

NASA image courtesy Jeff Schmaltz, LANCE MODIS Rapid Response. Caption by Michon Scott.

Instrument:
Aqua – MODIS

Rocky Mountain Snowstorm