The Fourth National Climate Assessment (NCA4), Volume I has determined that climate change is being unduly accelerated by human activities.
The report is an authoritative assessment of the science of climate change, with a focus on the United States. It represents the first of two volumes of the Fourth National Climate Assessment, mandated by the Global Change Research Act of 1990.
The report’s summary states:
For example, global average sea level has risen by about 7–8 inches since 1900, with almost half (about 3 inches) of that rise occurring since 1993. Human-caused climate change has made a substantial contribution to this rise since 1900, contributing to a rate of rise that is greater than during any preceding century in at least 2,800 years. Global sea level rise has already affected the United States; the incidence of daily tidal flooding is accelerating in more than 25 Atlantic and Gulf Coast cities.
Global average sea levels are expected to continue to rise—by at least several inches in the next 15 years and by 1–4 feet by 2100. A rise of as much as 8 feet by 2100 cannot be ruled out. Sea level rise will be higher than the global average on the East and Gulf Coasts of the United States.
Changes in the characteristics of extreme events are particularly important for human safety, infrastructure, agriculture, water quality and quantity, and natural ecosystems. Heavy rainfall is increasing in intensity and frequency across the United States and globally and is expected to continue to increase. The largest observed changes in the United States have occurred in the Northeast.
Heatwaves have become more frequent in the United States since the 1960s, while extreme cold temperatures and cold waves are less frequent. Recent record-setting hot years are projected to become common in the near future for the United States, as annual average temperatures continue to rise. Annual average temperature over the contiguous United States has increased by 1.8°F (1.0°C) for the period 1901–2016; over the next few decades (2021–2050), annual average temperatures are expected to rise by about 2.5°F for the United States, relative to the recent past (average from 1976–2005), under all plausible future climate scenarios.
The incidence of large forest fires in the western United States and Alaska has increased since the early 1980s and is projected to further increase in those regions as the climate changes, with profound changes to regional ecosystems.
Annual trends toward earlier spring melt and reduced snowpack are already affecting water resources in the western United States and these trends are expected to continue. Under higher scenarios, and assuming no change to current water resources management, chronic, long-duration hydrological drought is increasingly possible before the end of this century.
The magnitude of climate change beyond the next few decades will depend primarily on the amount of greenhouse gases (especially carbon dioxide) emitted globally. Without major reductions in emissions, the increase in annual average global temperature relative to preindustrial times could reach 9°F (5°C) or more by the end of this century. With significant reductions in emissions, the increase in annual average global temperature could be limited to 3.6°F (2°C) or less.
The global atmospheric carbon dioxide (CO2) concentration has now passed 400 parts per million (ppm), a level that last occurred about 3 million years ago, when both global average temperature and sea level were significantly higher than today. Continued growth in CO2 emissions over this century and beyond would lead to an atmospheric concentration not experienced in tens to hundreds of millions of years. There is broad consensus that the further and the faster the Earth system is pushed towards warming, the greater the risk of unanticipated changes and impacts, some of which are potentially large and irreversible.
The observed increase in carbon emissions over the past 15–20 years has been consistent with higher emissions pathways. In 2014 and 2015, emission growth rates slowed as economic growth became less carbon-intensive. Even if this slowing trend continues, however, it is not yet at a rate that would limit global average temperature change to well below 3.6°F (2°C) above preindustrial levels.
Introduction
New observations and new research have increased our understanding of past, current, and future climate change since the Third U.S. National Climate Assessment (NCA3) was published in May 2014. This Climate Science Special Report (CSSR) is designed to capture that new information and build on the existing body of science in order to summarize the current state of knowledge and provide the scientific foundation for the Fourth National Climate Assessment (NCA4).
Since NCA3, stronger evidence has emerged for continuing, rapid, human-caused warming of the global atmosphere and ocean. This report concludes that “it is extremely likely that human influence has been the dominant cause of the observed warming since the mid-20th century. For the warming over the last century, there is no convincing alternative explanation supported by the extent of the observational evidence.”
The last few years have also seen record-breaking, climate-related weather extremes, the three warmest years on record for the globe, and continued decline in arctic sea ice. These trends are expected to continue in the future over climate (multidecadal) timescales. Significant advances have also been made in our understanding of extreme weather events and how they relate to increasing global temperatures and associated climate changes. Since 1980, the cost of extreme events for the United States has exceeded $1.1 trillion; therefore, better understanding of the frequency and severity of these events in the context of a changing climate is warranted.
Periodically taking stock of the current state of knowledge about climate change and putting new weather extremes, changes in sea ice, increases in ocean temperatures, and ocean acidification into context ensures that rigorous, scientifically-based information is available to inform dialogue and decisions at every level. This climate science report serves as the climate science foundation of the NCA4 and is generally intended for those who have a technical background in climate science. In this Executive Summary, green boxes present highlights of the main report. These are followed by related points and selected figures providing more scientific details. The summary material on each topic presents the most salient points of chapter findings and therefore represents only a subset of the report’s content. For more details, the reader is referred to the individual chapters. This report discusses climate trends and findings at several scales: global, nationwide for the United States, and for ten specific U.S. regions (shown in Figure 1 in the Guide to the Report). A statement of scientific confidence also follows each point in the Executive Summary. The confidence scale is described in the Guide to the Report. At the end of the Executive Summary and in Chapter 1: Our Globally Changing Climate, there is also a summary box highlighting the most notable advances and topics since NCA3 and since the 2013 Intergovernmental Panel on Climate Change (IPCC) Fifth Assessment Report.
Global and U.S. Temperatures Continue to Rise
Long-term temperature observations are among the most consistent and widespread evidence of a warming planet. Temperature (and, above all, its local averages and extremes) affects agricultural productivity, energy use, human health, water resources, infrastructure, natural ecosystems, and many other essential aspects of society and the natural environment. Recent data add to the weight of evidence for rapid global-scale warming, the dominance of human causes, and the expected continuation of increasing temperatures, including more record-setting extremes. (Ch. 1)
Changes in Observed and Projected Global Temperature
- Global annual average temperature (as calculated from instrumental records over both land and oceans) has increased by more than 1.2°F (0.65°C) for the period 1986–2016 relative to 1901–1960; the linear regression change over the entire period from 1901–2016 is 1.8°F (1.0°C) (very high confidence; Fig. ES.1). Longer-term climate records over past centuries and millennia indicate that average temperatures in recent decades over much of the world have been much higher, and have risen faster during this time period than at any time in the past 1,700 years or more, the time period for which the global distribution of surface temperatures can be reconstructed (high confidence). (Ch. 1)
Figure 1
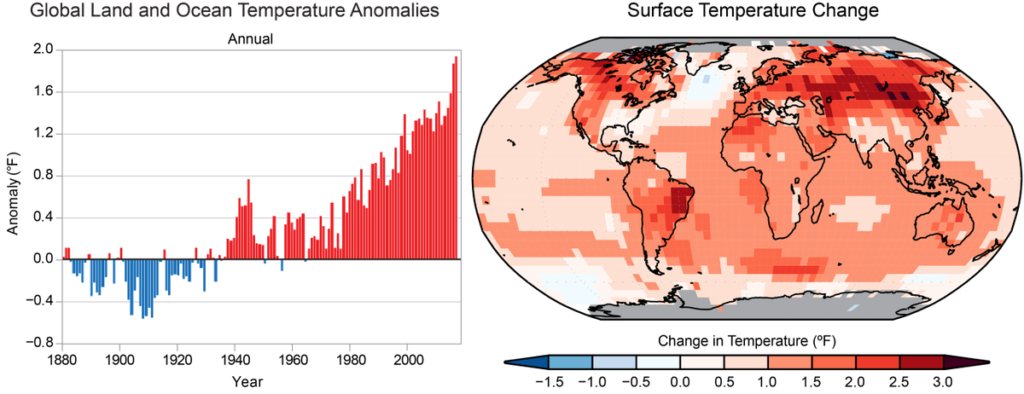
(left) Global annual average temperature has increased by more than 1.2°F (0.7°C) for the period 1986–2016 relative to 1901–1960. Red bars show temperatures that were above the 1901–1960 average, and blue bars indicate temperatures below the average. (right) Surface temperature change (in °F) for the period 1986–2016 relative to 1901–1960. Gray indicates missing data. From Figures 1.2. and 1.3 in Chapter 1.
- Many lines of evidence demonstrate that it is extremely likely that human influence has been the dominant cause of the observed warming since the mid-20th century. Over the last century, there are no convincing alternative explanations supported by the extent of the observational evidence. Solar output changes and internal natural variability can only contribute marginally to the observed changes in climate over the last century, and there is no convincing evidence for natural cycles in the observational record that could explain the observed changes in climate. (Very high confidence) (Ch. 1)
Figure 2
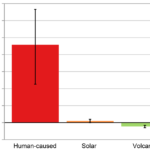 The likely range of the human contribution to the global mean temperature increase over the period 1951–2010 is 1.1° to 1.4°F (0.6° to 0.8°C), and the central estimate of the observed warming of 1.2°F (0.65°C) lies within this range (high confidence). This translates to a likely human contribution of 92%–123% of the observed 1951–2010 change. The likely contributions of natural forcing and internal variability to global temperature change over that period are minor (high confidence). (Ch. 3; Fig. ES.2)
 - Natural variability, including El Niño events and other recurring patterns of ocean–atmosphere interactions, impact temperature and precipitation, especially regionally, over timescales of months to years. The global influence of natural variability, however, is limited to a small fraction of observed climate trends over decades. (Very high confidence) (Ch. 1)
- Global climate is projected to continue to change over this century and beyond. The magnitude of climate change beyond the next few decades will depend primarily on the amount of greenhouse (heat-trapping) gases emitted globally and on the remaining uncertainty in the sensitivity of Earth’s climate to those emissions (very high confidence). With significant reductions in the emissions of greenhouse gases, the global annually averaged temperature rise could be limited to 3.6°F (2°C) or less. Without major reductions in these emissions, the increase in annual average global temperatures relative to pre-industrial times could reach 9°F (5°C) or more by the end of this century. (Ch.1; Fig ES.3)
- If greenhouse gas concentrations were stabilized at their current level, existing concentrations would commit the world to at least an additional 1.1°F (0.6°C) of warming over this century relative to the last few decades (high confidence in continued warming, medium confidence in amount of warming. (Ch.4)
Figure 3

The two panels above show annual historical and a range of plausible future carbon emissions in units of gigatons of carbon (GtC) per year (left) and the historical observed and future temperature change that would result for a range of future scenarios relative to the 1901–1960 average, based on the central estimate (lines) and a range (shaded areas, two standard deviations) as simulated by the full suite of CMIP5 global climate models (right). By 2081–2100, the projected range in global mean temperature change is 1.1°–4.3°F under the even lower scenario (RCP2.6; 0.6°–2.4°C, green), 2.4°–5.9°F under the lower scenario (RCP4.5; 1.3°–3.3°C, blue), 3.0°–6.8°F under the mid-high scenario (RCP6.0; 1.6°–3.8°C, not shown) and 5.0°–10.2°F under the higher scenario (RCP8.5; 2.8°–5.7°C, orange). See the main report for more details on these scenarios and implications. Based on Figure 4.1 in Chapter 4.
Changes in Observed and Projected U.S. Temperature
- Annual average temperature over the contiguous United States has increased by 1.2°F (0.7°C) for the period 1986–2016 relative to 1901–1960 and by 1.8°F (1.0°C) based on a linear regression for the period 1901–2016 (very high confidence). Surface and satellite data are consistent in their depiction of rapid warming since 1979 (high confidence). Paleo-temperature evidence shows that recent decades are the warmest of the past 1,500 years (medium confidence). (Ch. 6)
- Annual average temperature over the contiguous United States is projected to rise (very high confidence). Increases of about 2.5°F (1.4°C) are projected for the period 2021–2050 relative to the average from 1976–2005 in all RCP scenarios, implying recent record-setting years may be “common” in the next few decades (high confidence). Much larger rises are projected by late century (2071–2100): 2.8°–7.3°F (1.6°–4.1°C) in a lower scenario (RCP4.5) and 5.8°–11.9°F (3.2°–6.6°C) in a higher scenario (RCP8.5) (high confidence). (Ch. 6; Fig. ES.4)
- In the United States, the urban heat island effect results in daytime temperatures 0.9°–7.2°F (0.5°–4.0°C) higher and nighttime temperatures 1.8°– 4.5°F (1.0°–2.5°C) higher in urban areas than in rural areas, with larger temperature differences in humid regions (primarily in the eastern United States) and in cities with larger and denser populations. The urban heat island effect will strengthen in the future as the structure and spatial extent as well as population density of urban areas change and grow (high confidence). (Ch. 10)
Figure 4
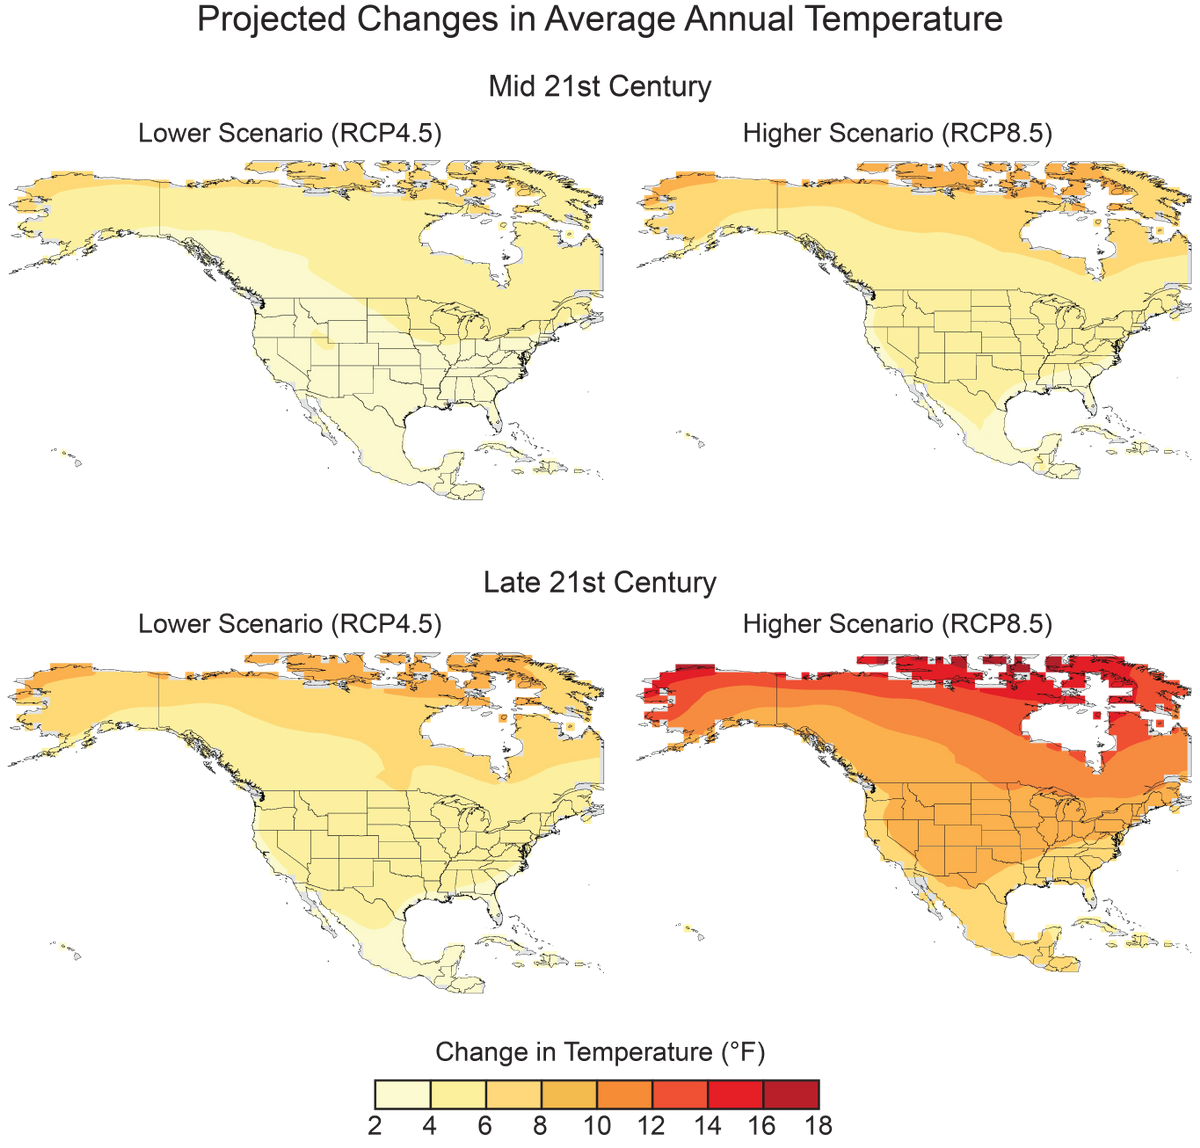
These maps show the projected changes in annual average temperatures for mid- and late-21st century for two future pathways. Changes are the differences between the average projected temperatures for mid-century (2036–2065; top), and late-century (2070-2099; bottom), and those observed for the near-present (1976–2005). See Figure 6.7 in Chapter 6 for more details.
Many Temperature and Precipitation Extremes Are Becoming More Common
Temperature and precipitation extremes can affect water quality and availability, agricultural productivity, human health, vital infrastructure, iconic ecosystems and species, and the likelihood of disasters. Some extremes have already become more frequent, intense, or of longer duration, and many extremes are expected to continue to increase or worsen, presenting substantial challenges for built, agricultural, and natural systems. Some storm types such as hurricanes, tornadoes, and winter storms are also exhibiting changes that have been linked to climate change, although the current state of the science does not yet permit detailed understanding.
Observed Changes in Extremes
Figure 5
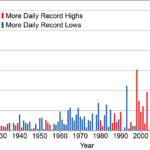 The frequency of cold waves has decreased since the early 1900s, and the frequency of heat waves has increased since the mid-1960s (the Dust Bowl era of the 1930s remains the peak period for extreme heat in the United States). (Very high confidence). (Ch. 6)
- The frequency and intensity of extreme heat and heavy precipitation events are increasing in most continental regions of the world (very high confidence). These trends are consistent with expected physical responses to a warming climate. Climate model studies are also consistent with these trends, although models tend to underestimate the observed trends, especially for the increase in extreme precipitation events (very high confidence for temperature, high confidence for extreme precipitation). (Ch. 1)
Figure 6
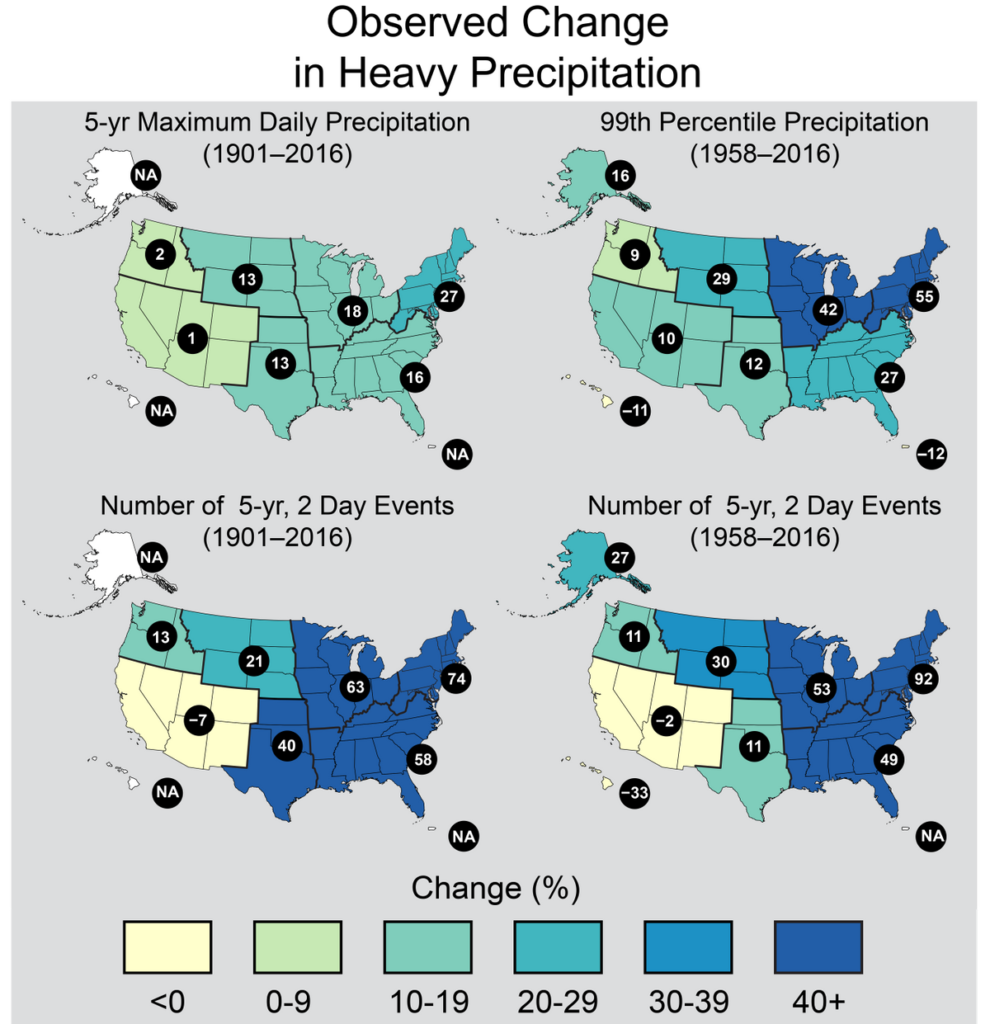
These maps show the percentage change in several metrics of extreme precipitation by NCA4 region, including (upper left) the maximum daily precipitation in consecutive 5-year periods; (upper right) the amount of precipitation falling in daily events that exceed the 99th percentile of all non-zero precipitation days (top 1% of all daily precipitation events); (lower left) the number of 2-day events with a precipitation total exceeding the largest 2-day amount that is expected to occur, on average, only once every 5 years, as calculated over 1901–2016; and (lower right) the number of 2-day events with a precipitation total exceeding the largest 2-day amount that is expected to occur, on average, only once every 5 years, as calculated over 1958–2016. The number in each black circle is the percent change over the entire period, either 1901–2016 or 1958–2016. Note that Alaska and Hawai‘i are not included in the 1901–2016 maps owing to a lack of observations in the earlier part of the 20th century. (Figure source: CICS-NC / NOAA NCEI). Based on Figure 7.4 in Chapter 7.
- Recent droughts and associated heat waves have reached record intensity in some regions of the United States; however, by geographical scale and duration, the Dust Bowl era of the 1930s remains the benchmark drought and extreme heat event in the historical record. (Very high confidence) (Ch. 8)
- Northern Hemisphere spring snow cover extent, North America maximum snow depth, snow water equivalent in the western United States, and extreme snowfall years in the southern and western United States have all declined, while extreme snowfall years in parts of the northern United States have increased. (Medium confidence). (Ch. 7)
- There has been a trend toward earlier snowmelt and a decrease in snowstorm frequency on the southern margins of climatologically snowy areas (medium confidence). Winter storm tracks have shifted northward since 1950 over the Northern Hemisphere (medium confidence). Potential linkages between the frequency and intensity of severe winter storms in the United States and accelerated warming in the Arctic have been postulated, but they are complex, and, to some extent, contested, and confidence in the connection is currently low. (Ch. 9)
- Tornado activity in the United States has become more variable, particularly over the 2000s, with a decrease in the number of days per year with tornadoes and an increase in the number of tornadoes on these days (medium confidence). Confidence in past trends for hail and severe thunderstorm winds, however, is low (Ch. 9)
Projected Changes in Extremes
- The frequency and intensity of extreme high temperature events are virtually certain to increase in the future as global temperature increases (high confidence). Extreme precipitation events will very likely continue to increase in frequency and intensity throughout most of the world (high confidence). Observed and projected trends for some other types of extreme events, such as floods, droughts, and severe storms, have more variable regional characteristics. (Ch. 1)
- Both extremely cold days and extremely warm days are expected to become warmer. Cold waves are predicted to become less intense while heat waves will become more intense. The number of days below freezing is projected to decline while the number above 90°F will rise. (Very high confidence) (Ch. 6)
- The frequency and intensity of heavy precipitation events in the United States are projected to continue to increase over the 21st century (high confidence). There are, however, important regional and seasonal differences in projected changes in total precipitation: the northern United States, including Alaska, is projected to receive more precipitation in the winter and spring, and parts of the southwestern United States are projected to receive less precipitation in the winter and spring (medium confidence). (Ch. 7)
- The frequency and severity of landfalling “atmospheric rivers” on the U.S. West Coast (narrow streams of moisture that account for 30%–40% of the typical snowpack and annual precipitation in the region and are associated with severe flooding events) will increase as a result of increasing evaporation and resulting higher atmospheric water vapor that occurs with increasing temperature. (Medium confidence) (Ch. 9)
- Projections indicate large declines in snowpack in the western United States and shifts to more precipitation falling as rain than snow in the cold season in many parts of the central and eastern United States (high confidence). (Ch. 7)
- Substantial reductions in western U.S. winter and spring snowpack are projected as the climate warms. Earlier spring melt and reduced snow water equivalent have been formally attributed to human-induced warming (high confidence) and will very likely be exacerbated as the climate continues to warm (very high confidence). Under higher scenarios, and assuming no change to current water resources management, chronic, long-duration hydrological drought is increasingly possible by the end of this century (very high confidence). (Ch. 8)
- The human effect on recent major U.S. droughts is complicated. Little evidence is found for a human influence on observed precipitation deficits, but much evidence is found for a human influence on surface soil moisture deficits due to increased evapotranspiration caused by higher temperatures. (High confidence) (Ch. 8)
- The incidence of large forest fires in the western United States and Alaska has increased since the early 1980s (high confidence) and is projected to further increase in those regions as the climate warms, with profound changes to certain ecosystems (medium confidence). (Ch. 8)
- Both physics and numerical modeling simulations generally indicate an increase in tropical cyclone intensity in a warmer world, and the models generally show an increase in the number of very intense tropical cyclones. For Atlantic and eastern North Pacific hurricanes and western North Pacific typhoons, increases are projected in precipitation rates (high confidence) and intensity (medium confidence). The frequency of the most intense of these storms is projected to increase in the Atlantic and western North Pacific (low confidence) and in the eastern North Pacific (medium confidence). (Ch. 9)
Oceans Are Rising, Warming, and Becoming More Acidic
Oceans occupy two-thirds of the planet’s surface and host unique ecosystems and species, including those important for global commercial and subsistence fishing. Understanding climate impacts on the ocean and the ocean’s feedbacks to the climate system is critical for a comprehensive understanding of current and future changes in climate.
Global Ocean Heat
- Ocean heat content has increased at all depths since the 1960s and surface waters have warmed by about 1.3° ± 0.1°F (0.7° ± 0.08°C) per century globally since 1900 to 2016. Under higher scenarios, a global increase in average sea surface temperature of 4.9° ± 1.3°F (2.7° ± 0.7°C) is projected by 2100. (Very high confidence). (Ch. 13)
Global and Regional Sea Level Rise
- Human-caused climate change has made a substantial contribution to GMSL rise since 1900 (high confidence), contributing to a rate of rise that is greater than during any preceding century in at least 2,800 years (medium confidence). (Ch. 12; Fig. ES.8)
- Relative to the year 2000, GMSL is very likely to rise by 0.3–0.6 feet (9–18 cm) by 2030, 0.5–1.2 feet (15–38 cm) by 2050, and 1.0–4.3 feet (30–130 cm) by 2100 (very high confidence in lower bounds; medium confidence in upper bounds for 2030 and 2050; low confidence in upper bounds for 2100). Future emissions pathways have little effect on projected GMSL rise in the first half of the century, but significantly affect projections for the second half of the century (high confidence). (Ch. 12)
Figure 8
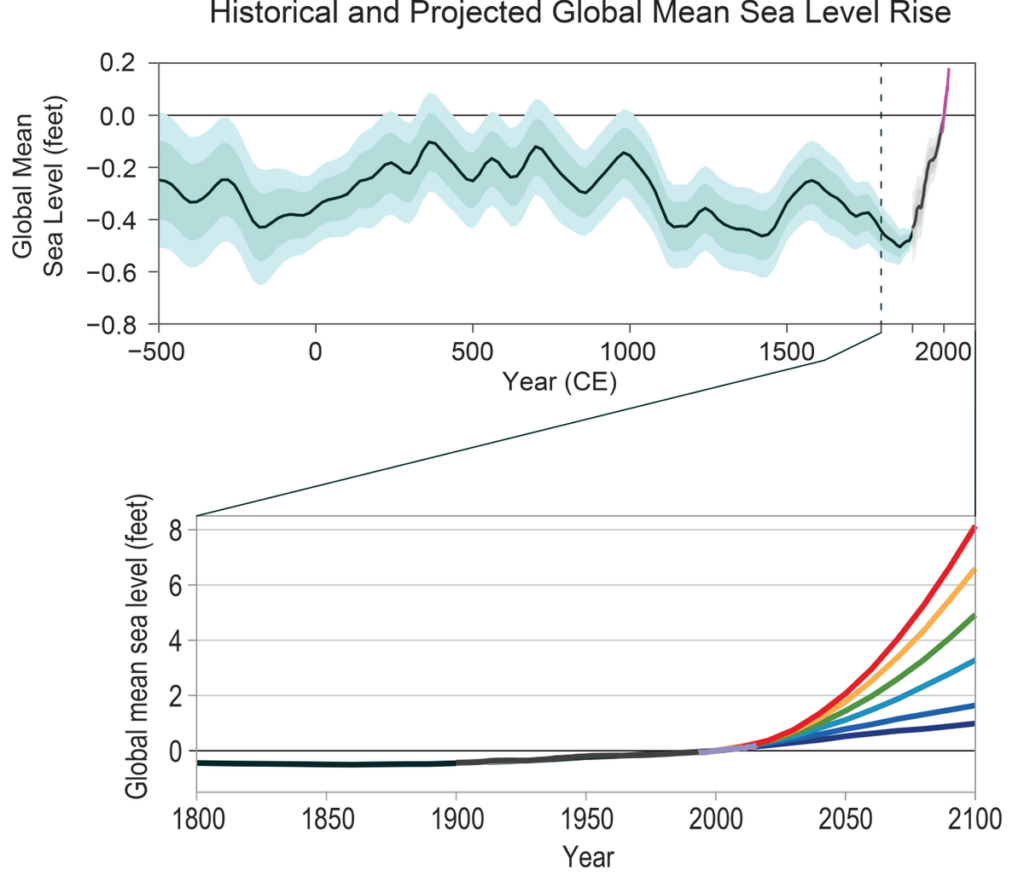
The top panel shows observed and reconstructed mean sea level for the last 2,500 years. The bottom panel shows projected mean sea level for six future scenarios. The six scenarios—spanning a range designed to inform a variety of decision makers—extend from a low scenario, consistent with continuation of the rate of sea level rise over the last quarter century, to an extreme scenario, assuming rapid mass loss from the Antarctic ice sheet. Note that the range on the vertical axis in the bottom graph is approximately ten times greater than in the top graph. Based on Figure 12.2 and 12.4 in Chapter 12. See the main report for more details.
- Emerging science regarding Antarctic ice sheet stability suggests that, for higher scenarios, a GMSL rise exceeding 8 feet (2.4 m) by 2100 is physically possible, although the probability of such an extreme outcome cannot currently be assessed. Regardless of emission pathway, it is extremely likely that GMSL rise will continue beyond 2100 (high confidence). (Ch. 12)
- Relative sea level rise in this century will vary along U.S. coastlines due, in part, to changes in Earth’s gravitational field and rotation from melting of land ice, changes in ocean circulation, and vertical land motion (very high confidence). For almost all future GMSL rise scenarios, relative sea level rise is likely to be greater than the global average in the U.S. Northeast and the western Gulf of Mexico. In intermediate and low GMSL rise scenarios, relative sea level rise is likely to be less than the global average in much of the Pacific Northwest and Alaska. For high GMSL rise scenarios, relative sea level rise is likely to be higher than the global average along all U.S. coastlines outside Alaska. Almost all U.S. coastlines experience more than global mean sea level rise in response to Antarctic ice loss, and thus would be particularly affected under extreme GMSL rise scenarios involving substantial Antarctic mass loss (high confidence). (Ch. 12)
Coastal Flooding
Figure 9
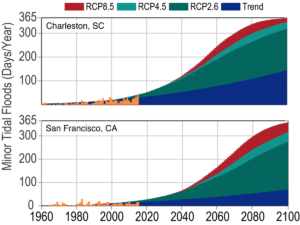 As sea levels have risen, the number of tidal floods each year that cause minor impacts (also called “nuisance floods”) have increased 5- to 10-fold since the 1960s in several U.S. coastal cities (very high confidence). Rates of increase are accelerating in over 25 Atlantic and Gulf Coast cities (very high confidence). Tidal flooding will continue increasing in depth, frequency, and extent this century (very high confidence). (Ch. 12)
- Assuming storm characteristics do not change, sea level rise will increase the frequency and extent of extreme flooding associated with coastal storms, such as hurricanes and nor’easters (very high confidence). A projected increase in the intensity of hurricanes in the North Atlantic (medium confidence) could increase the probability of extreme flooding along most of the U.S. Atlantic and Gulf Coast states beyond what would be projected based solely on relative sea level rise. However, there is low confidence in the projected increase in frequency of intense Atlantic hurricanes, and the associated flood risk amplification, and flood effects could be offset or amplified by such factors, such as changes in overall storm frequency or tracks. (Ch.12; Fig. ES. 9)
Global Ocean Circulation
- The potential slowing of the Atlantic meridional overturning circulation (AMOC; of which the Gulf Stream is one component)—as a result of increasing ocean heat content and freshwater-driven buoyancy changes—could have dramatic climate feedbacks as the ocean absorbs less heat and CO2 from the atmosphere. This slowing would also affect the climates of North America and Europe. Any slowing documented to date cannot be directly tied to human-caused forcing, primarily due to lack of adequate observational data and to challenges in modeling ocean circulation changes. Under a higher scenario (RCP8.5), models show that the AMOC weakens over the 21st century (low confidence). (Ch. 13)
Global and Regional Ocean Acidification
- Higher-latitude systems typically have a lower buffering capacity against changing acidity, exhibiting seasonally corrosive conditions sooner than low-latitude systems. The rate of acidification is unparalleled in at least the past 66 million years (medium confidence). Under the higher scenario (RCP8.5), the global average surface ocean acidity is projected to increase by 100% to 150% (high confidence). (Ch. 13)
- Acidification is regionally greater than the global average along U.S. coastal systems as a result of upwelling (e.g., in the Pacific Northwest) (high confidence), changes in freshwater inputs (e.g., in the Gulf of Maine) (medium confidence), and nutrient input (e.g., in urbanized estuaries) (high confidence). (Ch. 13)
Ocean Oxygen
- Increasing sea surface temperatures, rising sea levels, and changing patterns of precipitation, winds, nutrients, and ocean circulation are contributing to overall declining oxygen concentrations at intermediate depths in various ocean locations and in many coastal areas. Over the last half century, major oxygen losses have occurred in inland seas, estuaries, and in the coastal and open ocean (high confidence). Ocean oxygen levels are projected to decrease by as much as 3.5% under the higher scenario (RCP8.5) by 2100 relative to preindustrial values (high confidence). (Ch. 13)
Climate Change in Alaska and across the Arctic Continues to Outpace Global Climate Change
Residents of Alaska are on the front lines of climate change. Crumbling buildings, roads, and bridges and eroding shorelines are commonplace. Accelerated melting of multiyear sea ice cover, mass loss from the Greenland Ice Sheet, reduced snow cover, and permafrost thawing are stark examples of the rapid changes occurring in the Arctic. Furthermore, because elements of the climate system are interconnected (see Box ES.1), changes in the Arctic influence climate conditions outside the Arctic.
Arctic Temperature Increases
- Rising Alaskan permafrost temperatures are causing permafrost to thaw and become more discontinuous; this process releases additional carbon dioxide and methane resulting in additional warming (high confidence). The overall magnitude of the permafrost-carbon feedback is uncertain (Ch. 2); however, it is clear that these emissions have the potential to compromise the ability to limit global temperature increases. (Ch. 11)
- Atmospheric circulation patterns connect the climates of the Arctic and the contiguous United States. Evidenced by recent record warm temperatures in the Arctic and emerging science, the midlatitude circulation has influenced observed arctic temperatures and sea ice (high confidence). However, confidence is low regarding whether or by what mechanisms observed arctic warming may have influenced the midlatitude circulation and weather patterns over the continental United States. The influence of arctic changes on U.S. weather over the coming decades remains an open question with the potential for significant impact. (Ch. 11)
Arctic Land Ice Loss
- Arctic land ice loss observed in the last three decades continues, in some cases accelerating (very high confidence). It is virtually certain that Alaska glaciers have lost mass over the last 50 years, with each year since 1984 showing an annual average ice mass less than the previous year. Over the satellite record, average ice mass loss from Greenland was −269 Gt per year between April 2002 and April 2016, accelerating in recent years (high confidence). (Ch. 11)
Arctic Sea Ice Loss
- Arctic sea ice loss is expected to continue through the 21st century, very likely resulting in nearly sea ice-free late summers by the 2040s (very high confidence). (Ch. 11)
- It is very likely that human activities have contributed to observed arctic surface temperature warming, sea ice loss, glacier mass loss, and northern hemisphere snow extent decline (high confidence). (Ch. 11)
Figure 10
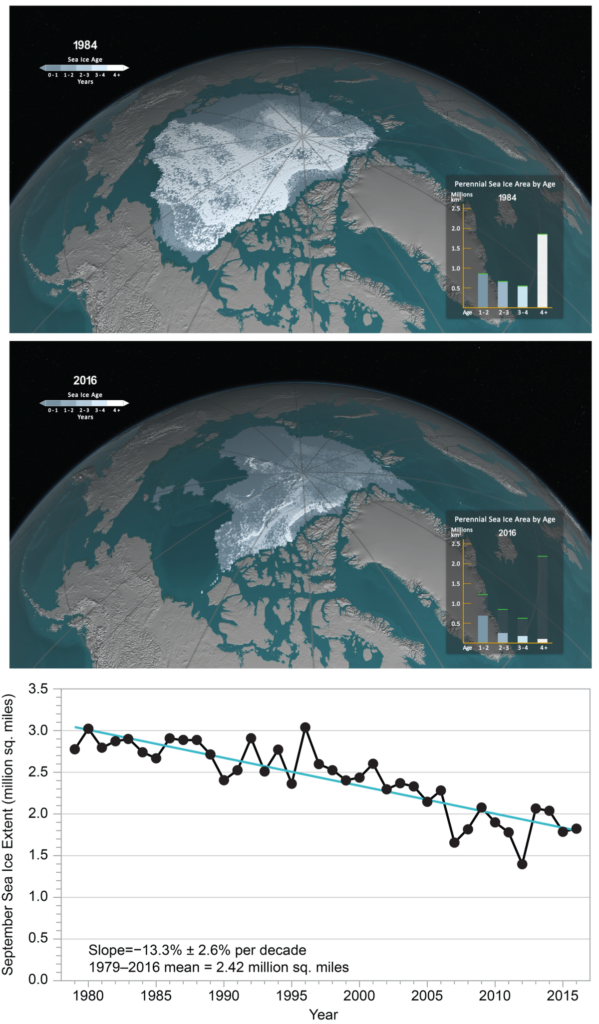
September sea ice extent and age shown for (top) 1984 and (middle) 2016, illustrating significant reductions in sea ice extent and age (thickness). The bar graph in the lower right of each panel illustrates the sea ice area (unit: million km2) covered within each age category (> 1 year), and the green bars represent the maximum extent for each age range during the record. The year 1984 is representative of September sea ice characteristics during the 1980s. The years 1984 and 2016 are selected as endpoints in the time series; a movie of the complete time series is available at http://svs.gsfc.nasa.gov/cgi-bin/details.cgi?aid=4489. (bottom) The satellite-era arctic sea ice areal extent trend from 1979 to 2016 for September (unit: million mi2). From Figure 11.1 in Chapter 11.
Limiting Globally Averaged Warming to 2°C (3.6°F) Will Require Major Reductions in Emissions
Human activities are now the dominant cause of the observed trends in climate. For that reason, future climate projections are based on scenarios of how human activities will continue to affect the climate over the remainder of this century and beyond (see Sidebar: Scenarios Used in this Assessment). There remains significant uncertainty about future emissions due to changing economic, political, and demographic factors. For that reason, this report quantifies possible climate changes for a broad set of plausible future scenarios through the end of the century. (Ch. 2, 4, 10, 14)
- Global mean atmospheric carbon dioxide (CO2) concentration has now passed 400 ppm, a level that last occurred about 3 million years ago, when global average temperature and sea level were significantly higher than today (high confidence). Continued growth in CO2 emissions over this century and beyond would lead to an atmospheric concentration not experienced in tens of millions of years (medium confidence). The present-day emissions rate of nearly 10 GtC per year suggests that there is no climate analog for this century any time in at least the last 50 million years (medium confidence). (Ch. 4)
- Warming and associated climate effects from CO2 emissions persist for decades to millennia. In the near-term, changes in climate are determined by past and present greenhouse gas emissions modified by natural variability. Reducing net emissions of CO2 is necessary to limit near-term climate change and long-term warming. Other greenhouse gases (e.g., methane) and black carbon aerosols exert stronger warming effects than CO2 on a per ton basis, but they do not persist as long in the atmosphere (Ch. 2); therefore, mitigation of non-CO2 species contributes substantially to near-term cooling benefits but cannot be relied upon for ultimate stabilization goals. (Very high confidence) (Ch. 14)
- Stabilizing global mean temperature to less than 3.6°F (2°C) above preindustrial levels requires substantial reductions in net global CO2 emissions prior to 2040 relative to present-day values before 2040 and likely requires net emissions to become zero or possibly negative later in the century. After accounting for the temperature effects of non-CO2 species, cumulative global CO2 emissions must stay below about 800 GtC in order to provide a two-thirds likelihood of preventing 3.6°F (2°C) of warming. Given estimated cumulative emissions since 1870, no more than approximately 230 GtC may be emitted in the future in order to remain under this temperature limit. Assuming global emissions are equal to or greater than those consistent with the RCP4.5 scenario, this cumulative carbon threshold would be exceeded in approximately two decades. (Ch. 14)
- Achieving global greenhouse gas emissions reductions before 2030 consistent with targets and actions announced by governments in the lead up to the 2015 Paris climate conference would hold open the possibility of meeting the long-term temperature goal of limiting global warming to 3.6°F (2°C) above preindustrial levels, whereas there would be virtually no chance if net global emissions followed a pathway well above those implied by country announcements. Actions in the announcements are, by themselves, insufficient to meet a 3.6°F (2°C) goal; the likelihood of achieving that depends strongly on the magnitude of global emissions reductions after 2030. (High confidence) (Ch. 14)
- Climate intervention or geoengineering strategies such as solar radiation management are measures that attempt to limit or reduce global temperature increases. Further assessments of the technical feasibilities, costs, risks, co-benefits, and governance challenges of climate intervention or geoengineering strategies, which are as yet unproven at scale, are a necessary step before judgments about the benefits and risks of these approaches can be made with high confidence. (High confidence) (Ch. 14)
- In recent decades, land-use and land-cover changes have turned the terrestrial biosphere (soil and plants) into a net “sink” for carbon (drawing down carbon from the atmosphere), and this sink has steadily increased since 1980 (high confidence). Because of the uncertainty in the trajectory of land cover, the possibility of the land becoming a net carbon source cannot be excluded (very high confidence). (Ch. 10)
There is a Significant Possibility for Unanticipated Changes
Humanity’s effect on the Earth system, through the large-scale combustion of fossil fuels and widespread deforestation and the resulting release of carbon dioxide (CO2) into the atmosphere, as well as through emissions of other greenhouse gases and radiatively active substances from human activities, is unprecedented. There is significant potential for humanity’s effect on the planet to result in unanticipated surprises and a broad consensus that the further and faster the Earth system is pushed towards warming, the greater the risk of such surprises.
There are at least two types of potential surprises: compound events, where multiple extreme climate events occur simultaneously or sequentially (creating greater overall impact), and critical threshold or tipping point events, where some threshold is crossed in the climate system (that leads to large impacts). The probability of such surprises—some of which may be abrupt and/or irreversible—as well as other more predictable but difficult-to-manage impacts, increases as the influence of human activities on the climate system increases. (Ch. 15)
- Positive feedbacks (self-reinforcing cycles) within the climate system have the potential to accelerate human-induced climate change and even shift the Earth’s climate system, in part or in whole, into new states that are very different from those experienced in the recent past (for example, ones with greatly diminished ice sheets or different large-scale patterns of atmosphere or ocean circulation). Some feedbacks and potential state shifts can be modeled and quantified; others can be modeled or identified but not quantified; and some are probably still unknown. (Very high confidence in the potential for state shifts and in the incompleteness of knowledge about feedbacks and potential state shifts). (Ch. 15)
- The physical and socioeconomic impacts of compound extreme events (such as simultaneous heat and drought, wildfires associated with hot and dry conditions, or flooding associated with high precipitation on top of snow or waterlogged ground) can be greater than the sum of the parts (very high confidence). Few analyses consider the spatial or temporal correlation between extreme events. (Ch. 15)
- While climate models incorporate important climate processes that can be well quantified, they do not include all of the processes that can contribute to feedbacks (Ch. 2), compound extreme events, and abrupt and/or irreversible changes. For this reason, future changes outside the range projected by climate models cannot be ruled out (very high confidence). Moreover, the systematic tendency of climate models to underestimate temperature change during warm paleoclimates suggests that climate models are more likely to underestimate than to overestimate the amount of long-term future change (medium confidence). (Ch. 15)