by Daniel Brouse
When most people think about greenhouse gas emissions, they picture sprawling cities, crowded highways, and millions of people flipping on lights and air conditioners. It’s no surprise, then, that states like California, Texas, Florida, and New York usually dominate lists of greenhouse gas emissions. But those rankings tell only part of the story.
What if the question isn’t simply “Which states emit the most greenhouse gases?” What if it’s “Which states are most responsible for producing the fossil fuels that drive climate change?”
The answer looks dramatically different.
Beyond Smokestacks and Tailpipes
Traditional greenhouse gas inventories are based on territorial emissions—the emissions that physically occur within a state’s borders. That includes electricity generation, transportation, manufacturing, agriculture, and buildings.
This accounting system is useful, but it overlooks much of the climate impact associated with fossil fuel production.
Before a gallon of gasoline reaches your car or natural gas heats your home, fossil fuels must be:
- explored,
- extracted,
- processed,
- transported,
- refined,
- and stored.
Each of these steps releases greenhouse gases. Oil wells leak methane. Coal mines vent methane. Natural gas fields flare excess gas. Refineries consume enormous amounts of energy. LNG export terminals require massive refrigeration systems. Petrochemical plants emit carbon dioxide while transforming hydrocarbons into fuels and plastics.
These emissions are real. Yet many are only partially reflected—or entirely absent—from conventional state comparisons.
Introducing the Composite Climate Responsibility Index
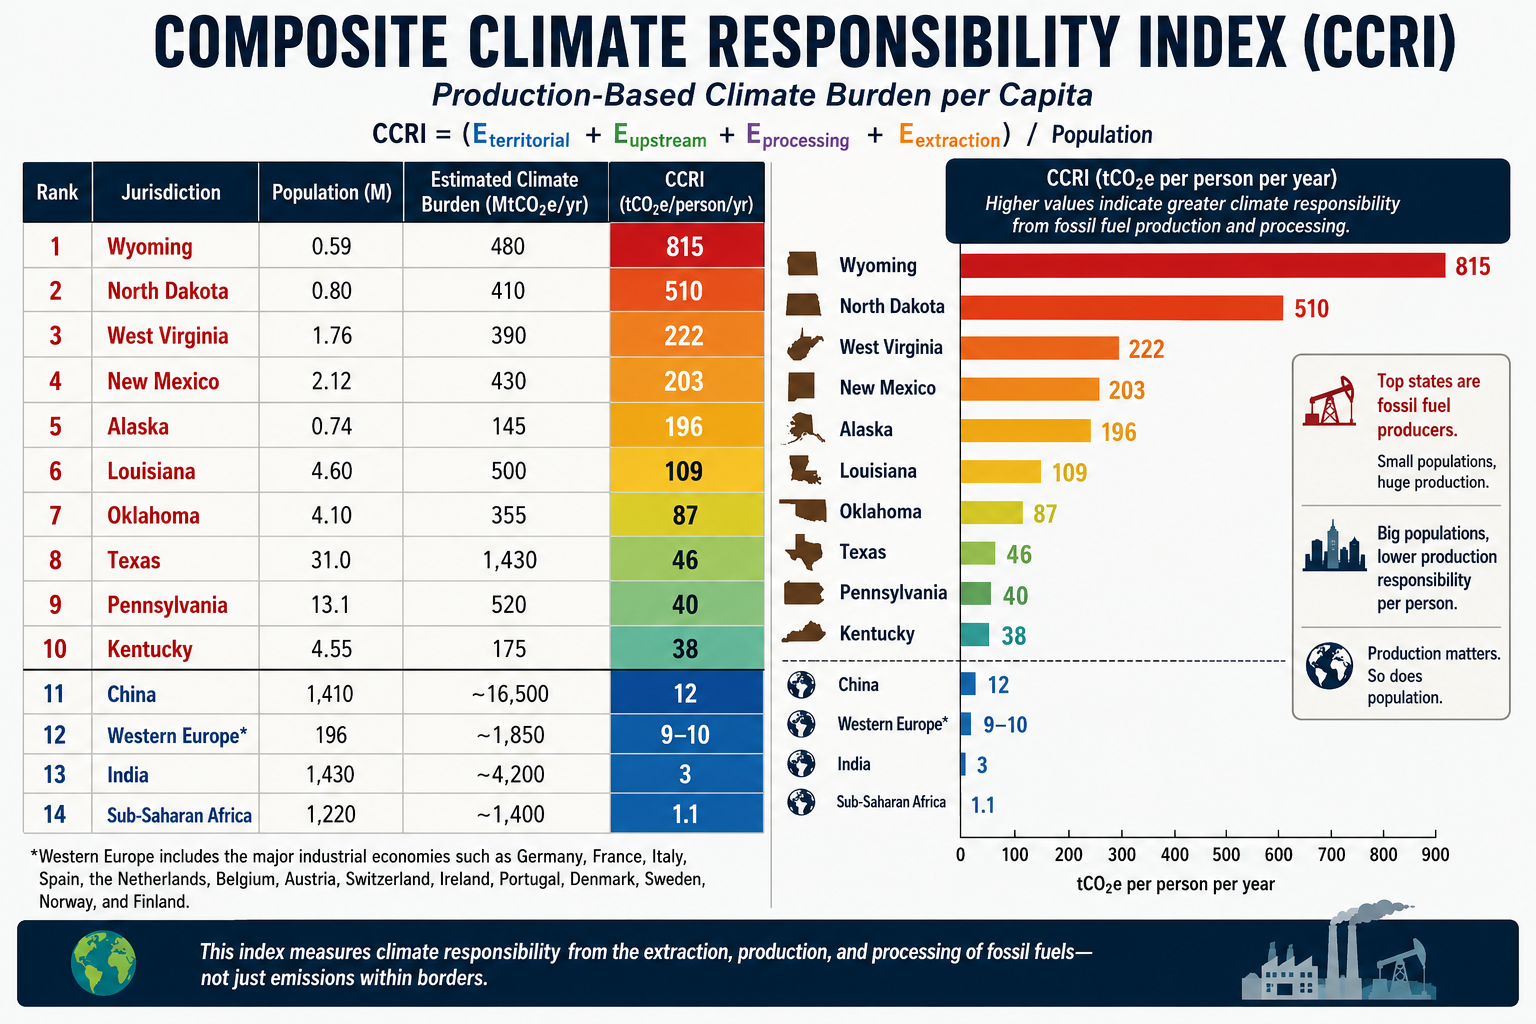
To capture the full climate burden of fossil fuel production, I developed the Composite Climate Responsibility Index (CCRI).
Rather than looking only at emissions released within a state’s borders, CCRI combines four major components:
- Territorial emissions – direct greenhouse gas emissions occurring within the state.
- Upstream emissions – methane leakage, venting, flaring, and other fugitive releases.
- Processing emissions – petroleum refining, LNG facilities, natural gas processing, and petrochemical manufacturing.
- Extraction emissions – emissions associated with coal mining, oil production, drilling, hydraulic fracturing, and natural gas extraction.
The combined total is then divided by the state’s population to produce a per-capita measure of climate responsibility.
This approach shifts the focus from where emissions occur to where the fossil fuel system originates.
A Completely Different Ranking
Applying this framework produces a ranking that bears little resemblance to traditional greenhouse gas inventories.
Instead of being dominated by the largest population centers, the states with the highest per-capita climate responsibility are overwhelmingly those that produce fossil fuels.
Top Ten States by Composite Climate Responsibility
- Wyoming
- North Dakota
- West Virginia
- New Mexico
- Louisiana
- Alaska
- Oklahoma
- Texas
- Pennsylvania
- Kentucky
Notice who’s missing.
California, Florida, New York, New Jersey, Massachusetts, and Washington—all states commonly associated with high emissions because of their large populations—drop dramatically in the rankings.
Instead, relatively small states become climate heavyweights because they extract, refine, process, or export enormous quantities of fossil fuels.
Wyoming: A Climate Giant with Half a Million People
Wyoming is home to fewer than 600,000 residents, yet it produces more coal than any other state and remains a major producer of natural gas.
Under conventional accounting, Wyoming appears to have modest total emissions simply because so few people live there.
But when coal mining, methane releases, and extraction activities are included, Wyoming’s per-capita climate burden becomes extraordinary.
Its climate footprint is measured not by how many people live there, but by how much carbon leaves the state embedded in coal, oil, and natural gas.
Texas: The Carbon Superpower
Texas remains in a category of its own.
No other state combines:
- the nation’s largest oil production,
- the largest natural gas production,
- the largest refining capacity,
- one of the world’s largest petrochemical industries,
- extensive LNG export facilities,
- and the highest total greenhouse gas emissions.
Its enormous population moderates its per-capita ranking, but Texas still lands in the top ten because the scale of its fossil fuel industry is unmatched.
In absolute terms, Texas likely contributes more lifecycle greenhouse gas emissions than any other U.S. state.
Methane Changes Everything
One of the largest differences between CCRI and conventional inventories is methane.
Natural gas has often been marketed as a “cleaner” fossil fuel because it emits less carbon dioxide when burned than coal.
However, methane itself is a potent greenhouse gas. Even relatively small leaks during drilling, gathering, processing, and transportation can substantially increase the climate impact of natural gas production.
States with large oil and gas industries—such as New Mexico, North Dakota, Pennsylvania, Oklahoma, and Louisiana—move sharply upward once methane leakage, venting, and flaring are included.
Ignoring upstream methane is like calculating the cost of owning a car while pretending gasoline is free.
Production Matters
The key insight of CCRI is that climate responsibility does not end where emissions occur.
A barrel of oil extracted in North Dakota may be refined in Louisiana, transported through Texas, shipped overseas, and ultimately burned in Europe or Asia.
Each step adds greenhouse gases.
Traditional inventories divide these emissions among multiple jurisdictions, often obscuring the role of the states that initiated the fossil fuel supply chain.
CCRI reconnects those pieces.
It recognizes that extraction, processing, and upstream emissions are not incidental—they are essential components of fossil fuel production.
A More Complete Picture
The Composite Climate Responsibility Index is not intended to replace traditional greenhouse gas inventories. Those inventories remain indispensable for tracking progress toward emissions reduction within individual states.
Instead, CCRI complements existing accounting by expanding the system boundary to include the activities that make fossil fuel consumption possible.
This broader perspective helps answer questions that territorial inventories cannot:
- Which states produce the largest share of climate-forcing emissions?
- Where would methane reductions have the greatest impact?
- Which regions contribute disproportionately to fossil fuel supply?
- How should climate responsibility be allocated in a production-based economy?
By incorporating extraction, processing, upstream methane, and direct emissions into a single per-capita metric, CCRI reveals a reality that traditional rankings often miss: the states producing the fuels that power the global economy are frequently those carrying the largest climate responsibility—even when their populations are relatively small.
In the coming years, as policymakers increasingly focus on lifecycle emissions, methane mitigation, and supply-side climate policy, production-based metrics such as CCRI may prove to be as important as the territorial inventories that have guided climate reporting for decades.
Global Comparison
A comparison becomes especially revealing when the same production-based accounting is applied to both U.S. states and world regions. Instead of asking who burns the carbon, the CCRI asks who produces and enables the fossil carbon economy.
The formula remains:CCRI=PEterritorial+Eupstream+Eprocessing+Eextraction
Using this methodology, the comparison changes dramatically from conventional per-capita emissions rankings.
Estimated Composite Climate Responsibility
| Rank | Jurisdiction | Population (M) | Estimated Climate Burden (MtCO₂e/yr) | CCRI (tCO₂e/person/yr) |
|---|---|---|---|---|
| 1 | Wyoming | 0.59 | 480 | 815 |
| 2 | North Dakota | 0.80 | 410 | 510 |
| 3 | West Virginia | 1.76 | 390 | 222 |
| 4 | New Mexico | 2.12 | 430 | 203 |
| 5 | Alaska | 0.74 | 145 | 196 |
| 6 | Louisiana | 4.60 | 500 | 109 |
| 7 | Oklahoma | 4.10 | 355 | 87 |
| 8 | Texas | 31.0 | 1,430 | 46 |
| 9 | Pennsylvania | 13.1 | 520 | 40 |
| 10 | Kentucky | 4.55 | 175 | 38 |
| 11 | China | 1,410 | ~16,500 | ≈12 |
| 12 | Western Europe* | 196 | ~1,850 | ≈9–10 |
| 13 | India | 1,430 | ~4,200 | ≈3 |
| 14 | Sub-Saharan Africa | 1,220 | ~1,400 | ≈1.1 |
*Western Europe includes the major industrial economies such as Germany, France, Italy, Spain, the Netherlands, Belgium, Austria, Switzerland, Ireland, Portugal, Denmark, Sweden, Norway, and Finland.
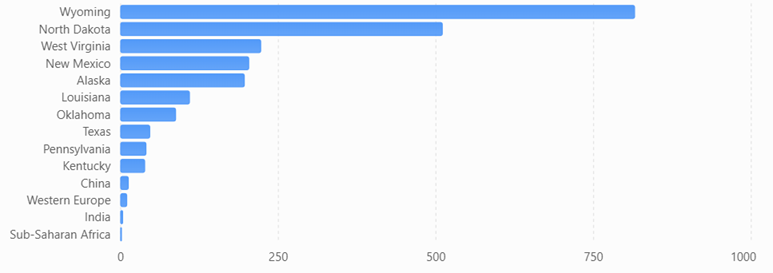
Composite Climate Responsibility Index (CCRI)
Estimated production-based climate burden per capita using territorial emissions, extraction, processing, and upstream emissions.
What the comparison shows
Several important conclusions emerge.
First, fossil fuel production is far more geographically concentrated than fossil fuel consumption. Wyoming’s estimated production-based climate burden is roughly 68 times higher per resident than China’s, despite China’s position as the world’s largest emitter under conventional territorial accounting. The difference reflects Wyoming’s role as a major coal and natural gas producer serving markets far beyond its borders.
Second, China’s ranking changes substantially under the CCRI framework. China remains a major contributor because of its large coal industry, extensive refining capacity, and industrial base, but its enormous population reduces its per-capita production burden to around 12 tCO₂e per person, well below several U.S. fossil-fuel-producing states.
Third, Western Europe falls even lower. While it retains significant refining and industrial capacity, domestic fossil fuel extraction has declined over several decades. Much of its energy is imported, so a production-based metric attributes a smaller share of upstream responsibility than a consumption-based metric would.
Fourth, India and Sub-Saharan Africa rank near the bottom. Although both regions have growing energy demand, their per-capita fossil fuel production and associated upstream emissions remain comparatively low. Their climate burden is driven primarily by domestic energy use rather than large-scale extraction and export industries.
A different perspective on climate responsibility
Traditional greenhouse gas inventories emphasize where emissions occur. The CCRI instead emphasizes where the fossil fuel supply chain begins. These are complementary perspectives, each useful for different policy questions.
- Territorial inventories help governments manage emissions within their borders.
- Consumption-based inventories assign responsibility to the end user of goods and energy.
- The CCRI highlights the jurisdictions that extract, process, and prepare fossil fuels for global consumption.
Together, these three accounting systems provide a more complete understanding of climate responsibility. The comparison also illustrates that some of the world’s highest production-based climate burdens are found not in entire countries, but in a handful of resource-rich U.S. states whose fossil fuel industries serve national and international markets.