NASA reports that North America weather patterns for July 2014 were upside down:
If you live in the northern hemisphere, the past few weeks have been strange. In places where it should be seasonably hot—the eastern and southern United States and western Europe—it’s just been warm. In places where weather is usually mild in the summer—northern Europe, the Pacific coast of North America—it has been ridiculously hot.
Records for high temperatures (mid-30s°C, mid-90s°F) were approached or broken in Latvia, Poland, Belarus, Estonia, Lithuania, and Sweden in late July and early August. Searing temperatures also dried out forests and fueled wildfires in Siberia; in the U.S. states of Oregon, Washington, and California; in the Canadian provinces of British Columbia, Alberta, and Northwest Territories; and even in Sweden. At the same time, cool air moved from high northern latitudes into much of the U.S., setting record-low daytime and nighttime temperatures as far south as Florida and Georgia. Temperatures dropped to the winter-like levels in the mountains of Tennessee.
The maps on this page shows land surface temperature (LST) anomalies for July 27–August 3, 2014. They were built from data collected by the Moderate Resolution Imaging Spectroradiometer (MODIS) on NASA’s Aqua satellite, and the 2014 data is compared to the average for the same week as observed from 2005–2013. You can visit NASA Earth Observations for a view of temperature anomalies for the entire month of July.

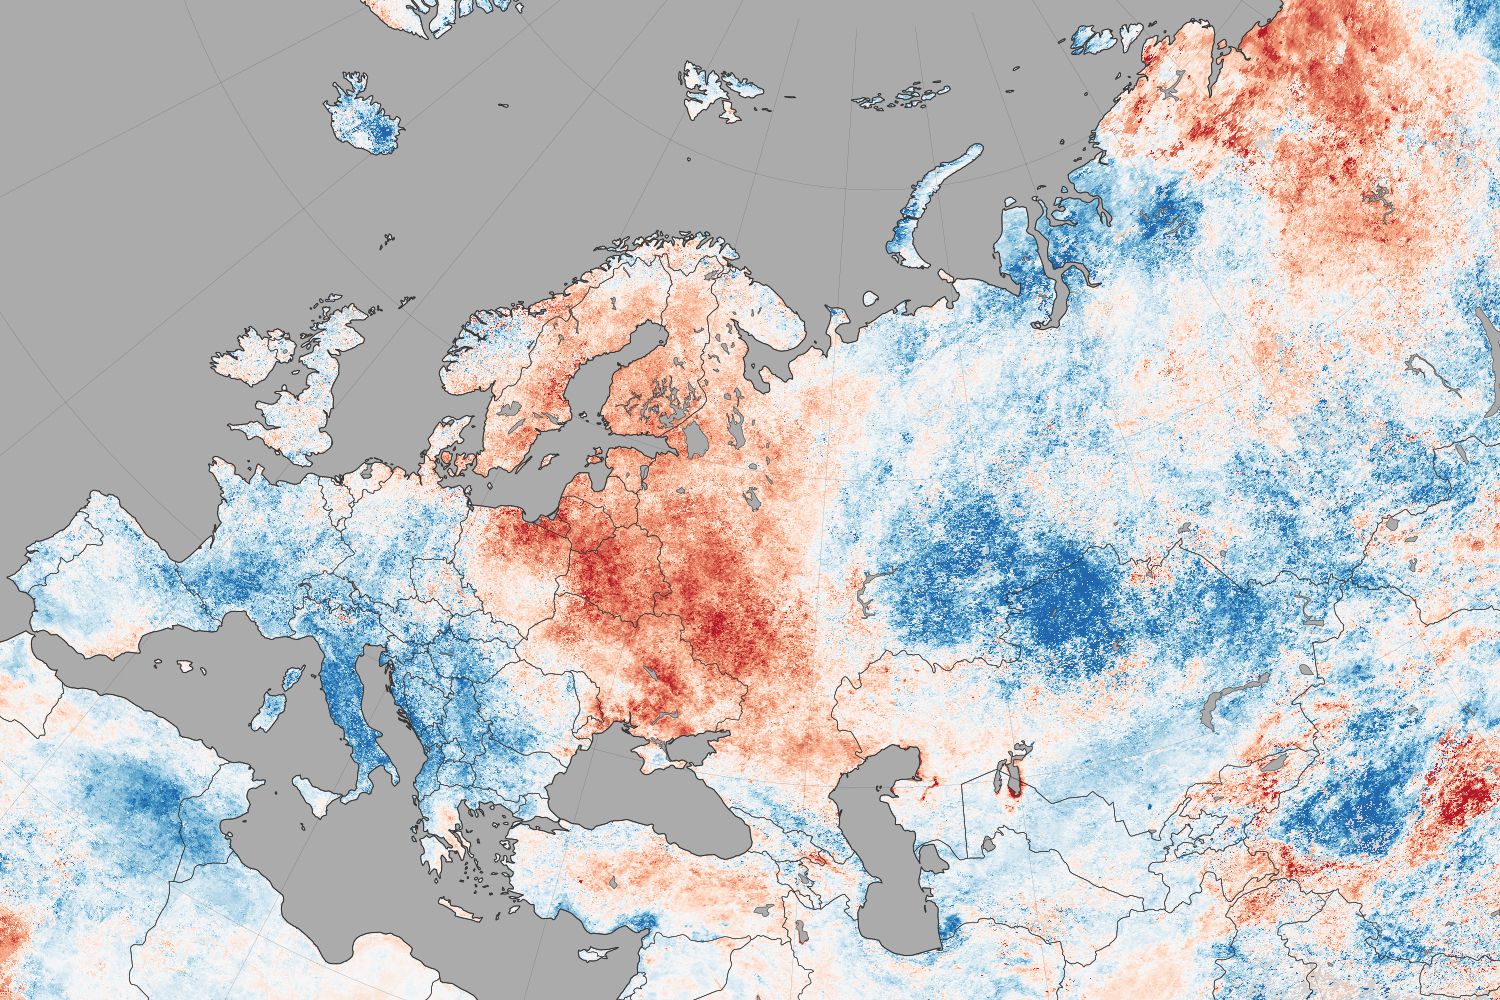
Observed by satellites uniformly across the entire globe, land surface temperatures are a measure of the amount of infrared energy (thermal radiance) emitted by Earth’s surface as it is heated by daylight and cooled in the dark of night. LSTs are sometimes referred to as land “skin” temperatures, and indeed they are a reflection of how hot a surface would feel to the touch. LST anomalies, as shown on this page, are not absolute temperatures; instead, they show how much temperatures were above or below the average. The darkest reds show areas that were as much as 10°C (20°F) above the norm; blues show areas that were below normal; light gray depicts areas with incomplete data (often due to cloud cover, such as in the area of the Indian monsoon); dark gray is ocean.
Meteorologists saw several possible and related causes for the heat waves and cooling patterns. High pressure systems over Scandinavia and northern Russia, as well as over the Pacific Northwest of North America, allowed stable air masses to build up heat domes and “block” incoming fronts that could bring changes in winds, precipitation, and temperatures. These blocking patterns worked together with unusual bends and meanders in the jet stream, which took on a see-sawing north-south pattern over the northern hemisphere. The jet moved air northward over the Pacific Ocean and warmed northwest Canada and the west coast of the U.S.; it dove south from cooler areas of Canada into the central and eastern U.S.; and it drove warm Atlantic air north into northern Europe. The jet took a similar north-south zig-zag in western and eastern Siberia. This pattern is more common in winter than in summer.