The U.S. Economy, Household Costs, Federal Debt, and America’s Global Economic Position
Comparative assessment: January 1, 2025 – October 12, 2026
1.Executive Summary
Since Donald Trump returned to office in January 2025, the United States has experienced a deteriorating mix of economic pressures: inflation has reaccelerated, long-term Treasury yields have risen sharply, mortgage rates remain near 7%, job growth has slowed, the trade deficit has widened, and household expenses continue to strain purchasing power. At the same time, federal deficits and debt-service costs remain exceptionally high, while the administration’s tariff strategy has generated legal and economic uncertainty. The boom in artificial intelligence (AI) and data-center construction has become an important source of capital spending, but it also drives demand for imported chips, servers, and other specialized equipment.
The administration emphasizes tax reductions, private-sector job creation, technology investment, and its claim that underlying inflation and real wages compare favorably with the Biden years. Those claims do not erase the impact of cumulative price increases, rising borrowing costs, and the deterioration in several key measures since the start of 2025. Taken together, the indicators examined here show an economy under significant pressure and raise serious questions about the results of Trumpenomics for ordinary households, productive investment, fiscal stability, and U.S. economic leadership.
2.1. Economic Performance Under Trump
GDP Growth: Promises Versus Results
An assessment of Trump’s economic record spans two distinct periods: his first term (2017–2021) and his second term (2025–present). From 2017 through 2019, before the pandemic, U.S. GDP grew at an average annual rate of approximately 2.5%. That was broadly comparable to the 2.3% average in the final three years of the Obama administration, but it fell short of Trump’s promise of sustained annual growth of 3% to 4%. In 2020, the COVID-19 pandemic caused GDP to contract by approximately 6.5% over his final year.
For the second term, the administration initially projected growth of 5% to 12%, yet the figures cited here put actual growth at roughly 2% annually, trailing the pace recorded during the latter half of the Biden administration. Real GDP growth slowed to 2.1% for 2025, compared with 2.8% in 2024, and the latest quarterly pace cited in this assessment has fallen to 0.7%. The contrast between ambitious growth promises and substantially weaker results is central to evaluating Trumpenomics.
Inflation and Interest Rates
Inflation remained low during much of Trump’s first term, hovering below the Federal Reserve’s 2% target. In the second term, that progress has stalled and reversed. By the end of 2025, year-over-year inflation had reached 2.7%; by autumn 2026, it had accelerated to approximately 3.5%–3.6%. Energy-price shocks have contributed to the renewed pressure, but they do not account for every source of inflation.
Treasury Secretary Scott Bessent’s October 9, 2026, “Trump Tracker” presents a more favorable interpretation, reporting annualized core inflation of 2.5% under Trump compared with 4.7% under Biden, and cumulative real weekly wage growth of 1.5%. Those measures are part of the administration’s case for its economic record. However, the broader household experience is also shaped by headline inflation and the cumulative rise in prices. Even when the rate of inflation slows, the price level generally does not return to where it stood before the increases.
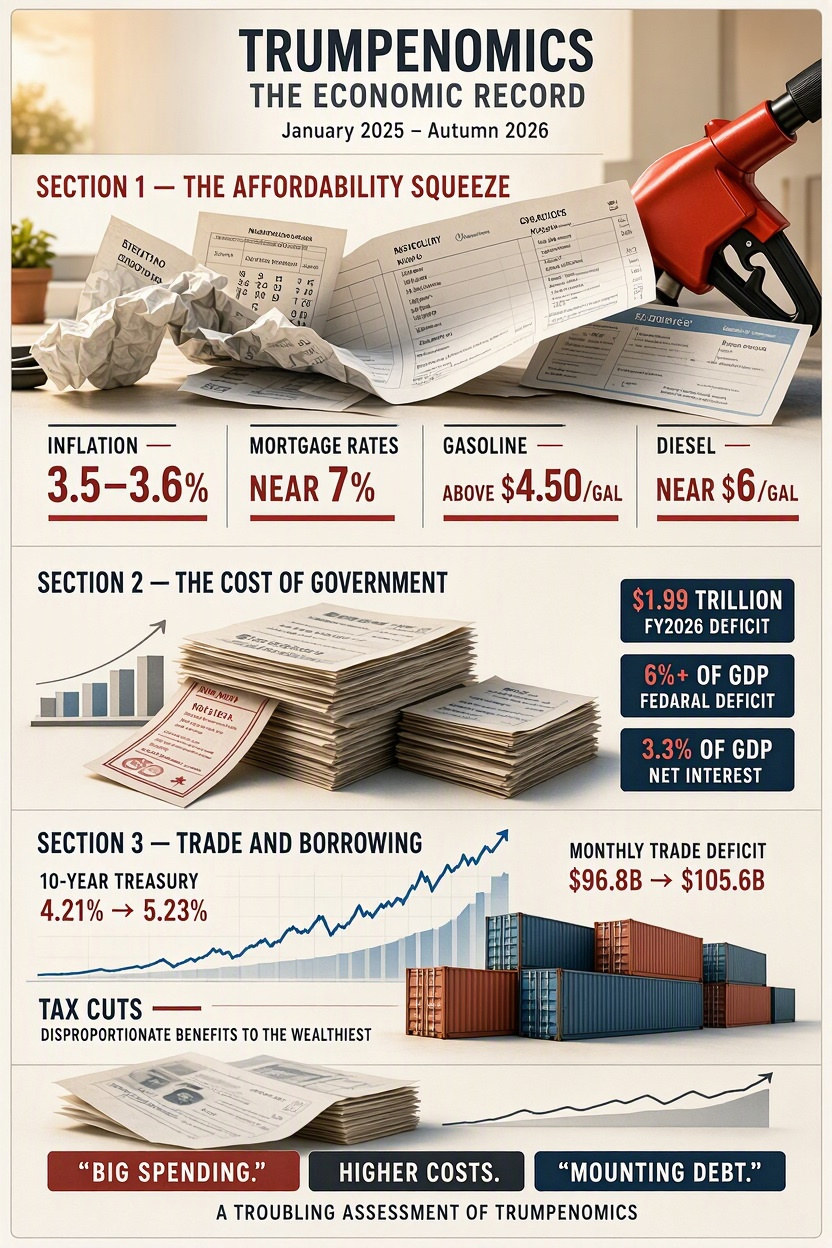
The result is a continuing affordability crisis: groceries, housing, insurance, fuel, and borrowing remain expensive. The national gasoline average cited in this assessment has risen above $4.50 per gallon, while long-term borrowing costs have increased and mortgage rates remain near 7%. These conditions undermine the practical benefits of nominal wage gains for many households.
Labor Market and Employment
During Trump’s first term, the economy added roughly 7 million jobs before the pandemic downturn. In the second term, job creation has slowed sharply. The October 2026 figures cited here put average monthly job growth at approximately 27,000, reflecting a pullback in federal employment, restrictive immigration policies, and uncertainty associated with tariffs. The administration counters that it has added more than 1 million private-sector jobs while reducing the federal workforce by approximately 328,000 positions.
Both figures matter, but the distinction does not change the central concern: total employment growth has weakened considerably. A smaller federal workforce may reduce government payrolls, but it does not by itself demonstrate that the broader economy is creating enough jobs to support a growing labor force or offset the loss of public-sector positions.
3.2. Borrowing Costs: January 1, 2025, Compared with October 2026
The movement in benchmark interest rates reveals a tightening financial environment.
| Metric | January 1, 2025 | October 2026 | Economic significance |
| 10-year Treasury note | About 4.21% | 5.22%–5.24% | Sharp increase, reflecting persistent inflation concerns and rising federal borrowing needs. |
The 10-year Treasury yield has climbed to approximately 5.22%–5.24%, a level described in the underlying analysis as a 19-year high. Long-term yields can rise even when short-term rates fall because investors are pricing in persistent inflation, heavier government borrowing, and uncertainty about the long-run fiscal outlook. Mortgage rates remain structurally close to 7%, worsening affordability for buyers and adding to the cost of housing across the economy.
4.3. Tax Policy, Federal Deficits, and National Debt
Tax Cuts and Distributional Effects
Trump’s first term produced the $3.2 trillion Tax Cuts and Jobs Act, while his second term enacted the One Big Beautiful Bill Act (OBBBA). The administration describes these measures as historic tax cuts for working Americans. The Institute on Taxation and Economic Policy (ITEP), however, finds that the benefits disproportionately favor the wealthiest 1%, with an average tax cut exceeding $70,000 for the top tier. By contrast, the bottom 20% face minor tax increases under the cited analysis because of restrictions on credits.
The distribution of tax benefits is therefore a central measure of the policy’s economic impact. A tax cut’s headline size does not establish that it improves the financial position of most households, especially when the benefits are concentrated among high-income taxpayers and households continue to face rising costs for essential goods and services.
Deficit Growth and Debt-Service Costs
The federal deficit has expanded to approximately 6% of GDP, and the Congressional Budget Office projects that it will approach 7% by 2033. The fiscal-year 2026 deficit is estimated at $1.99 trillion, a 12% increase from the prior year and the largest annual gap since 2021. Net interest payments are consuming approximately 3.3% of U.S. GDP, placing a growing burden on the federal budget.
The national debt continues to compound beyond the $34–$35 trillion range cited in the original analysis, while debt held by the public is approximately 100% of GDP. Long-term projections indicate that, without substantial fiscal changes, publicly held debt could rise to 175% of GDP over the next three decades. As Treasury yields rise, refinancing and new borrowing become more expensive, further increasing interest costs and constraining future budget choices.
5.4. Tariffs, Trade Policy, and Legal Reversals
Trump’s “America First” strategy relies heavily on protectionist tariffs to shield domestic industries, encourage U.S. manufacturing, and reshape international trade. During his first term, he replaced NAFTA with the USMCA and initiated a trade war with China. The second-term tariff program has created additional uncertainty for manufacturers, importers, retailers, and consumers.
Tariffs raise the cost of imported goods and industrial inputs, creating upward pressure on prices and disrupting supply chains. They may benefit some protected domestic producers, but those benefits come with costs to businesses that depend on imported components and to consumers who face higher prices. The resulting uncertainty can also discourage investment when firms cannot reliably predict future input costs or market access.
The administration initially presented tariff revenue as a major source of funding that could offset tax cuts and reduce federal obligations. In fiscal year 2025, customs duties temporarily surged by 250% to approximately $195 billion. Nonpartisan estimates indicated that, if maintained permanently, the tariffs could reduce the cumulative ten-year deficit by $3 trillion.
That strategy encountered a major legal obstacle in early 2026, when the U.S. Supreme Court ruled that the administration had exceeded its authority by using the International Emergency Economic Powers Act (IEEPA) to impose broad global tariffs. The resulting legal reversal undermined the administration’s original revenue projections. The analysis estimates that the loss of the broader tariff authorities created a $200 billion–$250 billion budget hole and caused customs-duty projections to fall by 60%. With narrower mechanisms remaining, the applied tariff rate is estimated at approximately 11.8%.
The tariff burden on households remains substantial. The Tax Foundation estimates cited here put the average household cost of the initial full-scale tariffs at approximately $1,000 in 2025 and the cost under the post-ruling tariff structure at approximately $820 annually. Tariffs have therefore failed to deliver a straightforward path to eliminating the trade deficit or reducing household costs.
6.5. Inflation, Producer Costs, and the Trade Deficit
Consumer and Producer Prices
The Consumer Price Index (CPI) measures changes in the prices paid by consumers, while the Producer Price Index (PPI) tracks changes in prices received by domestic producers. The draft’s comparison shows CPI inflation rising from approximately 2.5% in early 2025 to 3.5%–3.6% by autumn 2026. Producer costs have also risen, driven by industrial-component constraints, grid-modernization expenses, and supply-chain pressures. These increases put pressure on businesses before costs are passed through to households.
Trade Deficit
The monthly trade deficit stood at approximately $96.8 billion at the start of 2025 and has widened to a reported record of $105.6 billion. This outcome runs counter to the administration’s stated goal of using import taxes to eliminate the trade gap. A major factor is the surge in imports of capital goods, including semiconductors and advanced computing equipment needed to build AI infrastructure.
The trade balance reflects more than tariff rates alone. It is shaped by domestic saving and investment, exchange rates, consumer demand, business investment, and the availability of goods from overseas. In this period, the rapid construction of data centers has increased demand for specialized chips, servers, and other technology components that U.S. suppliers cannot immediately provide at the required scale.
7.6. AI, Data Centers, and the Composition of GDP Growth
AI infrastructure is one of the defining features of the second Trump administration’s economic platform. The administration claims to have attracted more than $2.7 trillion in technology and AI investment to preserve U.S. technological dominance. AI and data-center construction have become a major source of capital spending even as broader GDP growth has slowed.
The figures cited here estimate that compute-infrastructure capital expenditure has doubled from its historical baseline and now represents approximately 0.8% of U.S. GDP. Total data-center and technology-infrastructure spending is estimated at approximately 1.5% of GDP. These investments support construction, electrical equipment, cooling, networking, and advanced computing, but they also require large quantities of imported semiconductors and specialized hardware.
This creates an important tension in the headline numbers: AI investment supports measured economic activity, while its imported components widen the trade deficit. The growth of AI infrastructure should not be mistaken for uniformly strong performance across the entire economy. The composition of GDP matters, as do the domestic value added, productivity gains, and long-term returns produced by these investments.
8.7. Household Costs: Fuel, Food, Insurance, and Taxes
Gasoline and Diesel
Regular gasoline was below $3.50 per gallon in early 2025. The national average cited here has since risen by 27.4% over the past year, exceeding $4.50 per gallon. Diesel has moved from below $4 per gallon to nearly $6 nationally, with prices exceeding $8 in parts of California. Disruptions affecting transport through the Strait of Hormuz have intensified pressure on fuel markets and raised costs across freight, agriculture, manufacturing, and household transportation.
Beef and Produce
Food prices reflect years of accumulated increases as well as current supply pressures. Since 2020, beef roasts have risen approximately 73%, steaks 57%, and standard ground beef 52%, with prices continuing to climb through 2026. Fruit and vegetable prices have increased more slowly—approximately 2.2% year over year in the cited data—but remain at historically high levels. Fertilizer, labor, refrigeration, transport, and other input costs continue to affect the price of produce.
Homeowners Insurance and Total Household Taxes
The national annual homeowners-insurance baseline cited for 2025 was approximately $2,912. For older properties, the later average is estimated at $3,086, an increase of roughly 6% in one year. Insurance costs add to the financial burden of homeownership, alongside elevated mortgage rates, maintenance costs, and property taxes.
The tax burden must be evaluated across federal, state, and local levels, including property taxes. The OBBBA’s federal tax changes provide substantial benefits to high-income households under the cited ITEP analysis, while credit restrictions leave the bottom 20% facing minor tax increases. Meanwhile, local property taxes have risen as municipalities seek revenue for infrastructure and public services. Federal tax cuts do not necessarily translate into lower total household taxes when local taxes and other mandatory expenses are rising.
Real Wages and Other Significant Costs
The cited data show real average hourly earnings declining by 0.3% over the past year. That means inflation has outpaced nominal wage gains over the period measured, reducing purchasing power. The administration’s reported 1.5% cumulative increase in real weekly wages uses a different measure and comparison window; it does not eliminate the pressure created by higher accumulated prices.
Other costs are adding to the squeeze. Non-mortgage credit defaults have reached multi-decade highs, and subprime auto-loan delinquencies have risen to 6.9%, exceeding the peak recorded during the 2008 financial crisis according to the figures cited here. High vehicle prices and elevated annual percentage rates (APRs) make financing increasingly expensive. Rent, utilities, medical care, childcare, and revolving consumer debt further constrain household budgets.
9.8. Federal Fiscal Pressure and the Cost of Capital
The U.S. faces a highly constrained fiscal landscape in which large deficits, a growing debt stock, and higher interest rates reinforce one another. Treasury yields have risen as investors price in persistent inflation and the long-term consequences of federal borrowing. Higher yields raise the government’s cost of capital and can also increase financing costs for households and businesses.
The tariff program was presented as a way to generate revenue, offset tax cuts, and reduce national obligations. But the legal reversal of broad tariff authority weakened those projections, while tariffs themselves raised costs for American households and firms. The original fiscal rationale has therefore collided with legal limits, higher consumer costs, and a trade deficit that has continued to widen.
10.9. How the Pressures Interact
The economic pressures are connected rather than isolated. Expanding deficits and defense spending increase Treasury borrowing needs and can push yields higher. Higher yields raise the cost of government debt, mortgages, and business financing. Tariffs and supply-chain disruptions raise input prices, while AI and data-center construction increase imports of specialized computing hardware. A stronger dollar can make imports less expensive but can also make U.S. exports less competitive, while overseas demand for AI hardware can increase import volumes.
Expanding deficits and defense spending → Higher Treasury yields → Higher financing costs
AI and data-center demand → More imported semiconductors and equipment → Wider trade deficit
Tariffs and supply-chain disruption → Higher input costs → Greater consumer-price pressure
Combined effects → Household strain, investment uncertainty, and weaker long-term fiscal flexibility
11.Conclusion: The Economic Record of Trumpenomics
The economic record since January 1, 2025, is marked by renewed inflation pressure, higher long-term Treasury yields, mortgage rates near 7%, sharply slower job creation, a widening trade deficit, and continued increases in essential household expenses. At the same time, tax cuts have disproportionately benefited the wealthiest households under the cited distributional analysis, federal deficits remain above 6% of GDP, and interest payments consume an increasing share of national output.
The administration points to private-sector job gains, AI investment, and favorable measures of core inflation and real weekly wages. Yet those indicators must be considered alongside the full economic picture: cumulative price increases, household fuel and food costs, homeowners insurance, property taxes, credit distress, and the rising cost of borrowing. Announced investment is not the same as broad-based prosperity, and tariff revenue has not eliminated the trade deficit or insulated consumers from higher costs.
The combined evidence presents a troubling assessment of Trumpenomics. The policies have intensified uncertainty across trade and supply chains, left the federal government facing large deficits and growing debt-service costs, and failed to resolve the affordability pressures confronting American households. AI investment offers a significant source of technological and economic opportunity, but its contribution should be measured against its import requirements and the broader economy’s performance—not used to obscure weaknesses elsewhere.
12.Principal Measures Referenced
GDP growth: approximately 2.5% average annual growth in 2017–2019; 2.1% in 2025; latest quarterly pace cited at 0.7%.
Inflation: approximately 2.7% at the end of 2025 and 3.5%–3.6% by autumn 2026; administration-reported annualized core inflation of 2.5%.
Employment: approximately 27,000 average monthly jobs added in the cited October 2026 data; administration-reported 1 million private-sector jobs added and 328,000 federal positions reduced.
Borrowing costs: 10-year Treasury 4.21% to 5.22%–5.24%
Federal finances: fiscal-year 2026 deficit approximately $1.99 trillion; deficit above 6% of GDP; net interest approximately 3.3% of GDP.
Trade: monthly deficit approximately $96.8 billion at the start of 2025 versus a reported $105.6 billion later in 2026.
Household costs: gasoline above $4.50 per gallon; diesel near $6 nationally; substantial cumulative beef-price increases; homeowners insurance rising approximately 6%.
AI infrastructure: compute capex estimated at 0.8% of GDP; broader data-center and technology infrastructure spending estimated at 1.5% of GDP.