An earthquake registering 4.4 Magnitude shook Southern California on St. Patrick’s Day.
Time:
Location: 34.135°N 118.486°W (9km NNW of Westwood, California)
Depth: 9.9km
Nearby Cities
9km (6mi) NNW of Westwood, California
10km (6mi) NW of Beverly Hills, California
12km (7mi) W of Universal City, California
12km (7mi) N of Santa Monica, California
562km (349mi) SSE of Sacramento, California
4.4 California Earthquake
The LA Times reported:
Robert Graves, a seismologist with the U.S. Geological Survey, told reporters that Monday’s earthquake was the most significant shake in this Southern California area since the magnitude 5.5 earthquake in Chino Hills in 2008.
The region where the fault hit has not been seismically active recently, Graves said.
“The location is somewhat surprising. It’s within the Santa Monica Mountains. We have not seen seismicity in it in recent times,” said Caltech seismologist Egill Hauksson.
L.A. Mayor Eric Garcetti confirmed the city had no reports of damage.
“Today’s earthquake is a reminder that every L.A. family must be prepared with food, water and other essentials, as well as a plan,” the mayor said in a statement.
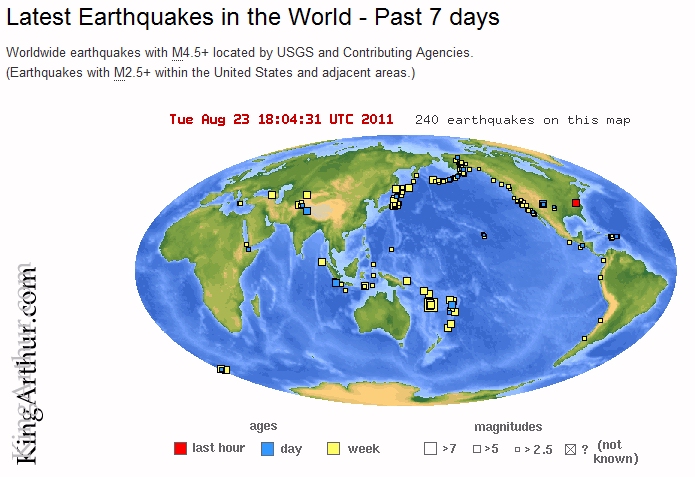
Tuesday, August 23, 2011 at 17:51:03 UTC
Tuesday, August 23, 2011 at 01:51:03 PM at epicenter
Location 37.975°N, 77.969°W
Depth 1 km (~0.6 mile) (poorly constrained)
Region VIRGINIA
Distances
6 km (4 miles) SSE (152°) from Louisa, VA
6 km (4 miles) SW (236°) from Mineral, VA
26 km (16 miles) SE (133°) from Gordonsville, VA
66 km (41 miles) NW (318°) from Richmond, VA
134 km (83 miles) SW (219°) from Washington, DC
Location Uncertainty horizontal +/- 10.9 km (6.8 miles); depth +/- 7.4 km (4.6 miles)
Parameters NST=390, Nph=390, Dmin=57.9 km, Rmss=1.17 sec, Gp= 47°,
M-type=regional moment magnitude (Mw), Version=6
Source
Christchurch EartquakeNASA writes about the religion of earthquakes:
It is a modern human tendency to focus on the number of an earthquake—specifically, the magnitude, or what people used to call the “Richter scale.” But the destruction from a quake usually has more to do with location and timing. Such was the case with the earthquake in Christchurch, New Zealand, on February 22, 2011.
A September 2010 earthquake centered 40 kilometers (25 miles) west of Christchurch, in the plains near Darfield, struck at 4:35 a.m., had a magnitude of 7.1, and caused some structural damage and one death (by heart attack). The earthquake in February 2011 occurred at 12:51 p.m. and just 10 kilometers (6 miles) from the center of Christchurch. It had a magnitude of 6.3, though was officially classified—scientifically speaking—as an aftershock of the 2010 quake. At least 166 people died, and the city of Christchurch was devastated structurally and emotionally. Many people are still missing.
The natural-color image above was captured on March 4, 2011, by the Advanced Land Imager (ALI) on NASA’s Earth Observing-1 (EO-1) satellite. Overlain on the map are seismological measurements of the ground shaking in the Christchurch area on February 22, as noted by the U.S. Geological Survey’s Earthquake Hazard Program.
The deeper the red color of the circle, the more intense the “peak ground acceleration,” or shaking of the earth. Note how intensity is highest right around the most densely developed areas of Christchurch. City officials and news accounts also described liquefaction—the softening and loosening of the soil due to shaking and groundwater penetration—that was 300 to 500 percent worse than during the September 2010 earthquake.
There are two forms of energy that cause the shaking in an earthquake. “P” or primary waves provide the initial, often vertical, jolt that lifts people and structures off the ground. “S” or secondary waves lead to horizontal shaking. Most structures collapse during the longer-duration S waves because buildings are not designed to handle this side-to-side motion. In Christchurch, the quake occurred so close by that the lag between P and S waves was a mere second.
References
GeoNet (2011, March 4) Christchurch badly damaged by magnitude 6.3 earthquake. Accessed March 8, 2011.
GNS Science (2011, February 25) February 22nd earthquake in Christchurch. Accessed March 8, 2011.
New Zealand Herald (2011, February ) Christchurch earthquake: Levels of liquefaction 300-500 pc worse. Accessed March 8, 2011.
U.S. Geological Survey (n.d.) Shake Map: South Island of New Zealand. Accessed March 8, 2011.
NASA Earth Observatory image by Robert Simmon, using ALI data from the EO-1 Team and USGS Earthquake Hazard Program. Caption by Mike Carlowicz.