bookmark_borderHow Is Climate Energy Hitting You? The Physics of When the Earth Starts Moving

by Daniel Brouse

Density. Velocity. Gravity. Friction. Entrainment.

Climate change is often described in terms of temperature: another degree of warming, another heat record, another fraction of a degree above a historical baseline.

But temperature is only the beginning of the story.

The more consequential question is:

What happens when warming changes how much energy and mass are available to move—and how easily they can move?

The atmosphere, oceans, glaciers, snowpack, soils, mountains, and rivers are all components of a connected physical system. They store energy and mass. Under certain conditions, that stored energy can be released rapidly through wind, water, ice, avalanches, landslides, floods, and debris flows.

And once something starts moving, density, velocity, gravity, friction, and entrainment can interact to dramatically amplify the consequences.


The Physics: Density × Velocity²

For fluid flow, dynamic pressure is proportional to density multiplied by the square of velocity:

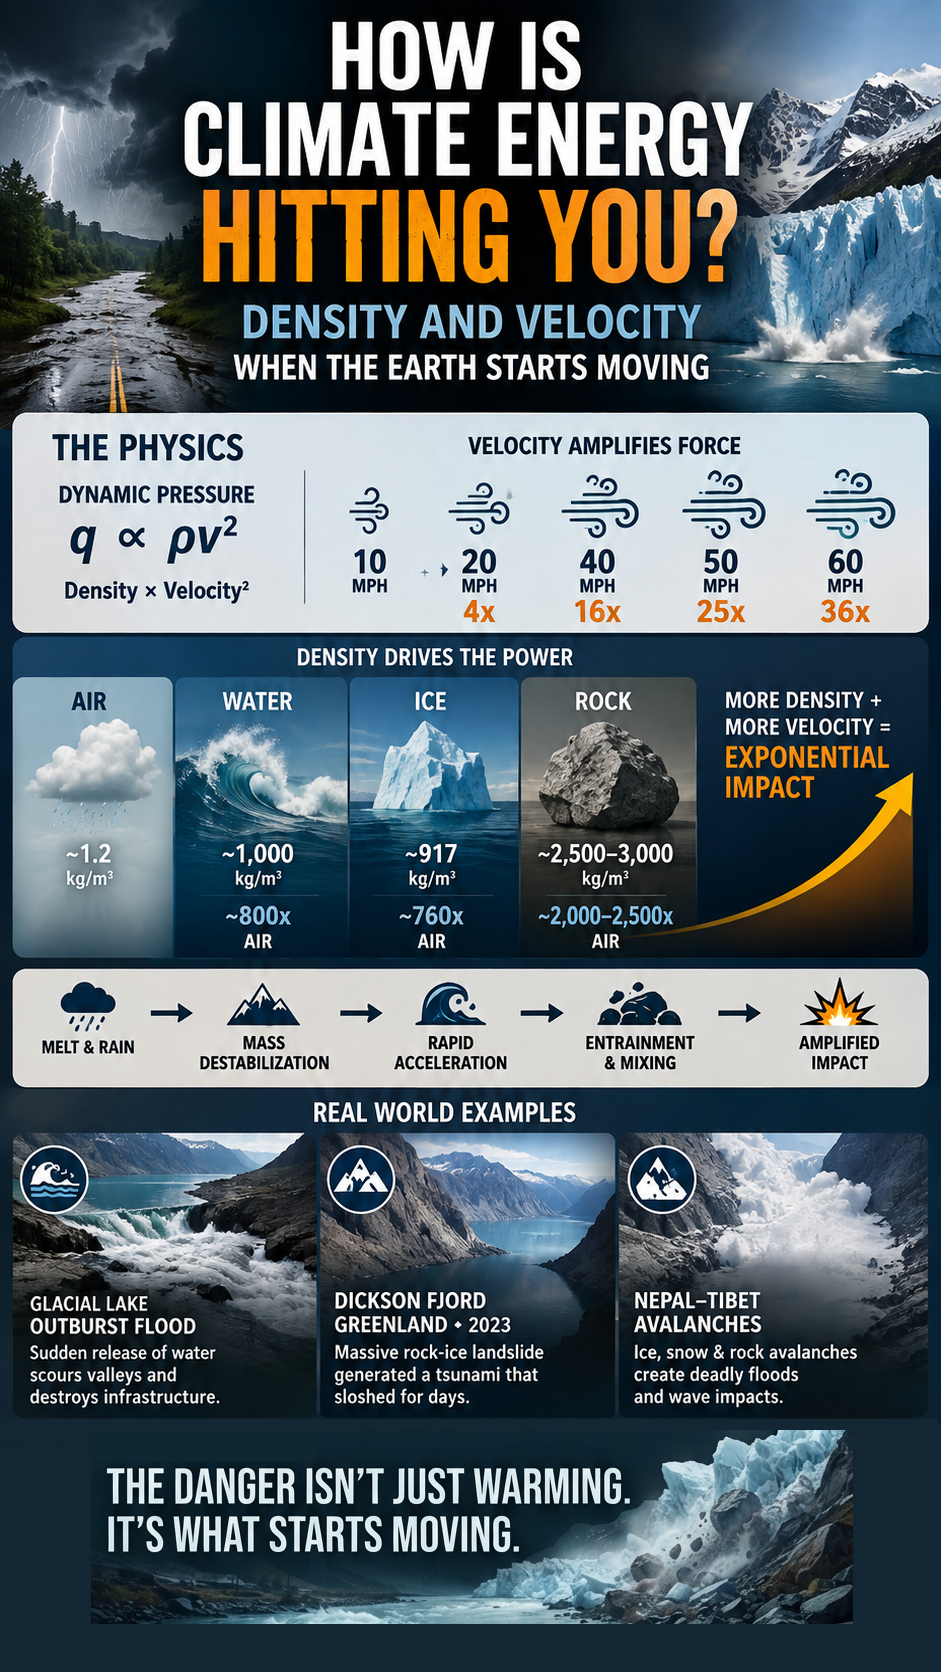
q ∝ ρv²

More precisely, dynamic pressure is:

q = ½ρv²

This simple relationship explains why velocity is such a powerful amplifier.

For example:

  • A 20 mph wind produces 4× the dynamic-pressure scale of a 10 mph wind.
  • A 40 mph wind produces 16×.
  • A 50 mph wind produces 25×.
  • A 60 mph wind produces 36×.

Velocity is therefore not a linear amplifier.

Double the velocity → 4× the velocity-squared term.

Triple the velocity → 9×.

And this is before considering density.


Density: How Much Mass Is Moving?

Density determines how much mass is packed into a given volume.

Approximate densities illustrate the enormous difference:

  • Air: ~1.2 kg/m³
  • Water: ~1,000 kg/m³
  • Ice: ~917 kg/m³
  • Rock: ~2,500–3,000 kg/m³

Water is therefore roughly 800 times denser than air.

Ice is roughly 760 times denser than air.

Rock can be roughly 2,000–2,500 times denser than air.

At the same velocity, these differences matter enormously.

But there is an important distinction.

The simple ρv² relationship describes dynamic pressure in a moving fluid. It should not be applied mechanically as though a rock avalanche were simply “rock behaving like air or water.” Moving ice and rock involve additional physics—especially mass, momentum, gravitational potential energy, kinetic energy, friction, and collisions.

The underlying principle, however, remains powerful:

More mass moving faster carries more energy and momentum.


Gravity: The Energy Stored in Height

Gravity is one of the great energy reservoirs of the Earth system.

A glacier sitting high in a mountain valley contains enormous gravitational potential energy because of its mass and elevation.

So does a mountainside.

So does water stored behind a natural or artificial dam.

So does a glacial lake perched above a downstream valley.

Gravitational potential energy is commonly expressed as:

PE = mgh

where:

  • m = mass
  • g = gravitational acceleration
  • h = elevation

When that stored energy is released, it can become kinetic energy:

KE = ½mv²

This creates another important connection between mass and velocity.

A small object moving rapidly can be destructive.

An enormous mass moving rapidly can be catastrophic.

And when the moving mass begins picking up additional material, the system can become even more powerful.


Friction: The Brake on the System

But gravity does not automatically make everything move.

Friction is the brake.

Friction resists movement between surfaces. It helps keep glaciers attached to their beds, soil on hillsides, rocks on mountains, and sediment within channels.

In simplified terms:

Gravity drives movement.
Friction resists movement.

The balance between those forces can determine whether a system remains stable—or begins to move.

This is particularly important in glaciers and steep mountain environments.


Meltwater: When the Brake Gets Wet

Under a glacier, meltwater can travel through cracks, crevasses, channels, and conduits until it reaches the glacier bed.

There it can increase water pressure between the ice and underlying rock.

That matters because increased water pressure can reduce the effective normal force pressing the glacier against its bed, potentially reducing basal friction and allowing the ice to slide more easily.

In other words, meltwater can do more than add water to the system.

It can reduce resistance to movement.

The simplified conceptual chain becomes:

Warming → melting → more meltwater → increased basal water pressure → reduced friction → enhanced sliding

But the actual relationship is complex. More meltwater does not automatically mean faster glacier movement. The effect depends on how water is distributed and drained beneath the glacier. Efficient drainage can relieve pressure, while poorly drained or rapidly delivered water can increase basal pressure.

The important point is that lubrication can alter the balance between driving force and resistance.

The same broader principle applies to unstable slopes.

Water infiltrating soil, fractured rock, snow, and ice can change pore-water pressure and reduce effective resistance to failure. A slope that was stable under one set of conditions can become unstable when water changes the mechanical balance.

So another pathway emerges:

More water → less effective resistance → greater potential for movement.

And once movement begins:

greater movement → greater velocity → greater kinetic energy.

Climate change can therefore influence not only how much energy enters a system, but under some circumstances how easily that stored energy can be released.


Entrainment: When Moving Material Picks Up More Material

There is another amplifier:

Entrainment.

Moving water can pick up sediment.

Floods can carry gravel and boulders.

Avalanches can incorporate snow, ice, trees, and rock.

Landslides can transform into debris flows as they mix with water and incorporate additional material.

A moving glacier can transport enormous quantities of sediment and rock.

This creates a potentially powerful feedback:

Movement → entrainment → more mass → greater momentum → greater destructive potential

The flow is no longer carrying only the material that initially started moving.

It is gathering additional mass along the way.


When Water Becomes a Weapon

Consider extreme rainfall.

Rain falls onto a landscape.

Some infiltrates.

Some becomes runoff.

As rainfall intensity increases, runoff can become increasingly rapid. Gravity accelerates water downslope. The moving water begins eroding soil and sediment and can pick up increasingly large particles.

Now the flow is carrying:

water + soil + gravel + rocks + trees + debris

The physical character of the event has changed.

It is no longer simply a flood.

It can become a debris flow or sediment-laden flood, capable of enormous erosion and impact.

This is why the consequences of extreme rainfall can be disproportionately larger than the increase in rainfall itself.


Glacial Lake Outburst Floods

The same principles operate in high mountain environments.

Glaciers can dam lakes.

Meltwater can increase lake volume.

Ice or rock can destabilize the surrounding terrain.

A sudden collapse, avalanche, or breach can release enormous quantities of water.

A glacial lake outburst flood, or GLOF, can rapidly send a pulse of water downstream.

As that water accelerates under gravity, it can scour the valley and entrain sediment, boulders, trees, and infrastructure debris.

The result can become a cascading process:

Stored water → sudden release → acceleration → erosion → entrainment → greater mass → amplified destruction

The original trigger may be relatively localized.

The resulting moving mass may not be.


When Glaciers and Mountains Collapse

The same energy cascade can occur when ice and rock themselves become unstable.

A glacier, ice shelf, frozen slope, or mountain face can store enormous gravitational potential energy.

When structural stability is lost, that energy can be released rapidly.

Ice, snow, rock, and debris accelerate downslope.

Collisions generate additional energy transfer.

Material can fracture and fragment.

Snow and rock can be entrained.

Water can be displaced.

And if the moving mass enters a lake, fjord, river, or ocean, it can transfer energy into the water and generate powerful waves.

The system can therefore move through multiple physical states:

Ice → collapse → acceleration → impact → water displacement → wave → downstream damage

This is not simply “melting.”

It is a mass-and-energy transfer through a connected Earth system.


Dickson Fjord: Greenland, 2023

The September 2023 event at Dickson Fjord in Greenland provides a remarkable illustration.

A massive rock-and-ice landslide entered the narrow fjord, displacing water and generating a tsunami-like wave. The confined geometry of the fjord allowed the resulting water motion to oscillate for days.

The event demonstrates how changes affecting ice, permafrost, and mountain stability can interact with water and topography to produce consequences far beyond the original failure.

The important lesson is the chain:

Mass failure → gravity → acceleration → water displacement → wave energy

One component of the Earth system triggers another.


Nepal–Tibet and the Himalayas

The high mountains of the Nepal–Tibet/Himalayan region provide another setting where these interactions can become particularly dangerous.

Here, glaciers, snowpack, steep rock faces, permafrost, glacial lakes, and rapidly flowing rivers exist within an extraordinarily steep landscape.

Ice and snow avalanches can incorporate rock.

Rock avalanches can interact with glaciers and snow.

Failures can enter lakes and displace water.

Floods can then transport the resulting debris downstream.

The potential cascade becomes:

Ice + snow + rock → avalanche → acceleration → water displacement → flood → debris entrainment

Again, the initiating event is only one part of the story.

The pathway of energy matters.


The Nonlinear Cascade

Put all of these components together and the system begins to look very different.

Climate warming

↓

More heat and altered precipitation

↓

Melt + intense rainfall

↓

More water available to move

↓

Changes in pore pressure and basal lubrication

↓

Potential reduction in friction / resistance

↓

Destabilization

↓

Gravity releases stored potential energy

↓

Acceleration

↓

Velocity² amplification

↓

Ice + water + snow + rock + sediment

↓

Entrainment adds mass

↓

Momentum and kinetic energy increase

↓

Water displacement / waves / debris flows

↓

Amplified physical impact

This is the central concept:

The climate system does not have to increase every variable dramatically to produce a dramatically larger consequence.

Several smaller changes can interact.

More water.

Less resistance.

Greater instability.

More available mass.

Higher velocity.

More entrainment.

Each can alter the conditions experienced by the next part of the chain.


This Is Not “Exponential” by Default

It is important to be precise.

The underlying physics does not mean that every climate impact is mathematically exponential.

The velocity-squared relationship is nonlinear.

Kinetic energy also scales with v².

Gravitational potential energy scales with mass and elevation.

Friction determines resistance to motion.

Water pressure can alter effective stress and friction.

Entrainment can increase the moving mass.

These nonlinear processes can interact and produce disproportionately large impacts relative to the initiating change.

The result can sometimes look exponential in its consequences even when no single component follows a simple exponential equation.

That distinction matters.

The physics is powerful enough without exaggerating it.


The Earth Is a Connected Energy System

This changes how we should think about climate risk.

The danger is not simply:

“The temperature went up.”

The more important question is:

“What did that additional energy change?”

Did it increase atmospheric moisture?

Did it intensify rainfall?

Did it accelerate runoff?

Did it increase meltwater?

Did it alter water pressure beneath a glacier?

Did it reduce effective resistance to sliding?

Did it destabilize frozen ground?

Did it weaken a slope?

Did it increase the amount of material available to an avalanche or debris flow?

Did a moving flood begin carrying rocks and trees?

Did a landslide enter a fjord or lake and displace water?

The climate signal can therefore propagate through a chain of physical processes.

Heat can become water.

Water can become motion.

Motion can become erosion.

Erosion can become entrainment.

Entrainment can become mass.

Mass moving under gravity becomes momentum and kinetic energy.

And that energy eventually reaches something we care about:

a road, a bridge, a home, a community, an ecosystem, or a coastline.


The Physics

The physics can be summarized in five words:

Density. Velocity. Gravity. Friction. Entrainment.

Density determines how much mass is contained in a moving volume.

Velocity can amplify fluid dynamic pressure and kinetic energy through the v² relationship.

Gravity provides a pathway for converting elevation into motion.

Friction normally acts as a brake—but water can sometimes reduce effective resistance through lubrication and changes in water pressure.

Entrainment can add more mass to a moving system as it travels.

Together, these processes create the possibility of cascading amplification.

The danger of climate change is therefore not measured only by the number on a thermometer.

It is also measured by what begins moving when the Earth system is pushed beyond its previous conditions.

The atmosphere moves.
The oceans move.
Water moves.
Glaciers move.
Mountains move.
Rock moves.
And when those systems begin interacting, energy can move from one component to another with astonishing speed.

The critical question is no longer simply:

How much warmer is the planet?

It is:

How much stored energy and mass are being made available to move—and what happens when the brakes come off?

That is how climate energy can hit you.


Footnote:

There was a video of what appeared to be large boulder rolling along the top of the entrainment and sometimes appearing to be bobbing up and down.

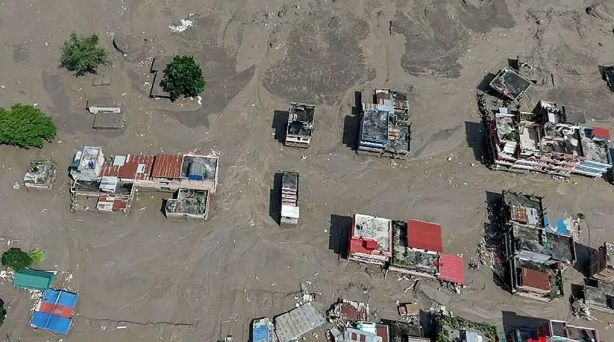
The bulk of the rock appears to have come through first, driven by the entrainment and water flow. That process essentially carved out a channel, which was then followed by an enormous mass of mud—up to three stories deep—that completely buried villages.

As for whether what we’re seeing is rock or ice, it was probably a combination of both. I heard one report describe the flow as being like “wet concrete,” which is actually a pretty good way to visualize the density and behavior of the material.

I also saw a video of a bridge collapse that really demonstrated the power of the flow. I was amazed by what looked like the “buoyancy” of the bridge. The entrainment was so dense and forceful that the bridge essentially “floated” on top of the moving mass, continued downstream, and then took out another bridge—which also appeared to “float” on top of the flow.

Both structures were ultimately carried downstream, taking out virtually anything and everything in their path. That is the kind of energy and momentum you get when water, sediment, rock, ice, and debris become one extremely dense, moving mass.

q = ½ρv²

If you’re interested in the physics, I wrote it out in detail. I thought you might be particularly interested in the lubrication/friction component, especially since you’ve been describing what appears to be that process in some of your comments. Under the right conditions, meltwater can reduce friction beneath the ice, contributing to what is known as basal sliding (or basal slip).

I’ve also seen footage showing substantial water flowing out from beneath the glacier, which makes the basal-flow question particularly interesting. There was also a glacial lake at the bottom of the system and a hydroelectric plant downstream—well, there was one before the event—leading me to believe there is substantial glacial meltwater.

Another factor is the thawing permafrost and peat that had been helping stabilize the rock and sediment. Add the unseasonably warm conditions and significant precipitation in the preceding days, and you have multiple processes acting together: meltwater infiltration, increasing water pressure, reduced basal friction, thawing ground, and gravity-driven ice and rock movement.

That’s why I’m hesitant to characterize what happened as simply an “ice collapse” or a “rockslide.” It appears to have involved a coupled ice-rock-water system. The ice-water mixture at the top of the fall may have been predominantly ice, but by the time that mass traveled roughly a kilometer downhill under an acceleration of about 32 ft/s², much of the ice would likely have melted or fragmented. As it accelerated, it was also entraining water, rock, sediment, and debris, rapidly changing the composition and behavior of the flow. Once the material began moving, the entrainment produced an extremely dense and mobile flow like “wet concrete.” When you see these villages buried under that material, it almost looks like the ground has turned into solidifying concrete or quicksand—an incredibly dense, water-saturated mass that can engulf and bury structures… and people in minutes. The rescue teams are reaching for people almost like they’re conducting an ice rescue—crawling on their bellies across the surface because the material is so unstable. It gives me a whole new perspective on the physics of climate change.
bookmark_borderGlacial Collapse: Tipping Points in Real Time

by Daniel Brouse

We’re crossing 1.5°C in a hurry—and tipping points are beginning to topple.

This is where tipping points get your attention: you can actually observe them.

Climate change is not a smooth, linear progression. As thresholds are crossed, individual tipping elements can begin interacting with one another. Feedbacks can couple across the Earth system, changes can propagate faster, and the acceleration of change can itself increase.

What once looked like gradual change can suddenly become a rapidly evolving cascade.

HISTORICAL OBSERVATION

When the last Ice Age ended, Earth experienced “Meltwater Pulse 1A”—a dramatic period roughly 14,500 years ago when sea levels surged upward by about 66 feet over approximately 500 years. Geological evidence from Barbados, Tahiti, and Sunda indicates that sea-level rise reached astonishing rates, sometimes exceeding 40 mm per year.

The lesson from the paleoclimate record is not that history will repeat itself exactly, but that the Earth system is capable of producing rapid, nonlinear changes when large stores of ice and water cross critical thresholds.

OBSERVE CASCADING TIPPING POINTS TODAY

For the last 40 years, sea-level rise has increased from roughly a millimeter to several millimeters per year. People often respond, “So what? What difference does a few millimeters a year make?”

But a sudden-release event is fundamentally different from 40 years of gradually melting ice.

Large volumes of meltwater can be temporarily stored or dammed behind and beneath glaciers, creating the potential for abrupt releases when a critical threshold is crossed.

DICKSON FJORD — GREENLAND

In 2023, a massive rock-and-ice avalanche involving approximately 25 million cubic meters of material plunged into Dickson Fjord and generated a seiche that produced seismic signals detectable around the world for nine days.

This wasn’t simply ice melting.

It was a sudden gravitational release from a destabilized mountain system.

NEPAL–TIBET

A massive ice-and-rock avalanche generated its own seismic signature.

Seismic analysis indicates that the shaking was not an earthquake that triggered the landslide. Rather, the enormous mass movement itself generated seismic waves equivalent to those associated with a magnitude 4.4–5.2 earthquake.

A huge section of glacier reportedly detached from roughly 5,200 meters (17,000 feet) near Langtang Lirung, fragmented during its descent, and transformed into an extraordinarily mobile mixture of ice, water, rock, sediment, boulders, and trees.

This is the critical distinction.

We aren’t simply watching glaciers melt.

We are watching a destabilizing Earth system capable of producing sudden releases, massive gravitational failures, seismic energy, debris flows, river blockages, and catastrophic floods.

The concern is not that every tipping point suddenly collapses at once.

The concern is that tipping points can couple.

One failure can increase stress on another system.

Another threshold is crossed.

Another feedback activates.

The cascade accelerates.

THAT IS THE CLIMATE CHANGE AVALANCHE.

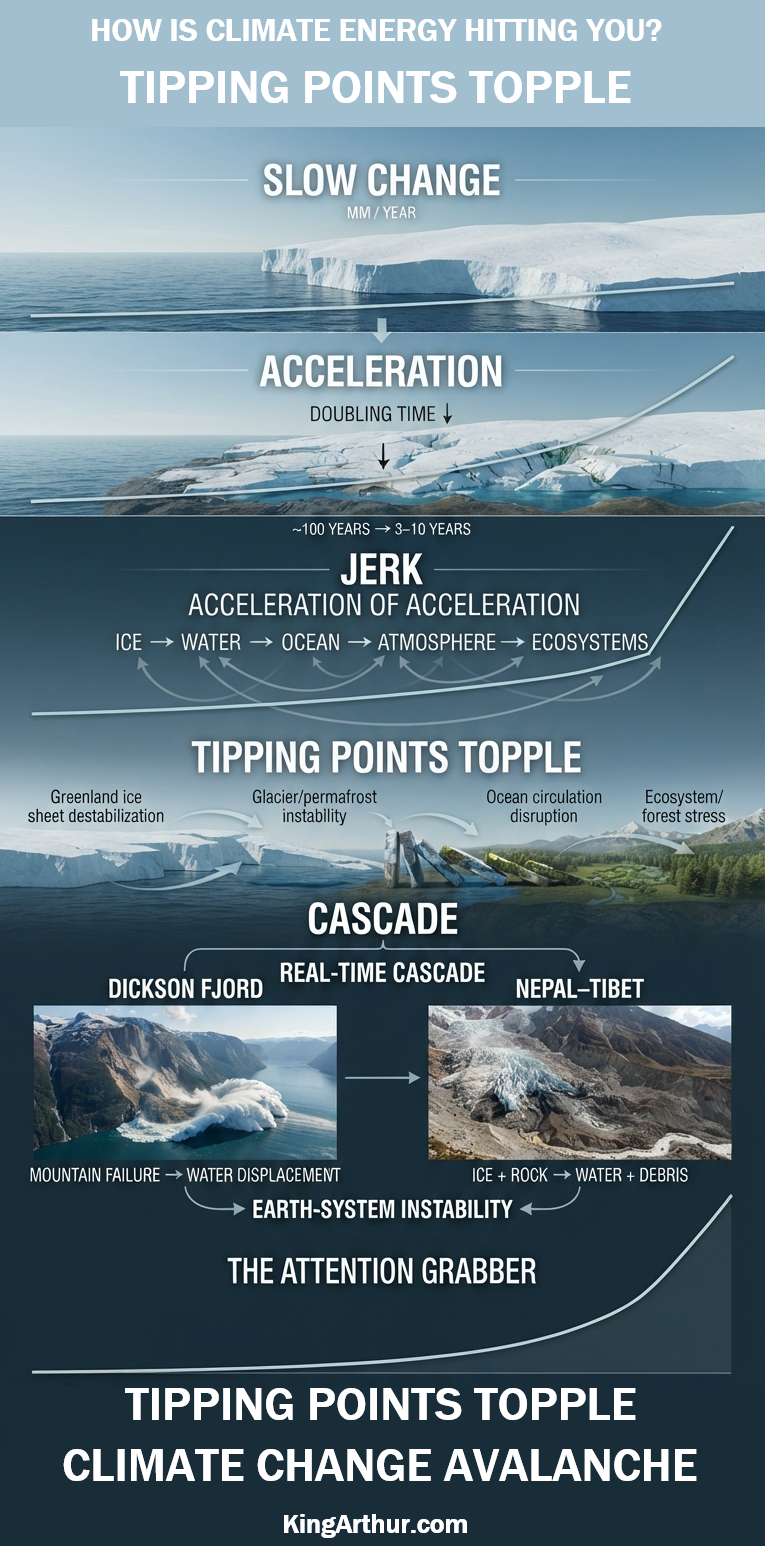
Slow → Accelerating → Tipping → Cascading → Rapidly Changing

Cascading tipping points are now observable in real time.

As we continue to race past 1.5°C, expect to see many more events like these as climate-driven changes increasingly interact with already destabilized Earth systems.

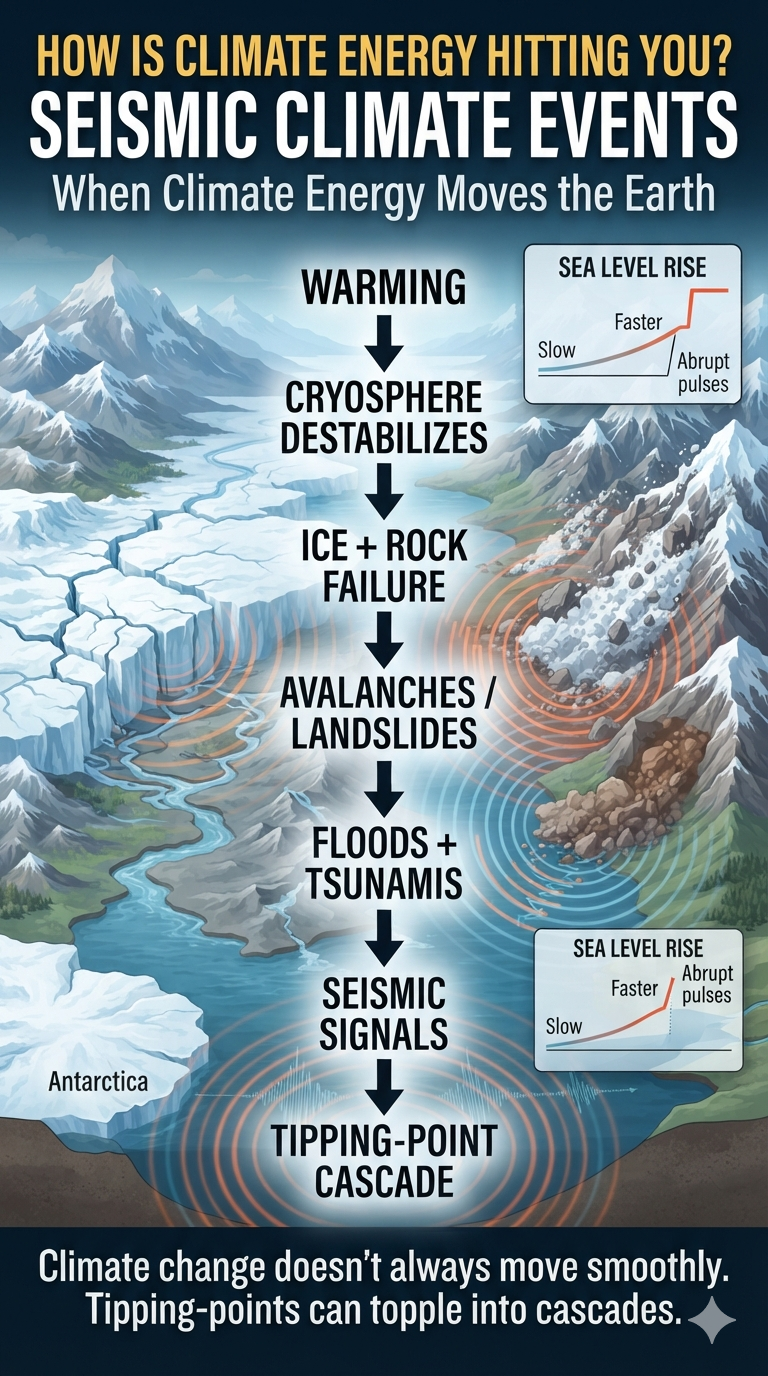
bookmark_borderHow Is Climate Energy Hitting You? Seismic Climate Events

by Daniel Brouse and Sidd Mukherjee

Seismic Climate Events: When Cryosphere Instability Becomes an Earth-System Hazard

I’ve written quite a bit about “Sudden Sea Level Pulses: How ‘Cork Release’ Events Could Rapidly Reshape Coastlines,” which you might find interesting. I expect we will see several feet of sea-level rise for several years in a row this century.

The big examples in Earth’s past occurred when proglacial lakes suddenly broke through ice dams during the last deglaciation.

When the last Ice Age ended, the Earth experienced “Meltwater Pulse 1A”—a dramatic period roughly 14,500 years ago when sea levels surged upward by about 66 feet in just 500 years. Data from Barbados, Tahiti, and Sunda confirm that the ocean rose at astonishing rates—sometimes more than 40 mm per year. We should expect similar patterns again.

I find sea-level rise very intriguing. However, the problem has always been that it is too “slow” for anybody to care. What’s a couple of millimeters a year?

It took us 10 years to confirm that sea-level rise was doubling every ~100 years—2²-fold on a centennial basis. Since the late 1990s, that doubling time has collapsed to 3–10 years. The collapsing doubling times indicate that SLR acceleration is accelerating at approximately 2⁶-fold on a decadal basis.

Though this jerk/third-derivative behavior is alarming to me, it still doesn’t seem to get people’s attention. This is just one set of climate-impact datasets. Many others show the same rate of acceleration.

Now, we’re crossing 1.5°C in a hurry.

This is where jerk behavior will get people’s attention.

We are fairly confident there are several feet or more of dammed-up meltwater. Jerk behavior puts a much higher probability on jerk-like reactions.

The result isn’t going to be a meter of sea-level rise overnight. It is much more likely to be a serious breach in Greenland that raises sea levels perhaps a foot the first year, two feet the next year, and another foot the following year. Then it may go back to millimeters or inches a year for a few years.

This is one of those feedbacks that is very difficult to comprehend.

Greenland has a lot of dammed-up meltwater. Greenland’s geology is shaped like a bowl. If the ice were to melt in place, most of it would likely stay in the bowl.

But hold on—not so fast.

Sudden-release events on Greenland are not the same thing as slowly melting ice over the last 40 years.

When the geology gives way, as it did in 2023’s Dickson Fjord seiche, the consequences can be extraordinary. That massive rock-and-ice avalanche, involving approximately 25 million cubic meters of material, created a tsunami that registered worldwide as an earthquake for nine days.

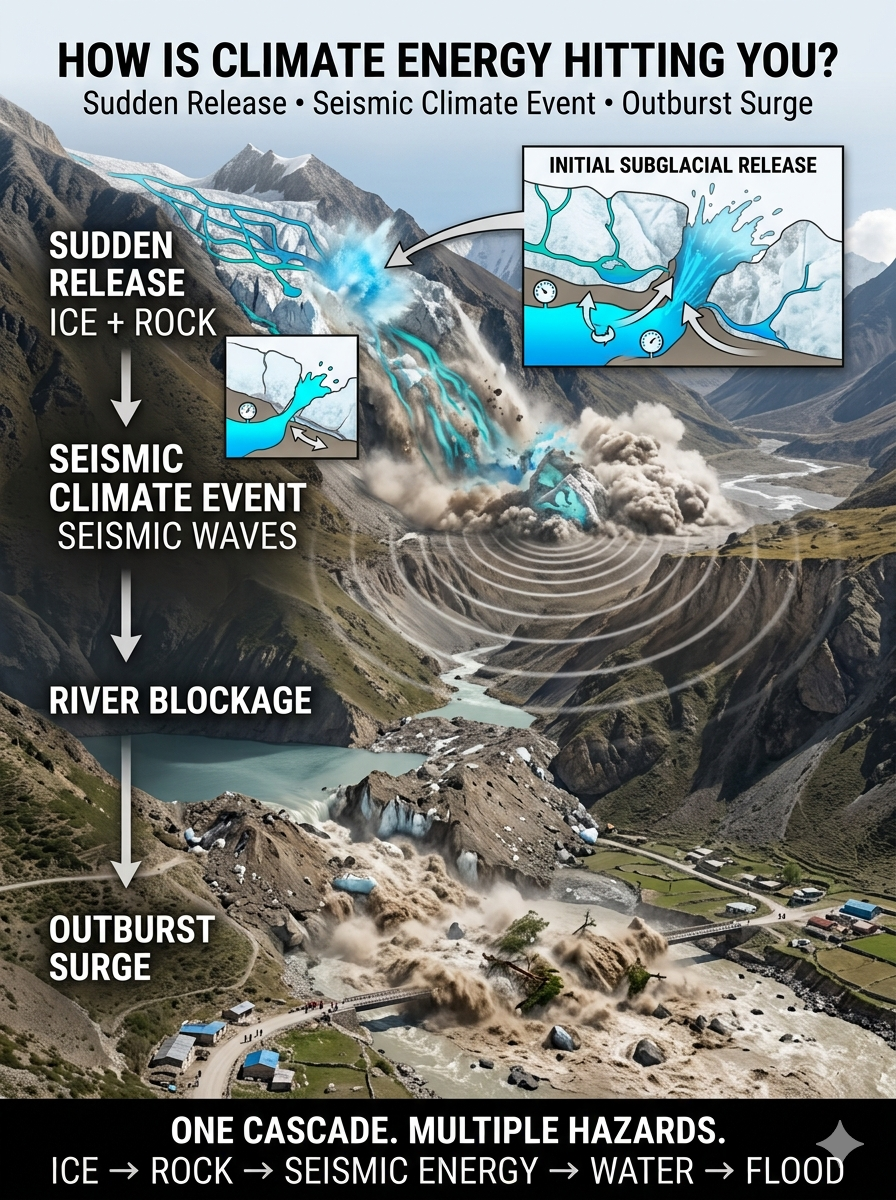
Recently, in Nepal–Tibet, a similar event demonstrated how a massive climate-sensitive mass movement can generate its own seismic signature. Seismic analysis indicates that the recorded shaking was not an earthquake that triggered the landslide. Instead, the enormous ice-and-rock avalanche generated seismic waves equivalent to those associated with a magnitude 4.4–5.2 earthquake.

A massive section of glacier—reported to have detached from an elevation of roughly 5,200 meters (17,000 feet) near Langtang Lirung—broke free and rapidly fragmented as it descended thousands of feet. The enormous mass of ice and rock transformed into a highly mobile mixture of ice, water, sediment, boulders, and trees.

The most likely mechanism is the sudden release of water stored beneath or within the glacier. That water could have dramatically reduced friction beneath the moving mass, allowing the avalanche to accelerate and travel farther than a conventional rockfall or icefall. Rather than behaving like a simple avalanche, the mixture became a rapidly moving debris flow—a slurry of water, ice, sediment, and rock capable of behaving almost like liquid concrete.

The immense mass then crashed into the upper catchment of the Lhende Khola, a river valley along the Nepal–Tibet border. The debris temporarily choked the narrow valley, creating an unstable natural landslide dam.

The Outburst Surge

Summer glacier melt and seasonal monsoon rainfall continued feeding water into the blocked drainage. As water accumulated behind the debris barrier, pressure increased until the unstable dam failed.

The resulting outburst released a massive surge of water and sediment downstream, producing a destructive wall of water and debris through the connected Himalayan river system.

The significance extends beyond the immediate flood. A warming cryosphere can destabilize glaciers and mountain slopes, while extreme precipitation supplies additional water to an already unstable system. A single gravitational collapse can then trigger river blockage, dam failure, flash flooding, and a measurable seismic signal.

This is the kind of cascading interaction that makes seismic climate events fundamentally different from conventional earthquakes: the climate-sensitive Earth surface itself becomes the source of the seismic energy.

Seismic Climate Event

It is an example of what can be described as a seismic climate event: climate-driven changes in glaciers, permafrost, snow, and mountain stability can increase the potential for enormous mass movements, which in turn release sufficient mechanical energy to generate measurable seismic signals.

The broader danger is the cascade.

Warming can destabilize the cryosphere. Cryospheric destabilization can trigger massive avalanches and landslides. Those failures can block rivers, generate flash floods and debris flows, and even produce detectable seismic waves.

The resulting disaster is therefore not the product of a single hazard, but of multiple interconnected Earth-system processes interacting in rapid succession.

Greenland gets even more interesting.

That bowl-like shape was caused by the weight of the glacier. As the glacier and meltwater quake into the sea, there will be fairly rapid rebound, and the bowl bottom will rise back up. This rebound is already much faster than earlier predictions.

This all brings Antarctica into the picture, potentially coupling with Greenland. That could be really drastic compared with Greenland alone.

In particular, Sidd said:

“Yes, I saw that. Under-ice hydrology is hard to observe, but there have been efforts with maps made of Greenland and Antarctica—probably incomplete. I still think Greenland will melt largely in place; Antarctica is the big one.”

See: Greenland Melting Is Inevitable

So how much faster the new-normal sea-level rise will be after such an event is quite uncertain—as is how long it will be until the next sudden release.

The important point is that climate change does not necessarily operate as a smooth, linear progression.

Sometimes the Earth system stores energy and mass until a threshold is crossed. Then the response can become abrupt. This is an observable tipping-point cascade, where one threshold crossing can destabilize another system and trigger a rapid sequence of interconnected changes.

That is the fundamental concern with seismic climate events: the climate system is increasingly interacting with a destabilizing cryosphere and a mechanically active landscape, creating the potential for cascading events that are far faster than the gradual changes that initially caused them.

bookmark_borderHow Is Climate Energy Hitting You? Sweden

by Daniel Brouse

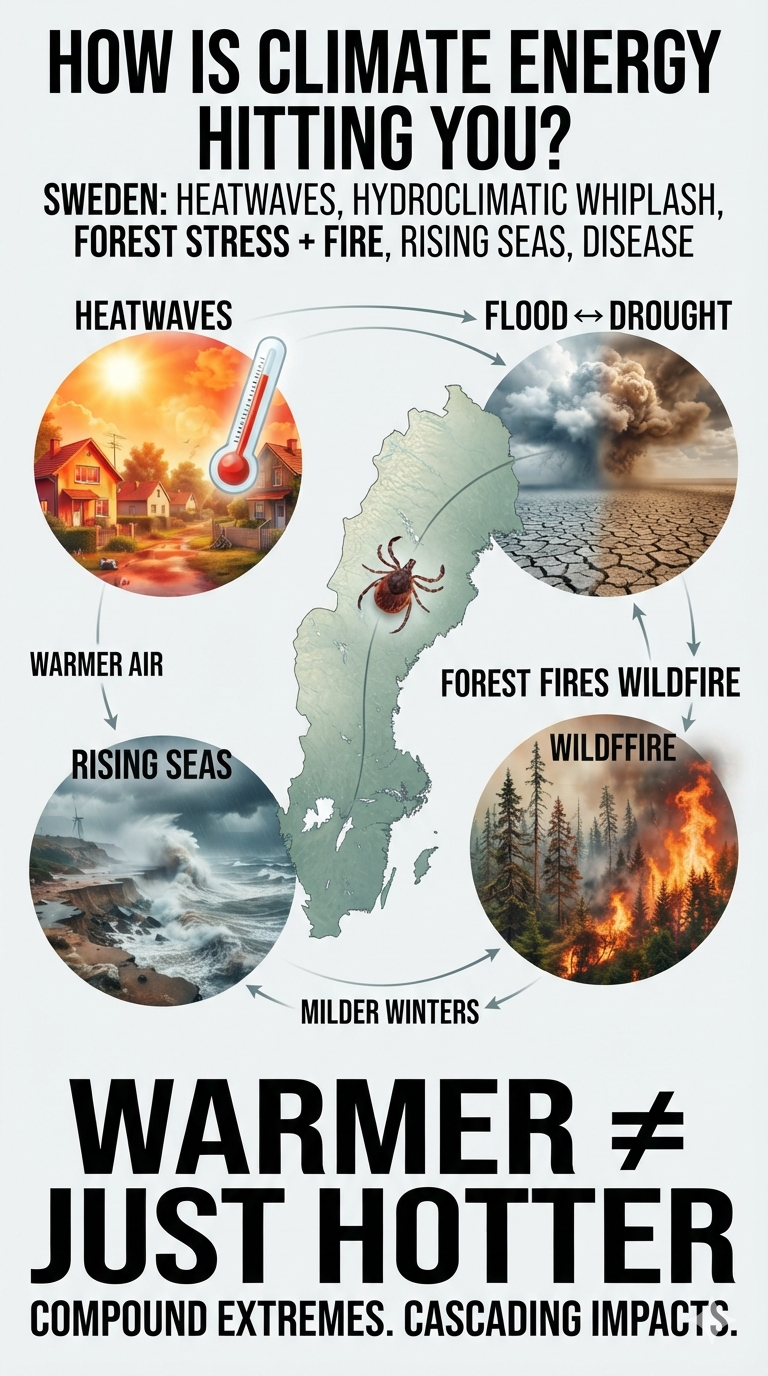
Sweden: Heatwaves, Hydroclimatic Whiplash, Forest Decline, Coastal Erosion and the Northward Spread of Disease

Sweden is warming rapidly, and the impacts of that warming are increasingly moving from long-term projections into everyday disruptions. A changing climate is reshaping Sweden’s risks across multiple interconnected systems—from heat and water to forests, coastlines, agriculture, and human health.

The Swedish Meteorological and Hydrological Institute (SMHI) and climate-impact assessments identify several major vulnerabilities that are becoming increasingly important.

1. Disruptive Heatwaves and the “Unprepared Housing” Crisis

More Frequent Extreme Heat: Sweden is experiencing increasingly frequent and intense heat events, including prolonged periods above 30°C (86°F) and, in extreme cases, 35°C (95°F) or higher. Although Sweden’s climate remains relatively cool compared with many parts of the world, its population and infrastructure are not designed for sustained extreme heat.

The Insulation Paradox: Much of Sweden’s housing stock was designed primarily to retain heat during long, cold winters. That efficiency can become a liability during prolonged summer heat, particularly in buildings without mechanical cooling or adequate passive ventilation.

Dangerous Warm Nights: Rising nighttime temperatures are especially important. When homes and buildings cannot cool overnight, people receive little physiological relief from daytime heat. Older adults, people with chronic conditions, outdoor workers, and other vulnerable populations face increased risks of heat exhaustion, cardiovascular stress, and premature death.

What was once considered an unusual summer inconvenience is increasingly becoming a public-health and infrastructure challenge.

2. Hydroclimatic Instability: Flash Floods vs. Drought

Climate change is intensifying Sweden’s water-cycle extremes, creating a dangerous contradiction: more intense rainfall can occur alongside longer periods of water scarcity.

Extreme Rainfall and Cloudbursts: A warmer atmosphere can hold more water vapor, increasing the potential for intense precipitation. Short-duration summer cloudbursts can overwhelm urban drainage systems, flooding streets, buildings, transportation networks, wastewater systems, and critical infrastructure.

Agricultural and Soil Drought: At the same time, prolonged periods without sufficient rainfall can rapidly dry soils. Higher temperatures increase evaporation and plant water demand, making drought conditions more severe even when annual precipitation does not decline dramatically.

Groundwater Stress: Extended dry periods can also reduce groundwater recharge and threaten local water supplies. Agriculture, forests, ecosystems, and municipalities can therefore experience water stress even during a year that produces damaging floods.

The result is increasingly hydroclimatic whiplash—rapid transitions between excessive water and insufficient water.

3. Forest Stress, Degradation and Wildfires

Sweden’s forests are both an economic resource and a major carbon store, making their increasing climate stress particularly consequential.

Heat and Drought Stress: Repeated heatwaves and prolonged drought reduce soil moisture and place trees under physiological stress. Weakened trees become more vulnerable to disease, insects, wind damage, and other disturbances.

Norway Spruce Vulnerability: Norway spruce, an important commercial species particularly in southern Sweden, is vulnerable to drought and heat stress. Water-stressed trees can become more susceptible to secondary pest outbreaks, accelerating forest decline.

A Longer Wildfire Window: Climate change does not necessarily create the ignition source for a wildfire, but it can make the landscape substantially more receptive to fire. Hotter temperatures, low humidity, dry vegetation, and prolonged drought can extend the period during which fires spread rapidly.

Large wildfires can destroy ecosystems and communities while releasing carbon stored in vegetation and soils—creating another feedback between climate change, forest health, and atmospheric carbon.

4. Coastal Erosion and Rising Sea Levels

Sweden’s coastline faces increasing pressure from rising sea levels, changing storm patterns, and coastal erosion.

Rising Baseline Water Levels: Global sea-level rise raises the starting point from which storm surges occur. Even where local land uplift moderates the rate of relative sea-level rise, some coastal areas remain increasingly exposed to flooding and erosion.

Storm-Surge Amplification: Strong autumn and winter storms can temporarily push water levels far above the average sea level. As the baseline rises, the same storm can produce greater coastal flooding and erosion.

Southern and Western Coastlines: Low-lying areas, particularly along parts of Skåne and Sweden’s western coast, face increasing long-term risks to beaches, wetlands, roads, buildings, and other infrastructure.

Cities and population centers including Malmö and Gothenburg face a particularly important challenge: protecting densely developed coastal areas while adapting to a coastline that is increasingly dynamic.

5. Vector-Borne Diseases Moving North

Climate change is also altering Sweden’s biological geography.

Expanding Tick Habitat: Warmer temperatures and milder winters can improve survival conditions for ticks and allow them to establish or remain active farther north and for longer portions of the year.

Tick-Borne Disease Risk: Diseases such as Lyme disease and tick-borne encephalitis (TBE) are therefore becoming increasingly important public-health concerns as environmental conditions change.

The northward expansion of vectors illustrates an important feature of climate change: the impacts are not limited to temperature. Warming can reorganize ecosystems and alter where infectious diseases can persist and spread.

Sweden’s Climate Risk Is Becoming a Systems Problem

These hazards do not occur independently.

Heat increases evaporation and worsens drought. Drought weakens forests and increases wildfire risk. Wildfires release stored carbon and damage ecosystems. Extreme rainfall can then produce flash floods after dry periods. Rising seas increase coastal exposure, while warmer conditions alter the distribution of disease-carrying organisms.

The emerging pattern is therefore not simply “Sweden is getting warmer.”

It is a more complicated transformation of the country’s water cycle, forests, coastlines, infrastructure, ecosystems, and public-health systems.

Climate energy is increasingly expressing itself through compound and cascading extremes—where one disruption increases the vulnerability to the next.

For Sweden, climate change is becoming less about a distant future and more about how quickly its existing systems can adapt to a rapidly changing physical environment.

bookmark_borderHow Is Climate Energy Hitting You? The I-95 Corridor

by Daniel Brouse

Philadelphia to Washington: Severe Storms, an Expanding “Tornado Alley,” Straight-Line Winds, and the Urban Heat Island

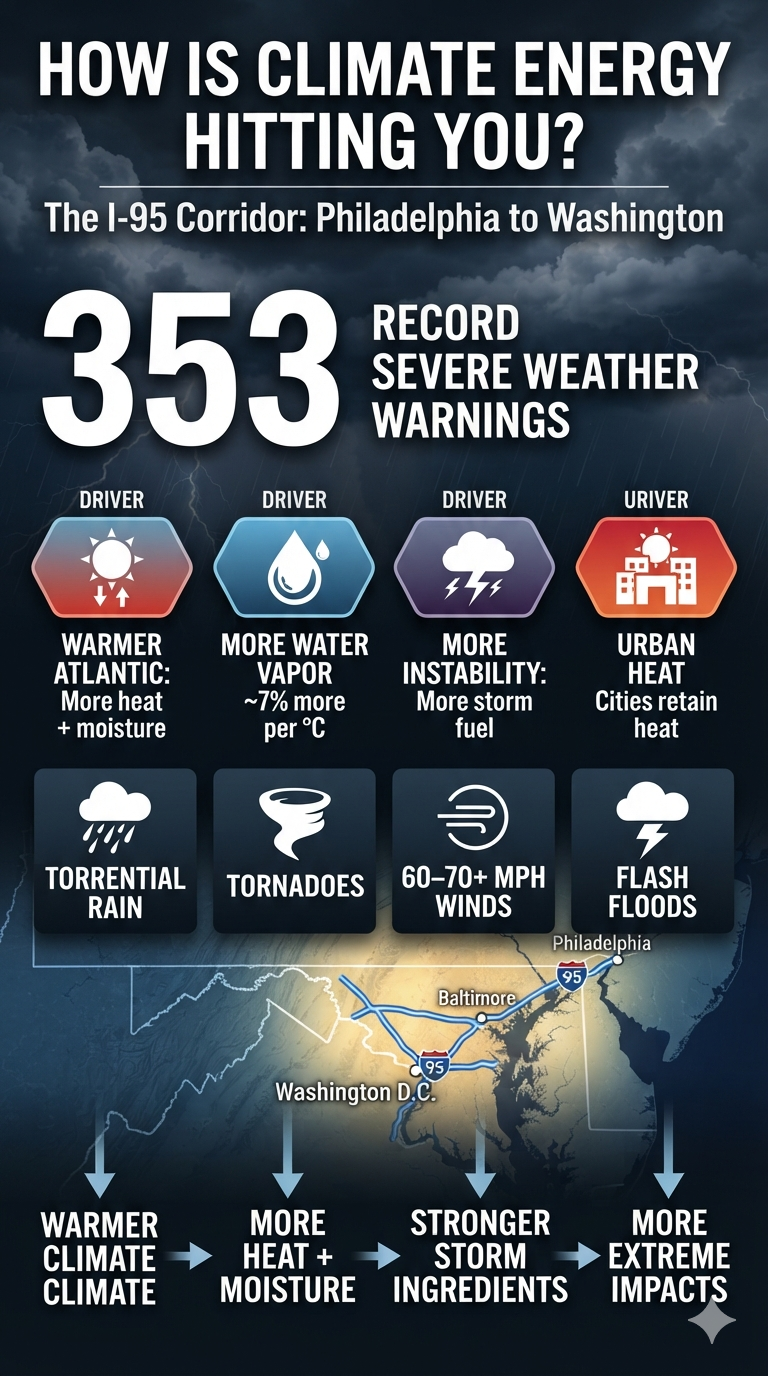
The Philadelphia-to-Washington corridor has experienced an extraordinary number of severe thunderstorm and tornado warnings this year. So far, 353 warnings have been issued across the region, putting the I-95 corridor from Washington, D.C., through Baltimore and Philadelphia at the center of an unusually active severe-weather season.

This concentration of warnings is not the result of a single cause. It reflects the interaction of a warming climate with the atmospheric conditions that generate severe thunderstorms: more available moisture, greater atmospheric instability, strong wind shear, warmer land and ocean surfaces, and increasingly favorable conditions for rapidly developing storms.

An Expanding “Tornado Alley”

The traditional image of “Tornado Alley” centers on the Great Plains. But severe-weather climatology is not static. Over recent decades, the eastern United States has experienced a growing share of tornado and severe-convective activity, with the Mid-Atlantic increasingly exposed to damaging storms.

The Washington-to-Philadelphia corridor is particularly vulnerable because of its geography. Warm, moisture-rich air from the Atlantic Ocean and the Gulf Stream can surge northward and collide with cooler, drier air and frontal boundaries moving eastward across the Appalachians.

When those ingredients overlap with sufficient wind shear and atmospheric instability, the result can be rapidly developing thunderstorms capable of producing tornadoes, damaging winds, large hail, and torrential rainfall.

A Warmer Atmosphere Means More Atmospheric Fuel

One of the most important climate connections is atmospheric moisture.

For every 1°C of warming, the atmosphere can hold approximately 7% more water vapor. A warmer atmosphere does not automatically produce severe weather, but when moisture is available and the other ingredients for convection are present, that additional moisture provides more energy and water for intense storms.

Along the heavily urbanized Northeast corridor, this can produce extremely high rainfall rates. Downpours capable of dropping several inches of rain in a short period can overwhelm drainage systems and produce flash flooding with little warning.

The same moisture-rich environment can also contribute to stronger thunderstorms by increasing the amount of latent heat released as water vapor condenses within developing storm clouds.

Microbursts and Damaging Straight-Line Winds

Not every destructive wind event is a tornado.

Many severe thunderstorm warnings along the I-95 corridor involve straight-line winds, downbursts, and microbursts. These winds can reach 60–70 mph or more and can cause damage comparable to that produced by weaker tornadoes.

A microburst occurs when a powerful column of descending air reaches the surface and spreads outward rapidly. The resulting winds can knock down trees and power lines, damage structures, overturn vehicles, and create dangerous conditions for aviation.

The distinction matters because the damage may look similar to tornado damage even when no tornado occurred.

The Urban Heat Island Adds Another Layer

Philadelphia, Baltimore, and Washington, D.C., are enormous concentrations of concrete, asphalt, buildings, vehicles, and other heat-absorbing surfaces.

These urban areas create a heat-island effect, in which temperatures remain higher than in surrounding rural areas, particularly after sunset. During the day, intense solar heating can further warm the surface and the air immediately above it.

When this heat interacts with an already warm, humid atmosphere, it can increase atmospheric instability. Boundaries created by differences between urban and rural heating can also help influence where thunderstorms develop or intensify.

That does not mean the urban heat island “causes” every severe storm. Rather, it is another component of an increasingly complex environment in which multiple sources of atmospheric energy can interact.

Climate Energy Meets Weather

The critical point is that climate change does not replace ordinary weather dynamics. It changes the background conditions in which those dynamics operate.

A warming Atlantic provides additional heat and moisture. A warmer atmosphere increases moisture capacity. Warmer urban surfaces add localized heat. Strong frontal boundaries and wind shear provide the structure needed for severe convection.

When these ingredients come together, the result can be a rapidly escalating sequence:

Warmer ocean → more atmospheric moisture → greater latent heat → greater instability → stronger convection → intense rainfall, downbursts, straight-line winds, and tornadoes.

The result is not simply “more storms.” It is an atmosphere increasingly capable of producing higher-impact extremes when the right ingredients align.

For the Philadelphia-to-Washington corridor, the extraordinary number of severe-weather warnings this year is another reminder that climate energy is not an abstract measurement on a graph. It is expressed through the atmosphere above our cities—and increasingly through the storms moving across them.

353 warnings is not just a number. It is a measure of how often the atmosphere has been reaching the threshold for potentially dangerous weather.

bookmark_borderHow Is Climate Energy Hitting You? Nepal–Tibet

by Daniel Brouse

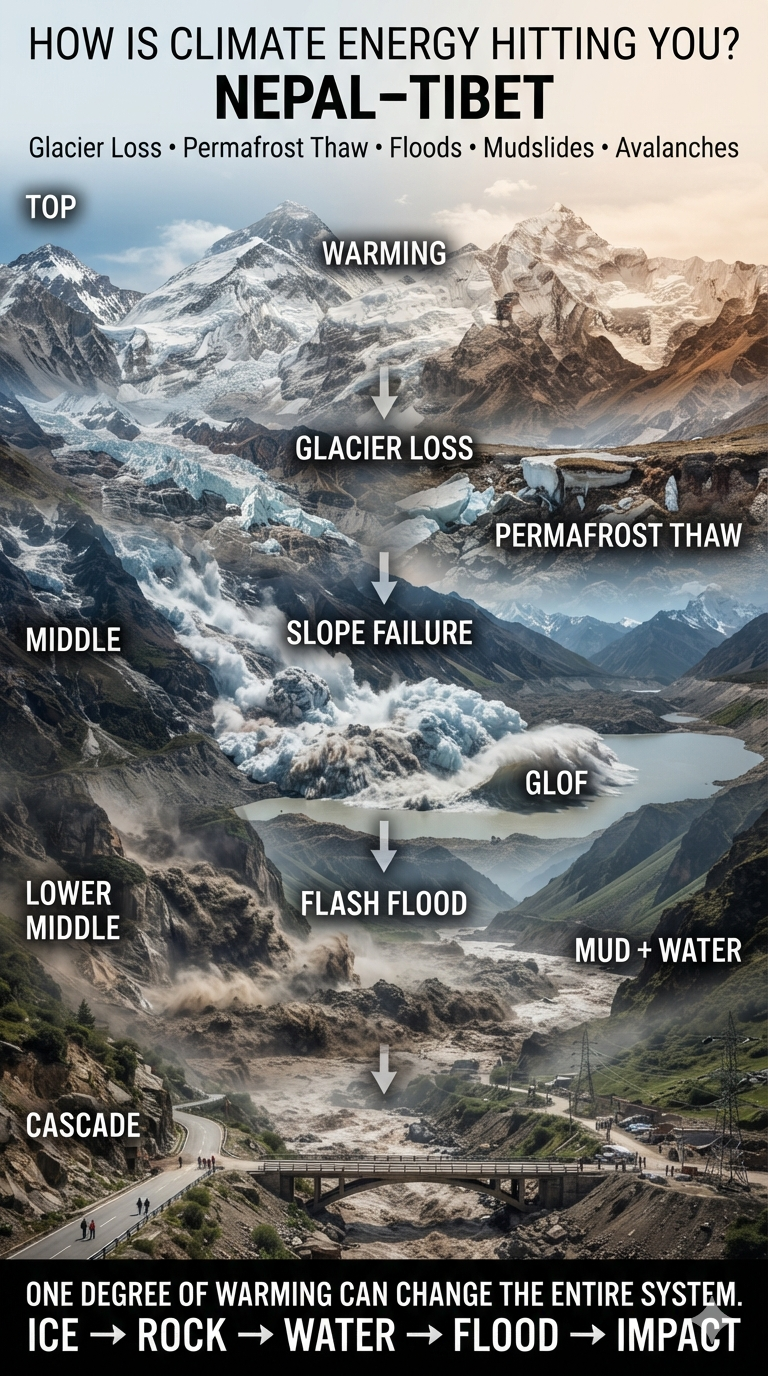
Nepal–Tibet: Glacier Loss, Permafrost Collapse, Glacial Lake Outburst Floods, Flash Floods, Mudslides and Avalanches

Hundreds of people are missing—including hundreds of foreign tourists and pilgrims—after a deadly flash flood struck the Nepal–Tibet border. CCTV footage from Tibet shows a wall of water and mud sweeping into buildings at a border crossing, while images from Nepal show people scrambling to escape as floodwaters surge through the area.

Nepal is a major destination for mountaineers, trekkers, and Hindu and Buddhist pilgrims. Thousands of people travel through the Himalaya each year to visit sacred sites.

August is also a busy season for travelers heading toward Mount Kailash, located in Tibet’s Ngari Prefecture, which is administered by China. The journey from Kathmandu can take roughly 10 days, and thousands of pilgrims cross the Nepal–Tibet border to reach these sacred destinations.

Nepalese tourism officials say hundreds of pilgrims are missing, including more than 100 Indians. The Gyirong–Rasuwagadhi border crossing, a major route between Nepal and Tibet, was struck by a powerful surge of mud and water.

But this disaster is about more than one extreme event.

The Nepal–Tibet Himalayan region sits at the intersection of several climate-sensitive systems: glaciers, snowpack, permafrost, steep mountain slopes, monsoon rainfall, rivers, and glacial lakes. As the region warms, these systems can become increasingly unstable—and their failures can compound one another.

A Mountain System Under Increasing Stress

The Himalaya is warming rapidly, with high-elevation regions experiencing particularly significant changes. Rising temperatures are accelerating glacier loss, altering snow and ice dynamics, thawing permafrost, and increasing the potential for cascading hazards.

The important point is that these hazards do not operate independently.

A warming atmosphere can destabilize a glacier.

A collapsing glacier can trigger an avalanche.

An avalanche can strike a glacial lake.

The resulting displacement wave can breach a natural dam.

The flood can then pick up enormous quantities of rock, soil, and debris as it races downstream.

By the time it reaches a populated valley, what began as warming in the high mountains can become a wall of water, mud, ice, and rock.

Accelerating Avalanches and Permafrost Collapse

Glaciers across the Hindu Kush Himalaya are losing mass rapidly. Retreating glaciers expose unstable terrain while warming temperatures alter the physical structure of ice and frozen ground.

Hanging glaciers can become increasingly unstable. Warmer conditions can promote fracturing and destabilization of ice perched above steep slopes. When large sections collapse, they can generate enormous ice-and-rock avalanches.

Permafrost is another critical component. At high elevations, permanently frozen ground acts like a kind of natural cement holding fractured rock and mountain slopes together. As that frozen ground thaws, the strength of the mountain system can decline.

The result can be slope failures, rockfalls, landslides, and massive collapses into river valleys.

From Glacier Loss to Flash Floods

One of the most dangerous consequences is the increasing potential for glacial lake outburst floods, or GLOFs.

As glaciers retreat, they can leave behind lakes contained by unstable piles of glacial debris called moraines. These natural dams are considerably less predictable than engineered structures.

An avalanche, landslide, or large rockfall entering one of these lakes can displace enormous volumes of water. The resulting wave can overtop or breach the moraine, releasing a sudden flood downstream.

And the flood can become much larger as it moves.

A surge entering a narrow Himalayan valley can pick up boulders, trees, soil, ice, and other debris. What emerges downstream may no longer resemble a conventional flood. It becomes a rapidly moving mixture of water and sediment capable of destroying bridges, roads, buildings, power facilities, and entire communities.

Monsoon Extremes and Mudslides

The other half of the equation is rainfall.

Climate change is altering the hydrological cycle. A warmer atmosphere can hold more water vapor, increasing the potential for extremely intense precipitation when that moisture is released.

The danger is not simply more rain.

It is greater volatility.

Longer dry periods can be followed by exceptionally intense rainfall. When torrential precipitation falls onto already unstable slopes, landslides and mudflows can occur with little warning.

Mountain terrain makes the problem even more severe.

Steep slopes, fractured rock, thawing permafrost, retreating glaciers, and saturated soils create conditions in which enormous quantities of sediment can suddenly move downhill.

Critical transportation corridors are particularly vulnerable. Highways, bridges, tunnels, and hydropower facilities frequently occupy narrow valleys—the same pathways followed by floodwaters and debris flows.

The August 2026 Border Disaster

The current disaster along the Nepal–Tibet border illustrates how these hazards can interact.

Reports indicate that an ice-and-rock avalanche blocked the Lhende River, a tributary of the Bhotekoshi River. A localized magnitude-4.4 earthquake may also have contributed to destabilizing the terrain.

The resulting blockage and subsequent flooding generated a massive surge of water and debris, reportedly producing a mudflow roughly 33 feet high.

The flood destroyed or severely damaged border infrastructure, including the strategic Friendship Bridge, and caused major casualties around Tibet’s Gyirong port.

At least 22 people have been confirmed dead, while hundreds of international tourists and pilgrims remain missing according to reports.

The disaster also damaged Nepal’s electricity infrastructure, temporarily taking a substantial portion of the country’s hydropower capacity offline.

This is an important reminder that climate-driven disasters do not only kill people directly.

They can also disable the infrastructure societies depend upon for transportation, electricity, communications, food distribution, tourism, and emergency response.

The Cascade Is the Story

The most important climate signal here is not any single flood, avalanche, landslide, or rainfall event.

It is the coupling of hazards.

Warming

↓

Glacier loss + snow and ice instability

↓

Permafrost thaw

↓

Unstable mountain slopes

↓

Avalanches and landslides

↓

Glacial lake disruption and river blockages

↓

Extreme rainfall

↓

Flash floods + debris flows + mudslides

↓

Destroyed infrastructure

↓

Disrupted electricity, transportation and tourism

↓

Human casualties

This is what makes the Himalaya particularly vulnerable to a changing climate.

The mountains are not experiencing isolated changes. They are experiencing changes in a tightly connected system.

When one component moves, it can destabilize another.

And when several components move simultaneously, the result can be a cascade.

Climate Energy Is Moving Through the System

The Himalaya is a powerful example of what climate change actually means on the ground.

Climate change does not simply mean that the average temperature rises by a few degrees.

It means that additional energy enters the climate system and changes how water, ice, rock, soil, and atmospheric moisture interact.

In the high Himalaya, that additional energy is destabilizing parts of the cryosphere while increasing the atmosphere’s capacity to transport moisture.

The result is a dangerous combination:

More unstable ice + more unstable ground + more atmospheric moisture + extreme precipitation = greater potential for cascading disasters.

For people living in Himalayan valleys—and for the millions who depend upon these mountains for water, transportation, energy, agriculture, tourism, and cultural traditions—the consequences are becoming increasingly difficult to separate from everyday life.

The question is no longer simply whether climate change is occurring.

The question is:

How is the energy already entering the climate system moving through the landscape—and where will the next cascade begin?

bookmark_borderHow Is Climate Energy Hitting You? Death Valley

by Daniel Brouse

Death Valley: When the Desert’s Extremes Become More Extreme

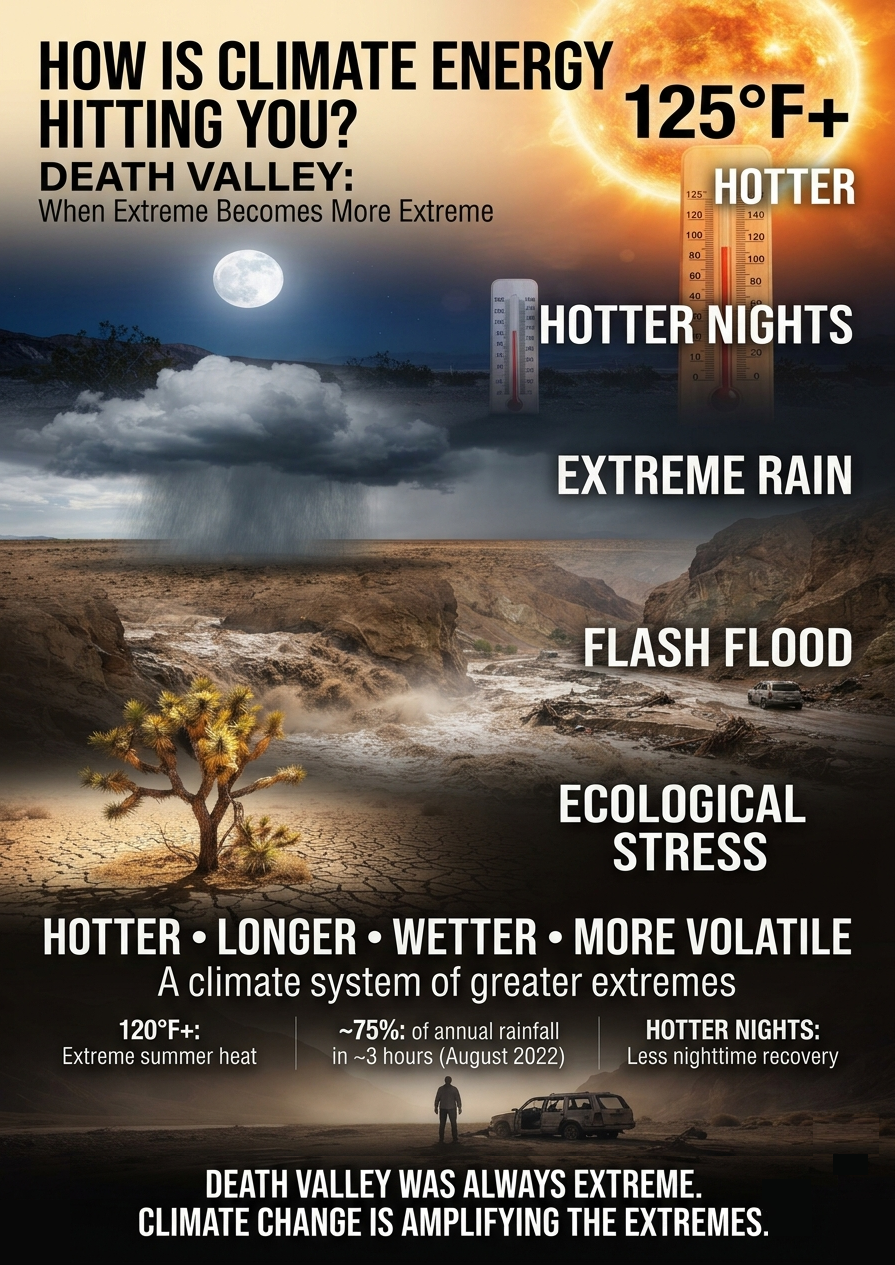
Death Valley has always been one of the hottest, driest, and most inhospitable places on Earth. But human-caused climate change is pushing those natural extremes into increasingly dangerous territory. The valley’s unique topography—essentially a vast natural basin that traps heat—can amplify warming, while changing atmospheric conditions are producing longer heat waves, warmer nights, more intense rainfall, and increasing ecological stress.

Death Valley is not simply getting hotter. Its entire pattern of extremes is becoming more extreme.

Death Valley Lives Up to Its Name

The danger is not theoretical. Extreme heat, difficult terrain, vehicle accidents, and sudden medical emergencies make Death Valley one of the most hazardous environments in the National Park System.

August 2026: Extreme Heat and Fatalities

  • Pierre Michel Formosa — August 17, 2026: The 68-year-old French tourist died after his rental vehicle became stuck in mud on remote West Side Road. In temperatures reaching 116°F (46.6°C), Formosa and his companion attempted to walk across the open salt flats toward Badwater Road for help. Formosa collapsed and died roughly 1.3 miles into the trek. Park officials subsequently reminded visitors to remain with disabled vehicles, particularly where shade and visibility can improve the chances of rescue.
  • Unresponsive visitor south of Badwater — August 2026: Emergency responders located a deceased woman after receiving reports of an unresponsive visitor during a stretch of consecutive days in which temperatures exceeded 120°F.

Extreme heat can also contribute to mechanical failures and indirect deaths. When temperatures become extreme, vehicles, tires, batteries, cooling systems, electronics, and other mechanical components are pushed beyond the conditions for which they were designed. A breakdown in a remote or dangerously hot environment can quickly become a life-threatening event.

Death Valley provides a stark example. Some deaths there have been associated with vehicle failures that left people stranded in extreme heat. In such cases, the vehicle failure itself may not be the direct cause of death, but it can become a critical link in the chain of events that ultimately leads to fatal heat exposure.

This is an important dimension of climate risk that is easy to overlook. Extreme heat doesn’t only affect the human body directly; it can destabilize the systems people depend on to survive. A failed vehicle can mean the loss of transportation, air conditioning, communications, or access to water and medical assistance. As extreme temperatures become more frequent and intense, these indirect pathways to injury and death become increasingly important to consider.

1. Scorching Heat Waves Are Lasting Longer

Death Valley has always experienced extraordinary heat. Climate change, however, is increasing the baseline temperature on which these extremes occur, making prolonged heat events more dangerous.

Persistent high-pressure systems and heat domes can trap hot air over the region. Instead of experiencing a brief spike in temperature followed by meaningful relief, the valley can endure successive days of extraordinary heat.

Death Valley has repeatedly approached or exceeded 125°F (51.7°C) during major heat events, including extraordinarily long runs of extreme temperatures. The park’s record-setting summers increasingly cluster in the recent decades, illustrating how the climate baseline has shifted.

The significance is not simply another record high.

A hotter baseline makes extreme heat easier to reach—and harder to escape.

2. The Nights Are Getting Hotter

One of the most consequential changes associated with global warming is the rise in nighttime temperatures.

Historically, desert nights provided at least some relief from daytime heat. But as temperatures rise, that recovery period is becoming less reliable. During prolonged summer heat events, nighttime temperatures can remain extraordinarily high, sometimes failing to fall below 80°F and, during the most extreme events, remaining near or above 100°F (37.8°C).

That matters because the human body needs opportunities to shed accumulated heat.

When nights remain unusually warm, people, animals, vegetation, and infrastructure begin the next day without fully recovering from the previous one. The result is a form of cumulative heat stress:

Hot day → insufficient nighttime cooling → hotter starting point → greater heat stress → even greater vulnerability.

In Death Valley, where daytime temperatures can already exceed 120°F, the loss of nighttime relief is particularly dangerous.

3. “Once-in-a-Thousand-Year” Flash Floods

Death Valley presents a striking climate paradox: one of the driest places in North America can also experience devastating flash floods.

Warmer air can hold more atmospheric moisture. When that moisture is released in intense thunderstorms, rainfall can overwhelm the desert’s ability to absorb and channel the water.

The result can be catastrophic.

In August 2022, a historic storm dropped roughly 75% of Death Valley’s average annual rainfall in only about three hours. Floodwaters trapped hundreds of visitors, damaged or destroyed vehicles, and severely damaged park infrastructure.

The event demonstrated an important feature of a warming climate:

Extreme drought and extreme rainfall are not opposites. They can occur in the same place—and increasingly interact with one another.

Parched, hardened or poorly infiltrating desert surfaces can transform intense rainfall into rapidly moving floodwater. Canyons and steep terrain then concentrate that water into powerful torrents.

A place can therefore become simultaneously hotter, drier, and more vulnerable to extreme flooding.

4. Seasons Are Shifting

The climate signal is not confined to the middle of summer.

Extreme heat can arrive earlier in the year, rapidly drying winter and early-spring vegetation and shortening the period when conditions are relatively hospitable.

That matters because Death Valley’s plants and animals have evolved within a narrow set of environmental conditions. They are adapted to heat and drought—but adaptation has limits when environmental conditions change faster than biological systems can respond.

The park’s famous desert ecosystems are therefore being exposed to multiple pressures at once:

  • Earlier and more persistent heat
  • Greater evaporative demand
  • Reduced soil moisture
  • Longer periods of drought
  • More intense rainfall events
  • Greater wildfire and vegetation stress
  • Reduced opportunities for seasonal recovery

Species that depend on specific temperature and moisture conditions can be especially vulnerable. Joshua trees, for example, face increasing difficulty establishing new seedlings in portions of the Southwest as hotter and drier conditions alter the environments needed for successful reproduction.

Bird populations and other wildlife are also affected by changes in water availability, food resources, vegetation, and extreme heat.

Death Valley Is Becoming a Climate Stress Test

Death Valley has always been an extreme environment. That is precisely why it provides such a powerful illustration of climate change.

Climate change does not need to transform Death Valley into something completely different. It can amplify the characteristics that already define it.

The heat becomes hotter.

The heat lasts longer.

The nights provide less relief.

Rain falls less predictably and can arrive with greater intensity.

The seasons shift.

Ecological recovery becomes more difficult.

The result is not simply a warmer Death Valley. It is a more volatile and increasingly stressful climate system.

Death Valley has always lived up to its name.

The emerging question is whether the ecosystems—and the people who venture into them—can continue to live with the increasingly extreme conditions that made the valley famous in the first place.

bookmark_borderHow Is Climate Energy Hitting You? Extreme Extremes

by Daniel Brouse

Extreme Extremes: Walpeup and Hopetoun, Australia; Floridia, Italy; Miami, Florida; Joubertina, South Africa; Bridgeport, Connecticut; Philadelphia, Pennsylvania

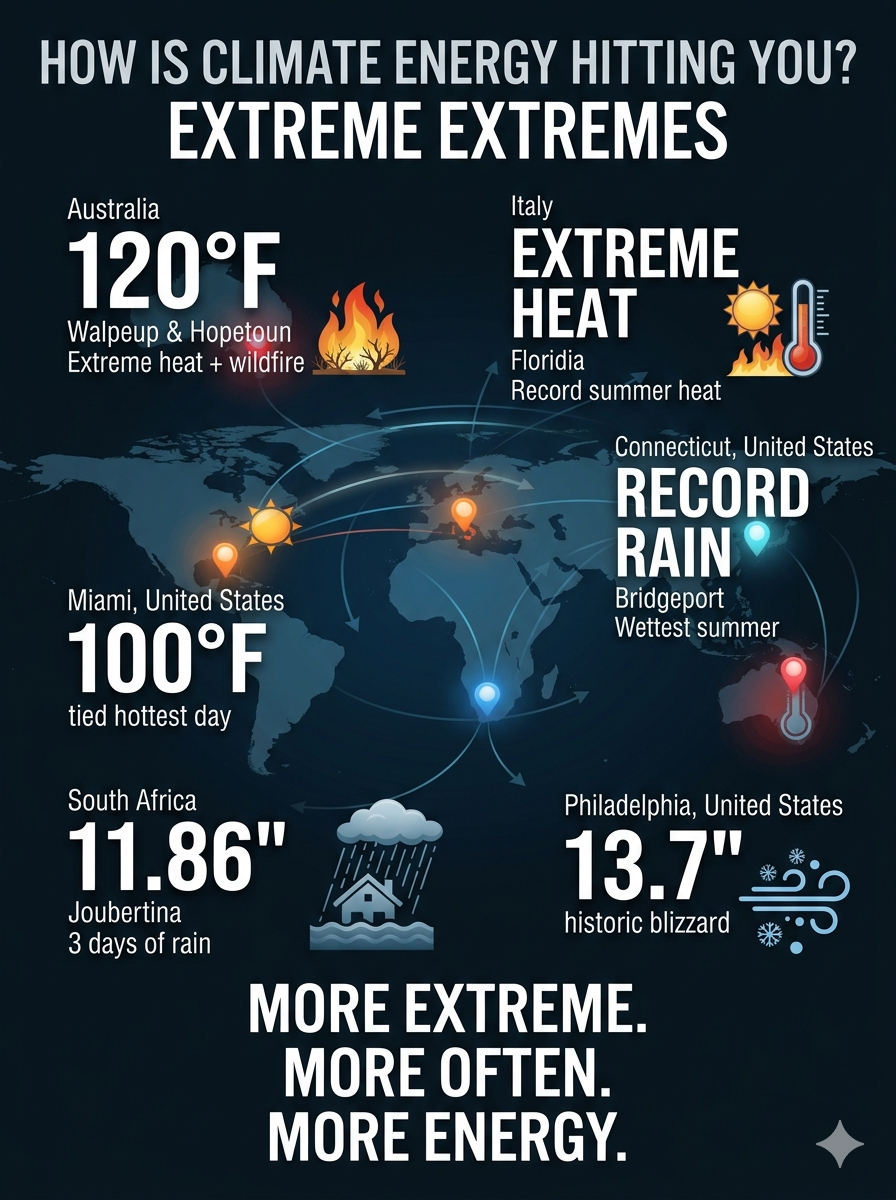
Extreme Extremes: Record Heat, Rain, Snow, and Flooding Around the World

Several towns and cities across the globe have broken or approached major historical extreme-weather records so far in 2026. From record-setting heat in Australia and Florida to extraordinary rainfall in South Africa and Connecticut—and a historic blizzard in Philadelphia—the pattern is increasingly difficult to characterize as ordinary weather variability.

🌡️ Extreme Heat & Wildfires

Walpeup and Hopetoun, Australia: In late January 2026, these two towns in Victoria baked under a staggering 48.9°C (120°F) during a catastrophic wildfire season, setting potential all-time temperature records for the region.

Floridia, Italy: This Sicilian town has continued to experience intense summer heat, drawing international attention as one of Europe’s extreme heat zones.

Miami, Florida: In August 2026, Miami officially tied its all-time hottest day on record at 100°F, another indication of how extreme heat is becoming an increasingly familiar feature of the climate.

🌧️ Torrential Rain & Flooding

Joubertina, South Africa: Between May 5 and May 8, 2026, an intense low-pressure system dumped a historic 301.2 mm (11.86 inches) of rain on the town in just three days, triggering devastating flash floods.

Bridgeport, Connecticut: In August 2026, Bridgeport recorded its wettest meteorological summer on record, following a relentless series of heavy downpours.

❄️ Severe Snow & Blizzards

Philadelphia, Pennsylvania: In late February 2026, a massive historic blizzard blanketed the region with 13.7 inches of snow, accompanied by intense, gale-force winds. It was the city’s most severe single-day snowfall event in a decade.

The Bigger Picture

These events span three continents and multiple climate extremes: record heat, wildfire conditions, torrential rainfall, flash flooding, extreme wetness, and major winter storms.

Climate change does not mean that every extreme-weather event is caused by climate change. It does mean that a warmer atmosphere and warmer oceans can alter the conditions in which these events develop—loading the climate system with additional energy and moisture and increasing the potential for extremes.

The question is no longer simply whether extreme weather is occurring.

The question is how much more extreme the extremes are becoming—and how quickly.

bookmark_borderHow Is Climate Energy Hitting You? Indiana and New York

by Daniel Brouse

Indiana and New York: When 1-in-1,000-Year Rain Becomes a Real-World Risk

The Changing Meaning of “Rare”

A “500-year flood” does not mean a flood that occurs only once every 500 years. It describes an event with an estimated 0.2% chance of occurring in any given year, based on historical and statistical assumptions.

The problem is that those assumptions can become outdated as climate conditions change.

Rainfall and flooding once considered extraordinarily rare are occurring more frequently in many regions. Events that infrastructure and communities were designed to withstand only once in a century—or once in several centuries—are increasingly being challenged by rainfall extremes outside the historical range.

The summer of 2026 provides another striking example.

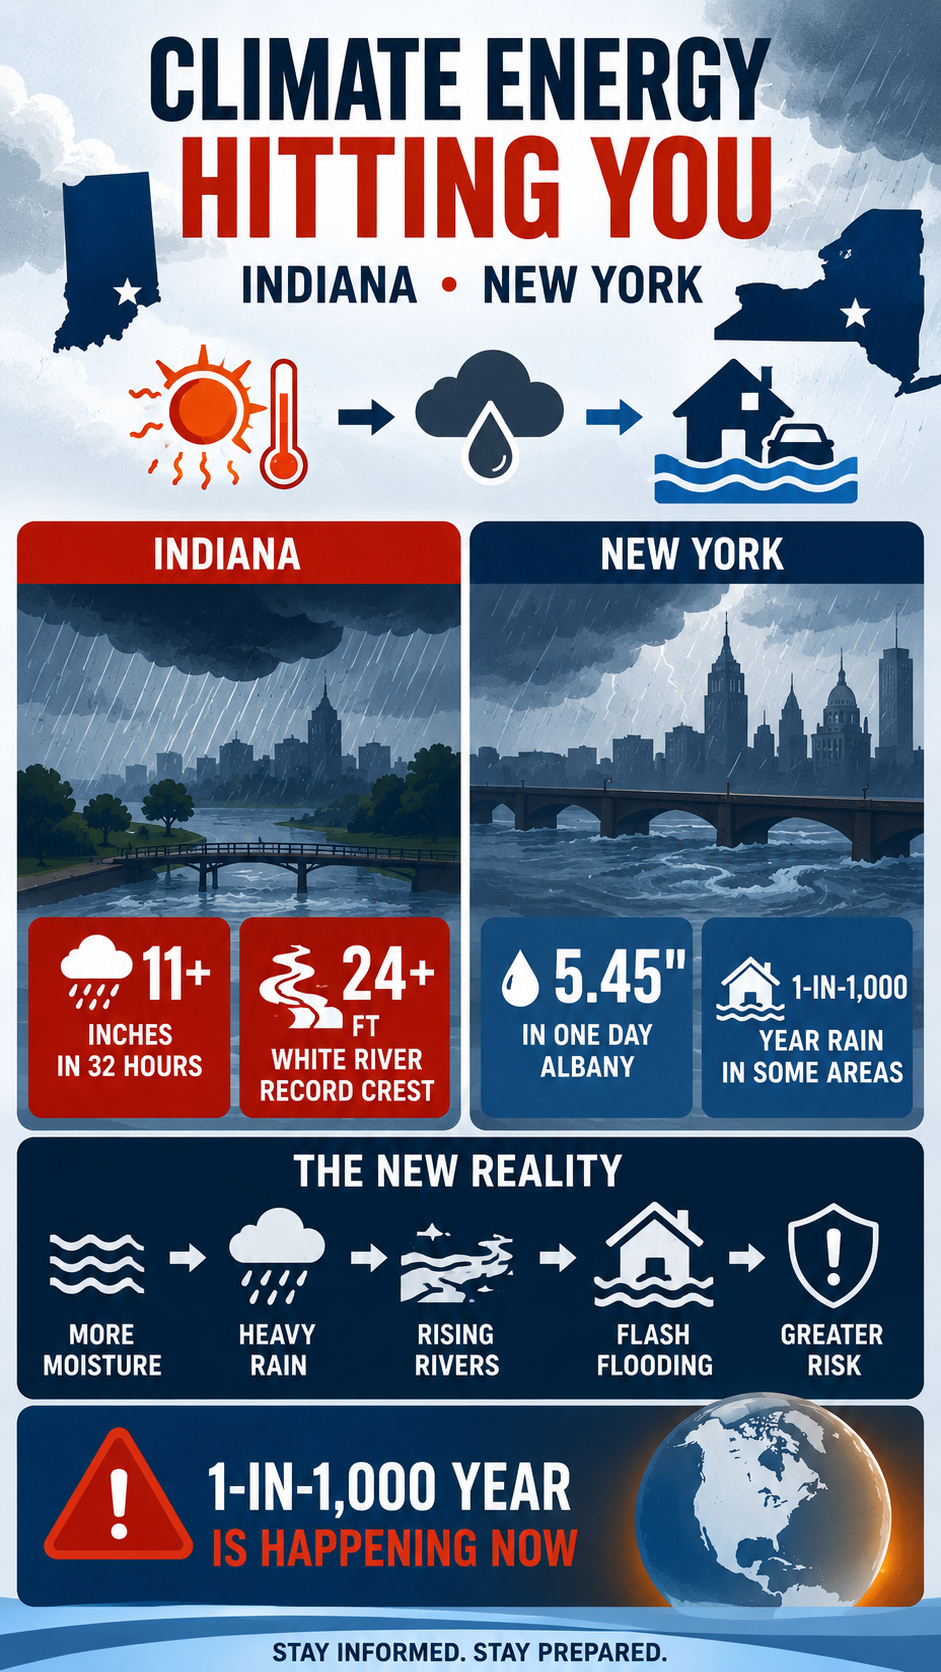
Indiana: Record Rainfall and a Record White River

In August 2026, central and east-central Indiana experienced a prolonged period of severe weather and extreme rainfall. A powerful derecho moved through the region on August 11, producing destructive winds, hail, and tornadoes. The storm was followed by repeated rounds of heavy thunderstorms that moved over already saturated ground.

The National Weather Service reported more than 11 inches of rain in some parts of central Indiana. New Castle recorded 11.24 inches at one observing site, while a location near New Lisbon recorded 11.50 inches over two days.

The result was catastrophic flooding.

The White River reached record levels at multiple locations. At Anderson, the river crested at 24.93 feet on August 14, breaking the previous record of 23.60 feet set during the Great Flood of 1913. At Noblesville, the river reached 24.60 feet on August 15, also breaking the 1913 record of 23.80 feet.

Roads were washed out, homes and businesses were flooded, and numerous water rescues were required. Indiana Governor Mike Braun declared a statewide disaster emergency and mobilized the Indiana National Guard.

The event was not simply a single downpour. A derecho was followed by repeated thunderstorms and persistent atmospheric moisture, allowing rainfall to accumulate over the same watersheds for several days. The National Weather Service described the resulting flooding in portions of central Indiana as catastrophic.

The Indiana Event

Location2026 ExtremeConsequence
New Castle / Henry CountyMore than 11 inches in roughly two daysSevere flash flooding
AndersonWhite River crest: 24.93 feetNew record, surpassing 1913
NoblesvilleWhite River crest: 24.60 feetNew record, surpassing 1913
Central and east-central IndianaMultiple rounds of heavy rainfallWashed-out roads, rescues, property damage

The significance is not simply that a rainfall record was broken. The larger concern is the interaction between extreme rainfall, saturated soils, repeated storms, and river response.

Once the ground is saturated, additional rainfall increasingly becomes runoff. That runoff rapidly enters streams and rivers, turning an extreme rainfall event into an extreme flood.

New York: Another 1-in-1,000-Year Rainfall Event

Indiana was not alone.

From July 28–30, eastern New York experienced an extraordinary heavy-rain event. The National Weather Service reported widespread rainfall totals of 6 to 12 inches, with localized amounts exceeding 11 inches. Rainfall rates reached 1 to 3 inches per hour, while thunderstorms repeatedly moved over the same areas.

At Albany, 5.45 inches of rain fell on July 29, shattering the previous daily record of 1.90 inches set in 1974. It was the wettest July day in Albany’s recorded history and the second-wettest calendar day overall.

More importantly, the National Weather Service classified rainfall in parts of eastern New York as a 1-in-1,000-year precipitation event. Schodack recorded 11.79 inches, while Kinderhook received 11.47 inches.

The New York Event

Location2026 ExtremeConsequence
Albany5.45 inches in one dayAll-time July daily rainfall record
Schodack11.79 inches1-in-1,000-year precipitation event
Kinderhook11.47 inches1-in-1,000-year precipitation event
Eastern New York6–12 inches widespreadMajor flash flooding

This distinction matters: Albany’s 5.45-inch rainfall was a record, while the 1-in-1,000-year classification applied to portions of the broader eastern New York event.

The Pattern Is Bigger Than a Single Storm

Both Indiana and New York illustrate an important feature of a warming climate: more atmospheric moisture can amplify the intensity of extreme precipitation.

A warmer atmosphere can hold more water vapor—roughly 7% more for every 1°C of warming under the Clausius-Clapeyron relationship.

That does not mean every storm produces 7% more rain. But when atmospheric conditions concentrate and release that additional moisture, rainfall rates can become extreme.

The consequences can compound:

More atmospheric moisture

↓

Higher potential rainfall rates

↓

Repeated heavy thunderstorms

↓

Saturated soils

↓

Rapid runoff

↓

Flash flooding and river flooding

↓

Infrastructure failure and displacement

This is one mechanism through which climate energy becomes a direct physical hazard.

Indiana and New York: From Heat to Flood

The same atmospheric system that stores additional heat and moisture can contribute to seemingly contradictory extremes.

A persistent ridge or heat dome can produce oppressive heat and increase atmospheric moisture demand. When the weather pattern breaks—or when a front, upper-level disturbance, or convective system provides the mechanism for release—the accumulated moisture can produce intense rainfall.

This creates what can be described as hydroclimatic whiplash:

Heat → moisture accumulation → atmospheric instability → extreme rainfall → flooding → rapid transition to another extreme

The sequence is not necessarily a simple one-to-one causal chain. Weather systems remain complex, and individual floods cannot automatically be attributed to climate change without event-specific attribution analysis.

But the physical ingredients are becoming increasingly important: warmer air, greater atmospheric moisture, intense precipitation, saturated soils, and infrastructure designed around historical climate statistics.

New York’s August Severe Weather

The pattern continued into August.

On August 20, severe storms struck the New York metropolitan region and Long Island. A waterspout moved onshore at Atlantic Beach and became a tornado, damaging beach-club structures. Severe flooding also affected Queens and other parts of the region, while emergency responders rescued people from flooded vehicles.

These events occurred within the same summer that eastern New York had already experienced its extraordinary July rainfall.

That is important because climate risk is not simply about isolated record events. Repeated extremes can compound damage.

A community does not have to experience a 1-in-1,000-year event every year to experience a radically different risk environment. A sequence of less-extreme events can saturate soils, overwhelm drainage systems, damage infrastructure, and leave communities increasingly vulnerable when the next storm arrives.

Climate Energy Hitting the Ground

Indiana and New York demonstrate two sides of the same problem.

The atmosphere is not merely becoming warmer. A warmer atmosphere can interact with the water cycle, storm dynamics, soil moisture, rivers, infrastructure, and ecosystems in ways that amplify consequences.

The important question is therefore not simply:

“How often does a 1-in-1,000-year event occur?”

It is:

“What happens when the climate that produced our historical risk statistics is no longer the climate we are living in?”

A 1-in-1,000-year rainfall event is supposed to be extraordinarily rare.

When multiple regions begin experiencing events classified at that level, the lesson is not that every “1-in-1,000-year” event has suddenly become a once-per-year event.

The lesson is that the baseline is changing—and the consequences of that change are already reaching communities, rivers, roads, homes, farms, and public infrastructure.

That is climate energy hitting you where you live.

bookmark_borderHow Is Climate Energy Hitting You? Socio-Economic-Ecological Feedbacks

by Daniel Brouse

From Biodiversity to Monoculture: The Socio-Economic-Ecological Feedback Loop

Climate change is often described as a problem of rising temperatures, but temperature is only one expression of the additional energy entering the Earth system.

That energy moves through the atmosphere, hydrologic cycle, soils, vegetation, ecosystems, agriculture, forests, and human economies. As each system responds, it can alter the conditions experienced by the others.

This creates feedback loops.

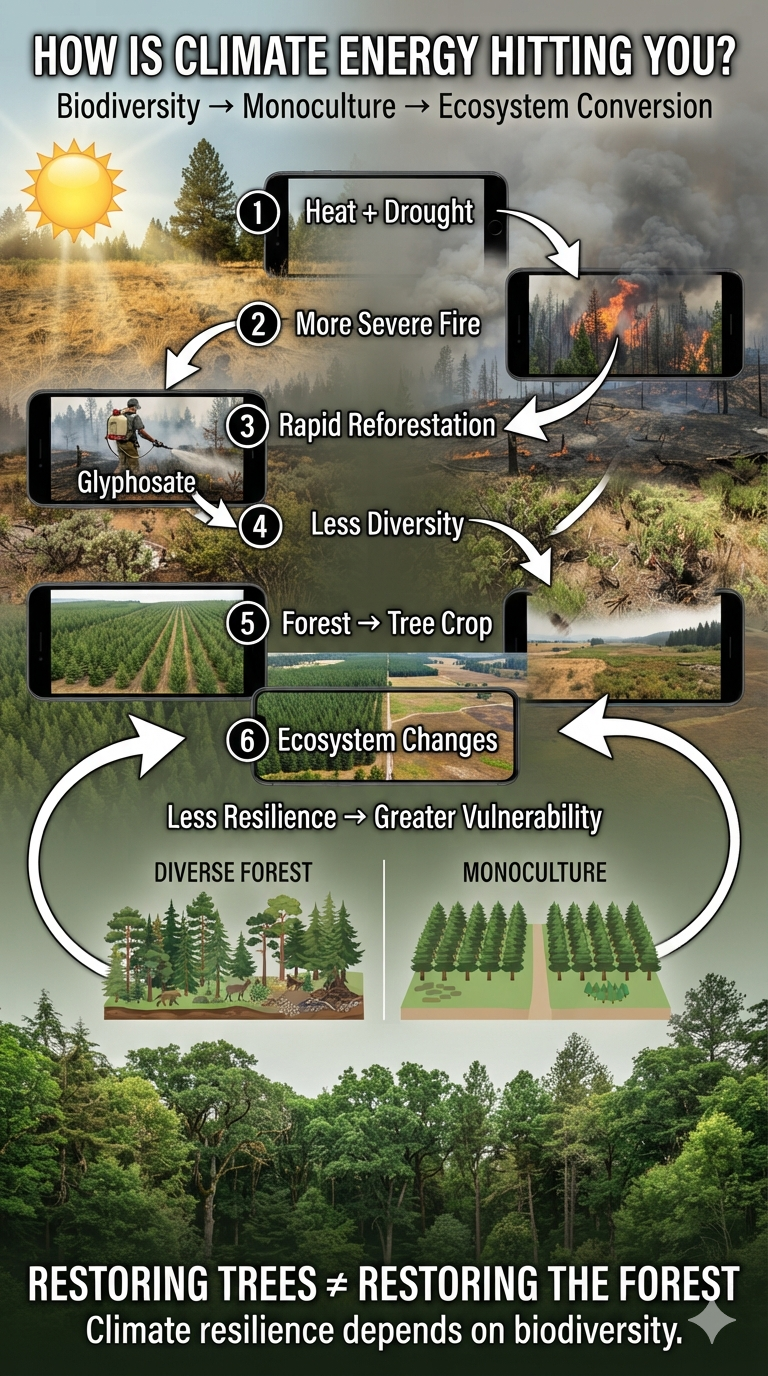
A recent investigation by the Center for Investigative Reporting found that glyphosate is being sprayed in California forests at record levels. The U.S. Forest Service, timber companies, and other land managers use glyphosate after wildfire or timber harvest to suppress competing vegetation and improve the establishment of commercially valuable conifers.

At first glance, this may appear to be a straightforward forestry practice: kill competing plants, plant trees, and accelerate forest recovery.

But viewed through the lens of climate-system dynamics, it raises a much larger question:

What happens when our response to climate disruption further simplifies the ecosystems we depend upon for resilience?

Climate Energy Is Changing the Recovery Environment

Western forests are already experiencing a combination of higher temperatures, increasing atmospheric moisture demand, changing precipitation and snowpack, declining soil moisture, drought stress, and increasingly severe wildfire.

Our earlier paper, Western U.S. Woodlands Ecosystem Conversion, examines what happens when these pressures push a forest beyond its ability to regenerate.

A forest can experience increasing stress for years without an obvious transformation. Then a threshold can be crossed.

Trees die.

Seed sources disappear.

Regeneration fails.

Shrubs and grasses occupy the landscape.

The ecosystem begins transitioning from one state to another.

As the paper explains, under moderate emissions scenarios, up to 40% of western conifer forests could convert to shrubland or grassland by 2100.

That is not simply forest damage.

It is ecosystem conversion.

And once we recognize that distinction, the economics of post-fire forest management look different.

The Economics of Reforestation

After a major wildfire, rapidly growing shrubs, grasses, ferns, and deciduous vegetation can compete with planted conifer seedlings for water, nutrients, and sunlight.

From a timber-production perspective, that competition is a problem.

Glyphosate provides an efficient way to remove it.

The Forest Service has used herbicide treatments as part of regeneration efforts because suppressing competing vegetation can improve the early survival and growth of desired seedlings. Forest research acknowledges that this is one reason herbicides have been used in reforestation.

The economic objective is therefore understandable:

reduce competition → increase seedling survival → accelerate timber production.

But that is not necessarily the same objective as:

restore biodiversity → restore ecological function → increase climate resilience.

Those two objectives can overlap.

They can also conflict.

A Forest Is Not a Tree Farm

The distinction matters because a forest is not simply a collection of trees.

A functioning forest contains an enormous biological network:

  • multiple tree species
  • shrubs
  • grasses
  • flowering plants
  • fungi and mycorrhizal networks
  • insects and pollinators
  • birds
  • mammals
  • reptiles and amphibians
  • soil organisms
  • decomposers
  • streams and wetlands
  • genetic diversity

Each component participates in the functioning of the ecosystem.

When glyphosate is applied to eliminate “competing” vegetation, those plants are competitors only from the perspective of the desired crop.

From the perspective of the ecosystem, they may be food, shelter, habitat, soil cover, pollinator resources, firebreaks, nutrient sources, or participants in water and carbon cycling.

This creates a fundamental difference between restoration and production.

Production asks:

How efficiently can we produce the desired commodity?

Ecological restoration asks:

How effectively can we restore the biological relationships that make the ecosystem resilient?

Biodiversity Is Infrastructure

Biodiversity is often treated as an aesthetic or conservation issue.

It is much more than that.

Biodiversity is a form of ecological infrastructure.

Different species respond differently to drought, heat, insects, disease, fire, and changing precipitation. A diverse ecosystem therefore contains multiple biological responses to disturbance.

If one species performs poorly, another may survive.

If one food source disappears, another may remain.

If one plant cannot regenerate under new climatic conditions, another may occupy the available ecological niche.

This is one reason biological diversity can provide resilience.

A simplified ecosystem has fewer alternatives.

A diverse ecosystem has more.

That distinction becomes increasingly important as climate variability increases.

From Biodiversity to Monoculture

The problem becomes more obvious when forestry is compared with modern industrial agriculture.

Large-scale agriculture often relies on monocultures: enormous areas devoted to a single crop or a very small number of genetically similar crops. Monoculture creates economic efficiencies. Machines can plant, fertilize, spray, harvest, and transport a standardized product at enormous scale. But biological simplification creates vulnerabilities.

A pest that specializes in the crop has an enormous continuous food supply. A disease can spread rapidly through genetically similar plants. Soil nutrients can become depleted. Pollinator and insect diversity can decline. Herbicide and pesticide dependence can increase.

The economic system becomes increasingly dependent upon external inputs to maintain productivity.

The result can be a feedback loop:

biodiversity declines → ecological resistance declines → pests and disease become more consequential → chemical inputs increase → biodiversity declines further.

This is not an argument that all monoculture agriculture inevitably fails.

It is an argument that efficiency and resilience are not the same thing.

The same distinction applies to forestry.

The Forest Monoculture

When post-fire management suppresses naturally regenerating vegetation in order to establish commercially desirable conifers, the landscape can move toward a forest plantation rather than a naturally regenerating forest.

A plantation can contain thousands of trees and still possess considerably less biodiversity than the ecosystem it replaced.

This creates a dangerous semantic trap. We see trees. We call it a forest. But ecological function depends upon far more than tree cover.

A plantation of one or a few commercially valuable species can look green from above while functioning very differently from a diverse forest.

And in a warming climate, that distinction can become critical.

Ecosystem Conversion Versus Reforestation

This is where the concept of ecosystem conversion becomes important.

Suppose a severe wildfire destroys a mature conifer forest.

The original ecosystem does not necessarily return.

Under the warmer and drier conditions described in my Western U.S. Woodlands paper, grasses and shrubs may become better adapted to the post-fire environment than the trees that previously occupied it.

The landscape may therefore transition:

forest → wildfire → shrubland/grassland

That is climate-driven ecosystem conversion.

Now introduce intensive human intervention:

forest → wildfire → herbicide → removal of natural competitors → planted conifers → managed timber plantation

This is something different.

The second pathway is not simply allowing the ecosystem to respond to its new climate. It is imposing an economic land-use objective upon that response. That distinction should be explicit in public policy.

The Carbon Question

There is another important distinction. A green landscape is not necessarily equivalent to the forest that existed before. Grasslands and shrublands photosynthesize and absorb carbon.

So do plantations.

But carbon uptake is not the same thing as carbon storage.

A mature forest contains carbon in:

  • trunks
  • branches
  • roots
  • dead wood
  • forest soils
  • long-lived biomass

The Ecosystem Conversion paper makes this distinction explicitly:

carbon uptake ≠ carbon storage capacity

and

positive carbon flux ≠ preservation of the previous carbon stock.

A plantation may therefore satisfy a narrow definition of reforestation while failing to reproduce the carbon reservoir, biodiversity, hydrology, and ecological complexity of the original forest.

The Glyphosate Feedback

This brings us back to glyphosate. The current controversy is not simply about a herbicide. It is about the interaction between climate disruption, economic incentives, land management, biodiversity, and ecosystem resilience.

The emerging feedback looks something like this:

Climate warming

↓

Heat + drought + atmospheric moisture demand

↓

More severe wildfire

↓

Loss of mature forest

↓

Economic pressure to recover timber production

↓

Herbicide use to suppress competing vegetation

↓

Reduced vegetation diversity

↓

Simplified forest structure

↓

Greater dependence on managed inputs

↓

Potentially reduced ecological resilience

↓

Greater vulnerability to future climate disturbances

This does not mean glyphosate necessarily causes every subsequent step.

The feedback is systemic.

The larger point is that a management strategy designed to optimize one component of a complex system can unintentionally weaken other components.

The Scientific Evidence Must Be Independent

There is also a legitimate question about the evidence used to evaluate glyphosate. The recent investigation found that a study heavily relied upon by the Forest Service in assessing glyphosate safety was subsequently retracted after concerns about Monsanto’s involvement in the research process.That does not establish that every use of glyphosate is unsafe. It does establish why the underlying evidence should be independently reviewed.

When government policy determines what chemicals can be sprayed across public landscapes, the scientific foundation for those decisions should be exceptionally transparent.

Public land requires public confidence. And public confidence requires independent science.

From Wildfire Recovery to a National Policy

The issue also has a national economic dimension.

On February 18, 2026, President Donald Trump signed an executive order titled “Promoting the National Defense by Ensuring an Adequate Supply of Elemental Phosphorus and Glyphosate-Based Herbicides.”

The order invokes the Defense Production Act and directs federal action to ensure an adequate domestic supply of glyphosate-based herbicides. That places glyphosate within a much larger economic framework involving agriculture, forestry, chemical manufacturing, supply chains, and national security.

The feedback becomes:

climate disruption → increased agricultural and forestry stress → greater dependence on chemical intervention → greater economic importance of chemical production → stronger incentives to maintain chemical availability.

The system becomes self-reinforcing.

The Bigger Problem: Optimizing the Wrong Variable

Climate change forces us to rethink what we mean by efficiency. A system can be economically efficient while being ecologically fragile. A monoculture can produce enormous quantities of a commodity while containing very little biological diversity. A plantation can produce timber while failing to reproduce the ecological functions of a natural forest. A landscape can be covered in green vegetation while holding substantially less carbon than the forest it replaced. And a post-fire intervention can accelerate tree planting while simultaneously simplifying the ecosystem that must survive the next climate shock.

The central question is therefore not:

How quickly can we replace the trees we lost?

It is:

What kind of ecosystem will survive the climate that is coming?

The Resilience Test

Climate change is increasing the importance of resilience.

A resilient ecosystem does not necessarily maximize production under ideal conditions.

It maintains function when conditions become abnormal.

That means diversity matters.

Species diversity.

Genetic diversity.

Structural diversity.

Age diversity.

Habitat diversity.

Landscape diversity.

Biological diversity is effectively a portfolio of responses to uncertainty.

Industrial systems tend to reduce that diversity because standardization creates efficiency.

Climate instability does the opposite.

It increases the value of diversity.

That creates one of the central contradictions of the climate era:

The more unstable the climate becomes, the more we need ecological diversity—and the more economic pressure we may face to simplify ecosystems for efficiency.

Climate Energy Is Hitting the Whole System

This is ultimately what I mean by How Is Climate Energy Hitting You?

Climate energy does not stop with a thermometer reading or a measurement of atmospheric carbon dioxide. It moves through the entire coupled human-Earth system.

Heat changes water demand.

Water stress changes forests.

Forest stress changes wildfire.

Wildfire changes ecosystems.

Ecosystem disruption changes economic decisions.

Economic decisions change land management.

Land management changes biodiversity.

Biodiversity changes resilience.

And declining resilience feeds back into the next disturbance.

The resulting system is not a collection of unrelated environmental problems. It is a coupled socio-economic-ecological feedback system in which changes in one component propagate through the others.

Wildfire becomes an economic loss.

Economic loss creates pressure for rapid recovery.

Rapid recovery creates demand for herbicides, machinery, labor, and planted timber.

Those interventions alter ecosystems.

Altered ecosystems influence water, biodiversity, soil, carbon storage, and future fire behavior.

Government policy can then reinforce the economic system that produced the intervention in the first place.

The feedback can therefore become self-reinforcing.

The challenge is to recognize when a short-term economic solution becomes a long-term ecological feedback.

That distinction becomes especially important when an ecosystem crosses a threshold. Restoring the trees may not be the same thing as restoring the forest.

And once biodiversity has been converted into monoculture, replanting the landscape does not necessarily recreate the ecosystem that was lost.

Climate change is not simply changing the weather.

It is changing the decisions we make about the world around us—and those decisions can become feedbacks that determine how resilient that world remains.