Introduction
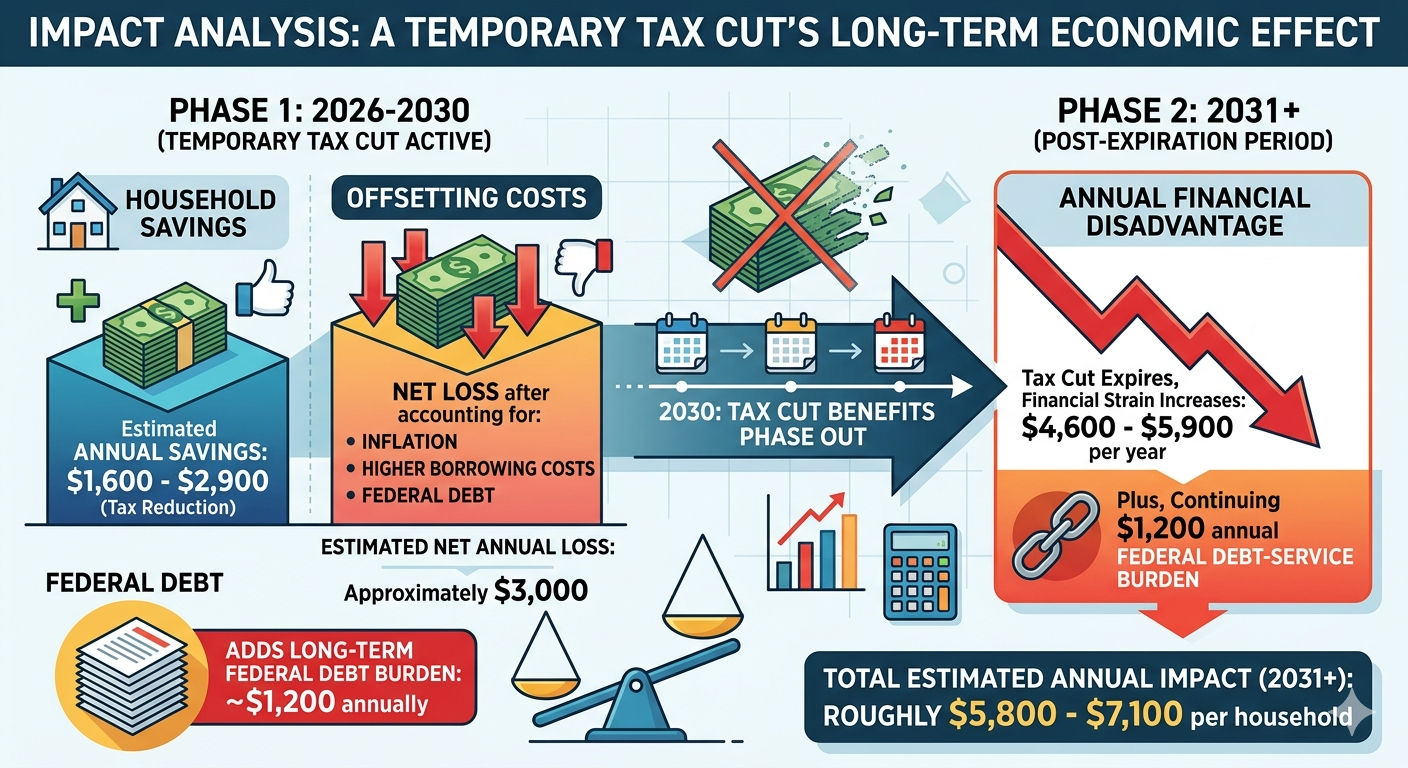
A tax cut that appeared to provide the average household with $1,600–$2,900 in annual savings was more than offset by the broader economic effects of inflation, higher borrowing costs, and increased federal debt. After accounting for these costs, the average household experienced an estimated net loss of approximately $3,000 per year, along with an additional long-term federal debt burden equivalent to roughly $1,200 annually.
However, the tax cut benefits are scheduled to phase out by 2030, meaning households will eventually lose the temporary savings while many of the costs associated with higher debt, interest payments, and elevated borrowing rates remain. Beginning in 2031, when the tax reduction expires, the average household’s annual financial disadvantage could increase to approximately $4,600–$5,900 per year, plus the continuing $1,200 annual federal debt-service burden. This would place the total estimated impact at roughly $5,800–$7,100 per household annually, while the accumulated federal debt continues to shift additional costs onto future taxpayers.
Tax Cuts vs. Inflation: The Hidden Battle Over Household Purchasing Power
Tax cuts are often promoted as a direct way to improve household finances, but for the average American family, inflation can have a much larger and more immediate impact on financial well-being. A tax cut may provide a noticeable boost to income, but a sustained period of elevated inflation can quietly reduce purchasing power by thousands of dollars each year.
For a typical middle-income household, a broad tax reduction might save several hundred to a few thousand dollars annually. However, inflation affects the entire household budget—including housing, groceries, utilities, transportation, healthcare, and services. A 4%–5% annual inflation rate can easily increase household expenses by $3,500–$5,000 per year, effectively overwhelming the benefit of many tax cuts.
The result is a simple economic reality: a dollar gained through tax cuts can be offset—or even erased—by dollars lost through higher prices.
The Mathematical Mismatch: Tax Savings vs. Inflation Costs
Tax Cuts Provide Limited Annual Gains
For most middle-class households, federal tax cuts typically produce moderate savings rather than dramatic changes in disposable income. Historical analyses of broad tax packages, including evaluations by organizations such as the Tax Policy Center, have shown that middle-income families often receive annual tax reductions in the range of roughly $1,600 to $2,900, depending on the structure of the legislation. The most recent tax cuts saved the average household $1,600 and $2,900.
While meaningful, these savings represent only a fraction of a household’s total annual expenses.
Inflation Acts Like a Hidden Tax
Inflation operates differently from taxes. Rather than reducing a paycheck directly, it increases the cost of nearly everything a household buys.
A family spending $80,000 annually on goods and services would experience approximately:
- 4% inflation: about $3,200 in additional annual costs
- 5% inflation: about $4,000 in additional annual costs
- 6% inflation: about $4,800 in additional annual costs
Unlike a tax cut, which may provide a one-time or annual benefit, inflation compounds year after year. Even if wages rise, households can still lose purchasing power if prices increase faster than incomes.
Distribution of Benefits vs. Distribution of Burdens
Tax Cuts Often Deliver Larger Dollar Benefits to Higher-Income Households
Income tax reductions generally scale with taxable income. Higher-income households typically pay more in taxes, so percentage-based tax cuts often produce larger dollar savings at the top.
Analyses from organizations such as the Congressional Budget Office have repeatedly shown that broad tax changes frequently provide the largest absolute benefits to higher-income groups, while middle- and lower-income households receive smaller dollar amounts.
Inflation Disproportionately Hurts Lower- and Middle-Income Families
Inflation is often described as a regressive economic force because it affects essential spending categories that consume a larger share of lower-income household budgets.
A wealthy household can often absorb higher prices by reducing discretionary spending or shifting purchases. A working-class family has fewer options when facing increases in:
- Food prices
- Rent or mortgage payments
- Electricity and heating costs
- Gasoline and transportation
- Healthcare expenses
For families living close to their monthly budget limits, inflation functions like a pay cut.
The Inflation Feedback Loop
Tax cuts can stimulate economic activity by increasing disposable income. However, if tax reductions are not matched by spending reductions or productivity gains, they can increase demand in an economy already operating near capacity.
The mechanism is straightforward:
- Tax cuts increase household disposable income.
- Increased income boosts consumer demand.
- If supply cannot expand quickly enough, businesses raise prices.
- Higher prices reduce the purchasing power of the original tax cut.
In this scenario, households may receive additional money in their paycheck while simultaneously paying more at the grocery store, gas station, and utility bill.
The economic benefit becomes partially or completely offset by rising prices.
The Federal Debt Effect: How Tax Cuts Can Increase Long-Term Costs
Tax cuts also have a broader economic impact beyond the immediate benefit to taxpayers. When tax reductions are not accompanied by equivalent spending reductions or stronger economic growth, they increase the federal budget deficit and add to the national debt. The government must finance that additional debt by issuing more Treasury securities, increasing the supply of government borrowing.
As federal debt rises, the government competes with households and businesses for available capital. This increased demand for borrowed money can place upward pressure on interest rates, raising the cost of mortgages, auto loans, credit cards, business financing, and other forms of credit.
The effect is often indirect but significant. A household may receive a $2,000 annual tax reduction, but if higher federal borrowing contributes to even a modest increase in interest rates, that same family may pay thousands of dollars more over time through:
- Higher mortgage rates when purchasing or refinancing a home
- Increased interest on auto loans
- Higher credit card balances
- More expensive consumer financing
- Higher costs passed through by businesses borrowing at elevated rates
For example, a 1% increase in mortgage rates on a $300,000 home loan can add roughly $200 per month to a typical 30-year mortgage payment—more than $2,000 annually. Across the economy, higher interest rates also increase the federal government’s own debt-service costs, requiring more taxpayer dollars to pay interest rather than fund public services or reduce future deficits.
This creates a potential feedback loop:
- Tax cuts reduce federal revenue.
- Larger deficits increase government borrowing.
- Higher debt levels put upward pressure on interest rates.
- Higher rates increase borrowing costs for households, businesses, and the government.
- Additional interest expenses reduce the long-term economic benefit of the original tax cut.
The ultimate measure of a tax policy is therefore not only the size of the immediate tax reduction, but its effect on total household purchasing power after accounting for inflation, interest rates, and the long-term cost of increased federal debt.
The Role of Bracket Creep
Inflation also affects taxation through a process known as bracket creep.
As wages rise due to inflation, taxpayers can unintentionally move into higher tax brackets even though their real purchasing power has not increased. To address this, the Internal Revenue Service adjusts federal income tax brackets, standard deductions, and other thresholds annually for inflation.
These adjustments prevent inflation from automatically increasing a household’s tax burden. However, they do not compensate for the broader loss of purchasing power caused by rising prices.
Inflation indexing protects taxpayers from paying higher taxes simply because of inflation—it does not make groceries, housing, or energy affordable again.
Conclusion: The True Measure Is Total Economic Impact
Tax cuts can provide meaningful benefits to households, but their true economic value cannot be measured by the size of the immediate reduction in a tax bill alone. A complete evaluation must consider the broader effects on purchasing power, inflation, interest rates, and the long-term federal debt burden.
A tax cut may increase disposable income in the short term, but those gains can be diminished or even erased when inflation raises the cost of everyday necessities such as housing, food, energy, and transportation. Unlike a one-time tax reduction, inflation affects the entire household budget and compounds over time, reducing what each dollar can actually buy.
The impact also depends on how tax cuts are financed. When reductions in federal revenue are not matched by spending cuts or sufficient economic growth, they increase budget deficits and add to the national debt. Higher federal borrowing can place upward pressure on interest rates, increasing costs for mortgages, auto loans, credit cards, and business financing. Households may receive additional money through lower taxes while simultaneously paying more through higher borrowing costs and rising prices.
This creates a broader economic equation:
The benefit of a tax cut is not simply the dollars returned to taxpayers—it is the change in real purchasing power after accounting for inflation, interest rates, and future debt obligations.
For some households, especially higher-income taxpayers, tax reductions may provide substantial direct benefits. However, for many middle- and lower-income families, the effects of inflation and higher interest rates can outweigh those gains because they spend a larger share of their income on necessities and borrowing costs.
The ultimate question is therefore not:
“How much did taxpayers save in taxes?”
The more important question is:
“Did households become financially better off after accounting for the full economic consequences?”
A sustainable economic policy must balance tax relief with fiscal responsibility, price stability, and long-term economic growth. Without that balance, a tax cut can create the appearance of increased prosperity while shifting costs into higher prices, higher interest payments, and a larger debt burden for future generations.
ADDENDUM
The exact “net cost” depends on the household’s income, debt exposure, and whether the tax cuts are financed by borrowing. A reasonable estimate can be made by separating immediate annual effects from long-term debt effects.
Estimated Annual Impact on an Average Household
| Item | Annual Impact |
|---|---|
| Tax cut benefit | +$1,600 to +$2,900 |
| 4% inflation increase in household expenses | −$3,200 |
| Higher mortgage costs (if buying/refinancing) | −$2,000+ |
| Higher auto loan, credit card, and consumer financing costs | −$500 to −$2,000+ |
| Higher business borrowing costs passed through in prices | −$300 to −$1,000+ |
| Additional federal debt interest burden | −$900 to −$1,500+ annually (estimated) |
Short-Term Net Effect (First-Year Estimate)
Lower-cost scenario:
- Tax savings: +$2,900
- Inflation cost: −$3,200
- Consumer borrowing/business costs: −$800
- Debt interest effect: −$900
Net impact: approximately −$2,000 per household per year
Higher-cost scenario:
- Tax savings: +$1,600
- Inflation cost: −$3,200
- Mortgage/borrowing costs: −$3,000
- Debt interest effect: −$1,500
Net impact: approximately −$6,100 per household per year
Long-Term Federal Debt Effect
If tax cuts add $3–$5 trillion to federal debt:
- There are roughly 130 million U.S. households.
- The added debt equals approximately:
130 million households$3 trillion≈$23,000 per household130 million households$5 trillion≈$38,000 per household
That does not mean each household receives a bill, but it represents the additional federal liability ultimately supported by taxpayers.
If the government pays roughly 4% interest on that additional debt:
- $3 trillion × 4% = $120 billion/year
- $5 trillion × 4% = $200 billion/year
Spread across households:
- $900–$1,500 per household annually in additional federal interest costs
Over decades, if the debt is refinanced and interest compounds, the total burden can become substantially larger.
Other Potential Costs Associated With Large Tax Cuts
1. Reduced fiscal flexibility
Higher debt can limit the government’s ability to respond to:
- recessions
- natural disasters
- pandemics
- military emergencies
- infrastructure needs
Future taxpayers may face higher taxes or spending cuts to service the debt.
2. Higher interest rates
Large deficits can increase demand for borrowed funds, putting upward pressure on interest rates. This affects:
- mortgages
- business loans
- student loans
- auto loans
- government borrowing costs
3. Crowding out private investment
When the government absorbs more available capital:
- businesses may invest less
- productivity growth can slow
- wage growth may weaken over time
4. Inflation risk
If tax cuts increase demand without increasing supply, they can contribute to inflationary pressure, especially when the economy is already near capacity.
Estimated Net Household Effect
| Time Frame | Estimated Impact |
|---|---|
| Immediate annual effect | −$2,000 to −$6,000 per household |
| Added federal debt liability | +$23,000 to +$38,000 per household |
| Annual debt-service burden | −$900 to −$1,500 per household/year |
Bottom Line
A tax cut that appeared to provide an average household with $1,600–$2,900 in annual savings was far outweighed by the broader economic effects of inflation, higher borrowing costs, and increased federal debt. The average household had a net loss of $3,000 and an additional debt burden of $1,200/year. For many households, the combined impact may represent a net financial loss of several thousand dollars per year, while the long-term debt burden shifts additional costs onto future taxpayers.