by Daniel Brouse and Sidd Mukherjee
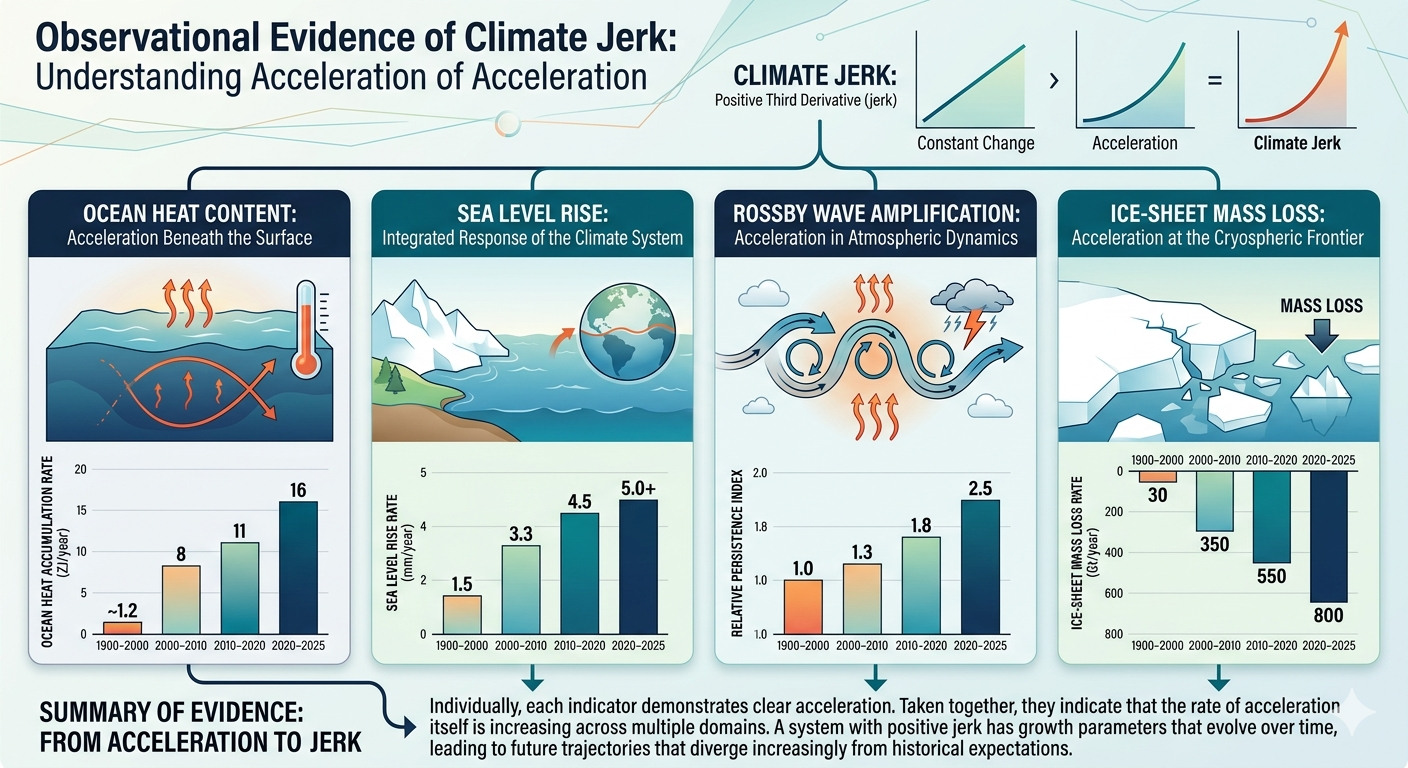
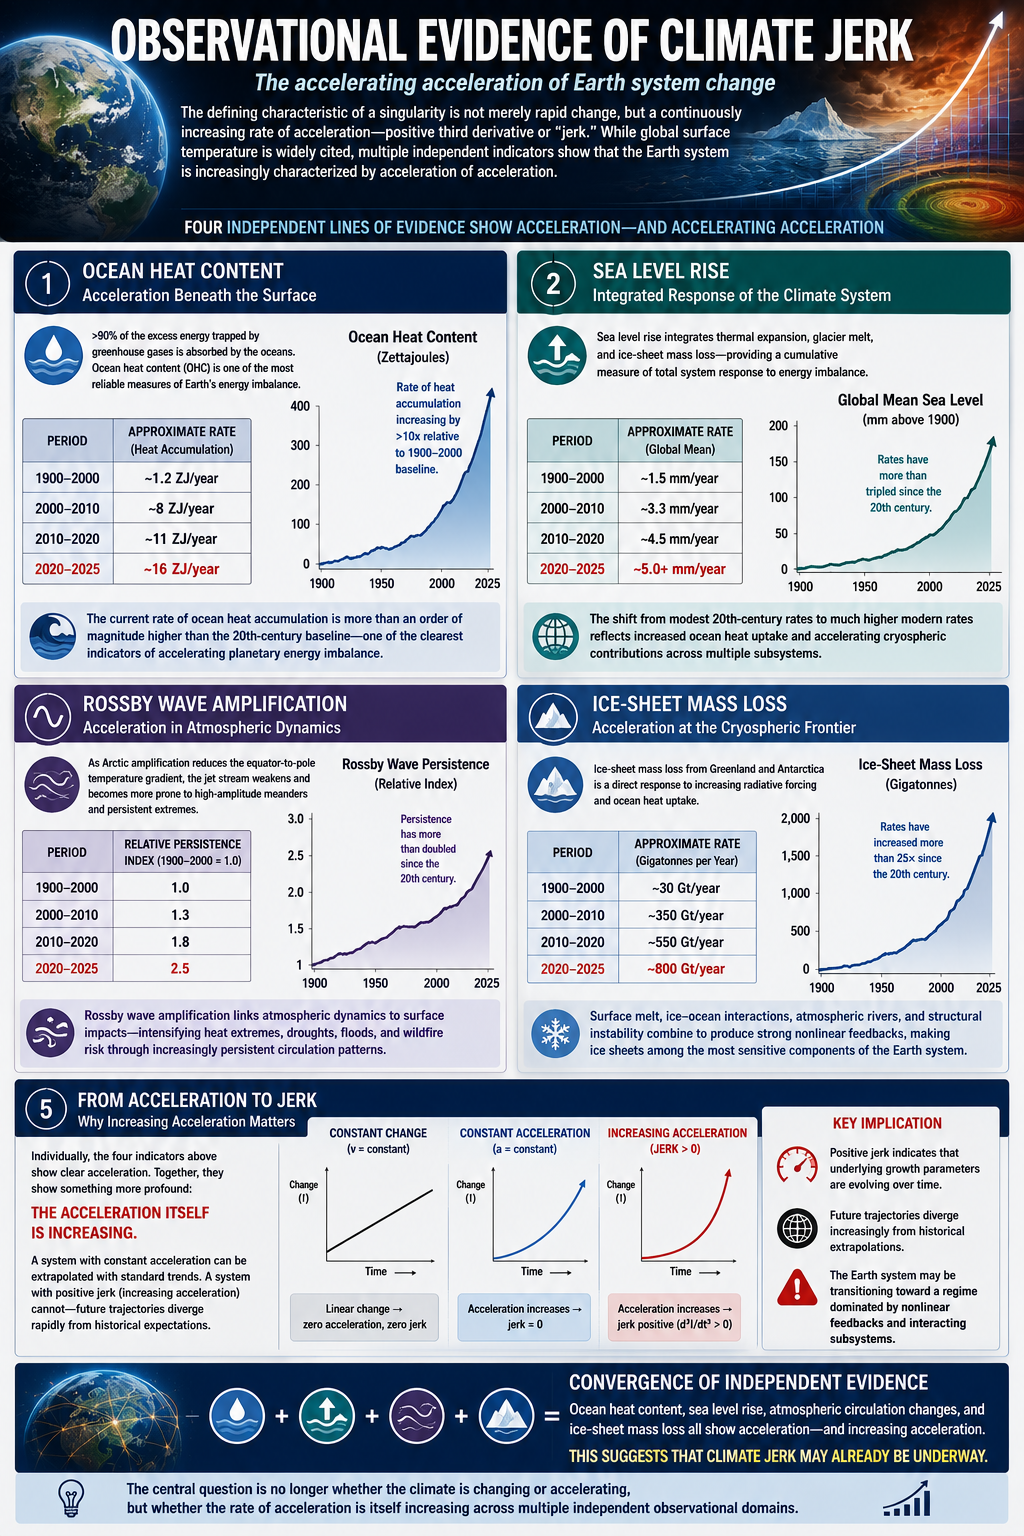
The defining characteristic of a singularity is not merely rapid change, but a continuously increasing rate of acceleration. In mathematical terms, the system exhibits a positive third derivative—commonly referred to as “jerk.” While global surface temperature remains the most widely cited climate metric, several other indicators provide clearer evidence that the Earth system is increasingly characterized not simply by change or acceleration, but by acceleration of acceleration.
Among the strongest candidates are extreme flood risk, ocean heat content, sea level rise, Rossby wave amplification, and ice-sheet mass loss.
Flood Jerk: The Acceleration of Extreme Flood Risk
One of the clearest examples of climate jerk—the acceleration of acceleration—can be observed in the changing frequency of extreme flood events.
In the 1990s, what was considered a “500-year flood” was expected to occur, on average, once every five centuries. Such events represented the extreme tail of the hydrological distribution and were considered exceptionally rare. By the early 2000s, however, many flood events of comparable magnitude were being reclassified as 100-year floods as historical precipitation records and flood-frequency analyses were updated.
The trend did not stop there.
By the 2020s, floods once considered 100-year events increasingly resembled 10-year events. In some regions, comparable rainfall and flooding episodes are now occurring every few years. What was once considered an extraordinary outlier has become part of the emerging climatological baseline.
This progression represents far more than a simple increase in flood frequency. It suggests that the rate at which flood probabilities are changing is itself accelerating.
From Flood Acceleration to Flood Jerk
Traditional climate assessments often focus on changes in average precipitation. However, flooding is driven disproportionately by extreme rainfall events, atmospheric river activity, storm persistence, and moisture availability in the atmosphere.
Several physical mechanisms contribute to this accelerating trend:
-
A warmer atmosphere holds approximately 7% more water vapor for every 1°C of warming.
-
Ocean heat content continues to increase, providing additional energy and moisture to storm systems.
-
Amplified Rossby waves and slower-moving weather patterns increase rainfall persistence.
-
Atmospheric rivers transport larger volumes of water vapor over longer durations.
-
Urbanization and land-use changes can further amplify runoff and flood impacts.
Together, these factors create a nonlinear response in flood risk. Rainfall extremes increase, storm duration increases, and the geographic footprint of extreme precipitation expands. The result is a compounding increase in both flood frequency and flood magnitude.
The Collapse of Historical Return Periods
Flood-frequency statistics are based on the assumption that the underlying climate remains relatively stable over time. As the climate system shifts, these assumptions begin to break down.
A simplified illustration is shown below:
| Period | Approximate Recurrence of Comparable Extreme Flood Event |
|---|---|
| 1990s | ~500 years |
| Early 2000s | ~100 years |
| 2020s | ~10 years |
| Emerging 2030s Trend | Every few years |
The exact values vary by region, but the direction of change is remarkably consistent across many observational records. Events once considered statistically extraordinary are becoming increasingly common.
Flood Jerk as a Singularity Indicator
The significance of flood jerk extends beyond hydrology. Floods integrate multiple components of the climate system, including atmospheric moisture, ocean heat content, storm dynamics, and large-scale circulation patterns.
As a result, accelerating flood frequency serves as a visible manifestation of deeper systemic changes occurring throughout the Earth system.
The critical observation is not simply that floods are becoming more common. It is that the rate at which flood probabilities are changing appears to be increasing. In mathematical terms, the flood system exhibits positive jerk.
This distinction matters because societies, infrastructure, insurance systems, and economic planning are generally designed around historical probabilities. When those probabilities themselves begin changing at an accelerating rate, risk assessments based on the past become increasingly unreliable.
Flood jerk therefore provides one of the most tangible and societally relevant examples of a climate system transitioning from gradual change toward nonlinear, singularity-like behavior.
Ocean Heat Content: Acceleration Beneath the Surface
More than 90% of the excess energy trapped by greenhouse gases is absorbed by the oceans. As a result, ocean heat content (OHC) provides one of the most reliable measures of Earth’s energy imbalance.
Estimated rates of heat accumulation have increased significantly:
| Period | Approximate Rate |
|---|---|
| 1900–2000 | ~1.2 ZJ/year |
| 2000–2010 | ~8 ZJ/year |
| 2010–2020 | ~11 ZJ/year |
| 2020–2025 | ~16 ZJ/year |
Relative to the 20th-century baseline, the current rate of ocean heat accumulation is more than an order of magnitude higher. This makes ocean heat content one of the clearest physical indicators of accelerating planetary energy imbalance.
Sea Level Rise: Integrated Response of the Climate System
Global mean sea level rise integrates multiple processes including thermal expansion of seawater, glacier melt, and ice-sheet mass loss. As such, it functions as a cumulative indicator of total system response to energy imbalance.
Estimated rates of sea level rise have increased over time:
| Period | Approximate Rate |
|---|---|
| 1900–2000 | ~1.5 mm/year |
| 2000–2010 | ~3.3 mm/year |
| 2010–2020 | ~4.5 mm/year |
| 2020–2025 | ~5.0+ mm/year |
The transition from relatively modest 20th-century rates to significantly higher modern rates reflects both increased ocean heat uptake and accelerating cryospheric contributions. Because sea level rise integrates multiple subsystems, it provides a key “system-level” measure of climate acceleration.
Rossby Wave Amplification: Acceleration in Atmospheric Dynamics
Rossby waves regulate the large-scale structure of atmospheric circulation. Their amplitude, persistence, and phase behavior influence heat waves, droughts, atmospheric rivers, and persistent blocking events.
As Arctic amplification reduces the equator-to-pole temperature gradient, jet stream flow weakens and becomes more susceptible to high-amplitude meanders. This contributes to increasingly persistent weather extremes.
| Period | Relative Persistence Index |
|---|---|
| 1900–2000 | 1.0 |
| 2000–2010 | 1.3 |
| 2010–2020 | 1.8 |
| 2020–2025 | 2.5 |
Rossby wave amplification is particularly important because it functions as a coupling mechanism between atmospheric dynamics and surface impacts. Persistent circulation patterns intensify heat extremes, drought persistence, flood clustering, and wildfire risk, thereby linking atmospheric behavior to surface system responses.
Ice-Sheet Mass Loss: Acceleration at the Cryospheric Frontier
Ice-sheet mass loss from Greenland and Antarctica represents one of the most direct responses to increasing radiative forcing and ocean heat uptake.
| Period | Approximate Rate |
|---|---|
| 1900–2000 | ~30 Gt/year |
| 2000–2010 | ~350 Gt/year |
| 2010–2020 | ~550 Gt/year |
| 2020–2025 | ~800 Gt/year |
The increase in ice-sheet mass loss reflects the combined effects of surface melt, ice-ocean interactions, atmospheric river intrusion, and structural instability in outlet glaciers. These interacting processes produce strong nonlinear feedback behavior and make ice sheets one of the most sensitive components of the Earth system.
From Acceleration to Jerk
Individually, ocean heat content, sea level rise, Rossby wave amplification, and ice-sheet mass loss each demonstrate clear acceleration. Taken together, they indicate something more significant: the acceleration itself is increasing.
This distinction is critical. A system with constant acceleration can often be approximated using standard trend extrapolation. A system with positive jerk cannot. In such a system, the underlying growth parameters evolve over time, and future trajectories diverge increasingly from historical expectations.
In this framework, the emergence of climate jerk represents a potential indicator that the Earth system is transitioning toward a regime dominated by nonlinear feedbacks and interacting subsystems. The central question is therefore no longer whether the climate is changing or accelerating, but whether the rate of acceleration is itself increasing across multiple independent observational domains.
The convergence of ocean heat content, sea level rise, atmospheric circulation changes, and ice-sheet mass loss suggests that this condition may already be underway.
Feedback Loops → Tipping Points → Acceleration → Domino Effect
Feedback loops amplify climate change and can push interconnected Earth systems past critical tipping points. As tipping points are crossed, they can trigger additional feedback loops and destabilize other climate systems. This cascading “Domino Effect” compresses timescales, accelerates change, and increases the risk of rapid, nonlinear climate transformations.
* Our probabilistic, ensemble-based climate model — which incorporates complex socio-economic and ecological feedback loops within a dynamic, nonlinear system — projects that global temperatures are becoming unsustainable this century. This far exceeds earlier estimates of a 4°C rise over the next thousand years, highlighting a dramatic acceleration in global warming. We are now entering a phase of compound, cascading collapse, where climate, ecological, and societal systems destabilize through interlinked, self-reinforcing feedback loops.
We examine how human activities — such as deforestation, fossil fuel combustion, mass consumption, industrial agriculture, and land development — interact with ecological processes like thermal energy redistribution, carbon cycling, hydrological flow, biodiversity loss, and the spread of disease vectors. These interactions do not follow linear cause-and-effect patterns. Instead, they form complex, self-reinforcing feedback loops that can trigger rapid, system-wide transformations — often abruptly and without warning. Grasping these dynamics is crucial for accurately assessing global risks and developing effective strategies for long-term survival.