by Daniel Brouse and Sidd Mukherjee
The climate system is crossing thresholds. Tipping points are activating, feedbacks are coupling, and the consequences are accelerating across interconnected planetary systems.
Overview
🌎🔥 CLIMATE CASCADES ACTIVATED: 1.5°C TRIPWIRE TRIGGERED
We are witnessing a fundamental change in Earth’s climate system.
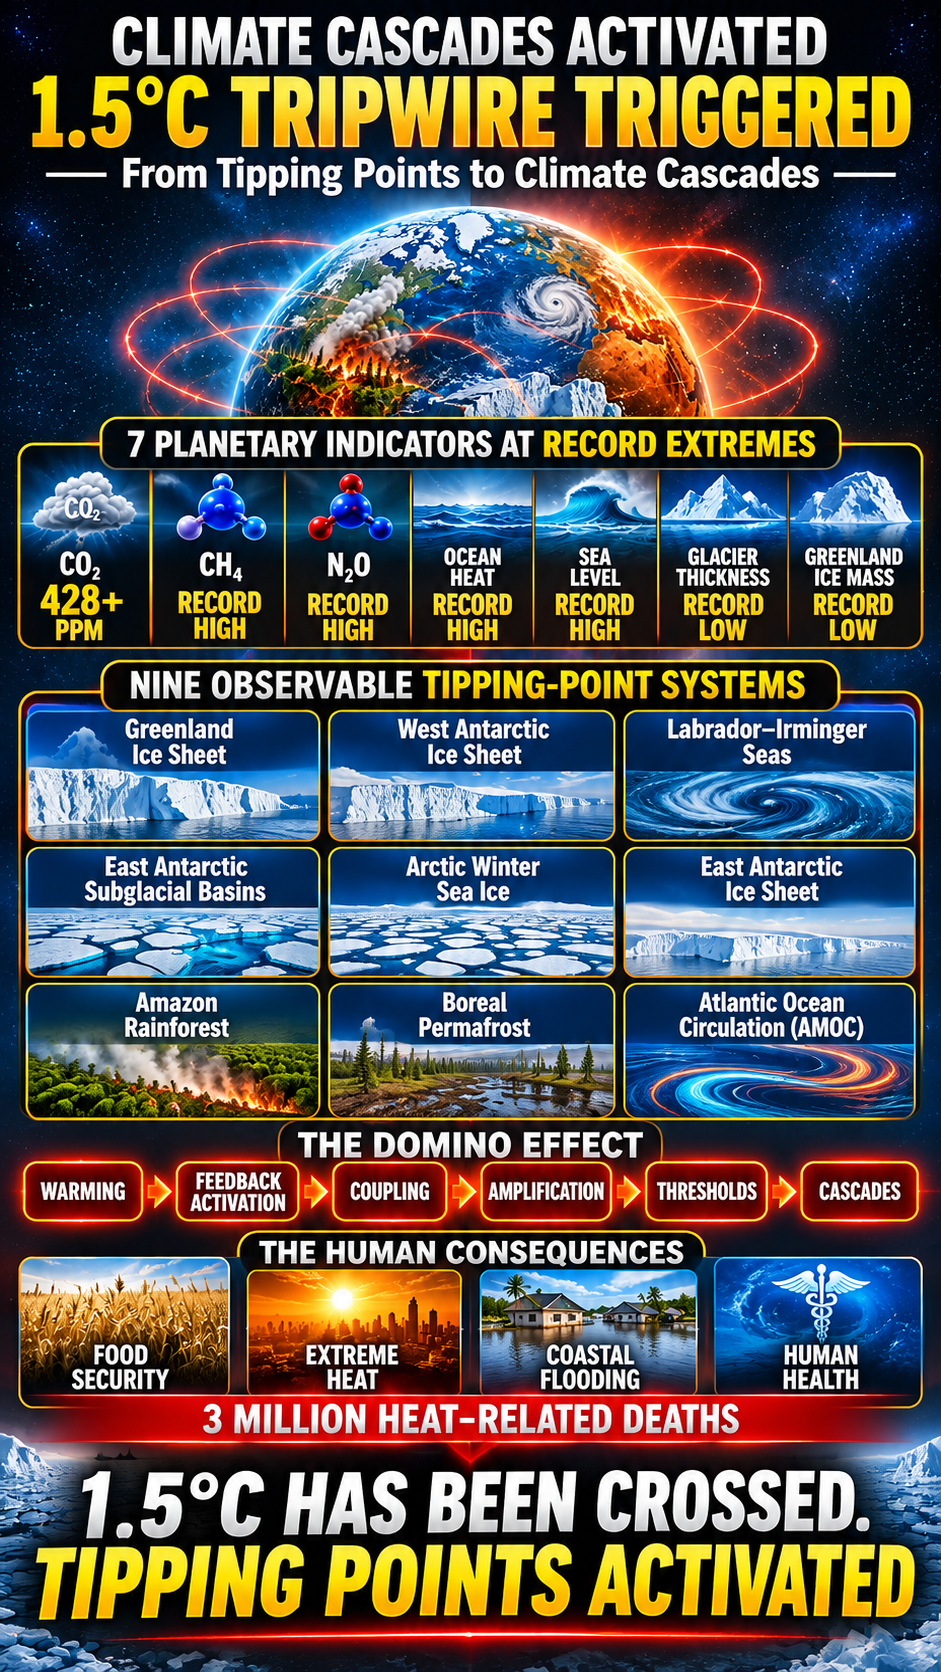
Seven planetary indicators have reached record extremes. Nine major climate tipping-point systems are showing observable signs of destabilization. Greenhouse gases continue accumulating, ocean heat is breaking records, sea levels are rising, and glaciers and ice sheets are losing mass.
But the greatest concern isn’t any single measurement.
It’s the connections.
🌡️ Warming activates feedbacks.
🔄 Feedbacks begin coupling.
⚡ Coupling amplifies the energy imbalance.
🌎 Amplification drives interconnected systems toward thresholds.
🌪️ Thresholds create the conditions for cascading change.
This is the climate Domino Effect.
The 1.5°C threshold was never a magical number. It represents an increasingly dangerous boundary for a nonlinear climate system in which feedbacks can reinforce one another and accelerate planetary destabilization.
The latest climate research documents the warning signs across the atmosphere, oceans, cryosphere, ecosystems, and human health.
Nearly 3 million heat-related deaths between 2016 and 2023 underscore the human consequences.
My latest infographic brings together the planetary indicators, nine tipping-point systems, feedback coupling, and the consequences for humanity.
This is what I call the First Tipping-Point Season: observing the interaction of climate feedbacks as they unfold.
The question is no longer simply how much the planet will warm.
It’s what happens when the systems that regulate our planet begin changing together.
1.5°C HAS BEEN CROSSED.
THE CLIMATE CASCADES ARE UNDERWAY.
🔬 Climate science is no longer just about measuring change. It’s about understanding the connections.
#ClimateChange #ClimateScience #ClimateTippingPoints #ClimateCascades #GlobalWarming #ClimateCrisis #EarthSystemScience #ClimateFeedbacks #ClimateAction
The 1.5°C Tripwire and the Era of Tipping-Point Cascades
Global warming has surpassed the critical 1.5°C threshold identified in the Paris Agreement, according to recent temperature tracking. The consequences include record-breaking climate extremes, escalating threats to human health, and growing instability across agriculture, coastal systems, and international climate diplomacy. Major scientific and health institutions are identifying climate change as a global health emergency.
The 1.5°C threshold—and the approximately 2°C level associated with greater climate-system disruption—does not represent a magical difference between 1.4°C and 1.5°C. These thresholds matter because every increase in global temperature raises the probability of triggering major climate tipping points.
Once tipping points activate, the question of whether global warming ultimately reaches 2°C, 3°C, or even 4–7°C becomes less relevant for two fundamental reasons.
First, tipping points can initiate self-reinforcing feedbacks that continue driving environmental change even after the original forcing changes.
Second, climate impacts do not increase proportionally with temperature. They accelerate, compound, and cascade as interconnected systems destabilize.
In other words, 1.5°C is not a destination. It is not merely a warning sign or an alarm.
It is a tripwire.
Nine Observable Climate Tipping Points
Nine major tipping-point systems have become observable, demonstrating the scale of destabilization underway across the planet.
- Greenland Ice Sheet Collapse
- West Antarctic Ice Sheet Collapse
- Labrador–Irminger Seas / Subpolar Gyre Convection Collapse
- East Antarctic Subglacial Basins Collapse
- Arctic Winter Sea Ice Collapse
- East Antarctic Ice Sheet Collapse
- Amazon Rainforest Dieback
- Boreal Permafrost Collapse
- Atlantic Meridional Overturning Circulation (AMOC) Collapse
These systems do not operate independently. Changes in one system affect the conditions governing others. Ice loss, ocean circulation, atmospheric circulation, freshwater input, surface reflectivity, and carbon-cycle feedbacks interact across planetary boundaries.
The central concern is no longer simply the activation of individual tipping points. It is the interaction, coupling, and amplification of multiple climate feedbacks.
November 2026: Planetary Indicators and Climate Acceleration
Oregon State University Annual Climate Report (November 2026)
The annual State of the Climate report, led by Oregon State University scientists, found that 7 of 16 vital planetary climate indicators had reached record extremes. The report documented accelerating warming, increasing climate instability, and dramatic glacial losses.
Seven planetary indicators stand out:
- Atmospheric Carbon Dioxide (CO₂): Concentrations surpassed 428 parts per million (ppm) in May 2026—approximately 50% above pre-industrial levels.
- Atmospheric Methane (CH₄): Reached an all-time high, increasing atmospheric heat trapping and planetary energy imbalance.
- Atmospheric Nitrous Oxide (N₂O): Reached unprecedented concentrations alongside the other primary greenhouse gases, adding to atmospheric greenhouse forcing.
- Global Ocean Heat Content: Reached the highest measured energy accumulation in recorded history. Oceans absorb more than 90% of the excess heat accumulating in Earth’s climate system.
- Global Sea Level: Reached a record average high, driven by melting land ice and the thermal expansion of warming seawater.
- Worldwide Glacier Thickness: Fell to an all-time historical low, demonstrating accelerating glacier loss, changing regional water systems, and increasing contributions to global sea-level rise.
- Greenland Ice-Sheet Mass: Experienced extreme melting episodes and continued ice loss, reaching its lowest recorded mass.
The report also documented the decline of Oregon’s active glaciers from approximately 60 in the 1970s to just 27.
These seven indicators represent simultaneous record extremes across atmospheric greenhouse gases, ocean energy accumulation, global sea level, and the cryosphere.
The significance is their convergence. Greenhouse gas concentrations are increasing while ocean heat accumulation, sea-level rise, glacier loss, and Greenland ice-sheet depletion reach record extremes.
These are interconnected components of Earth’s climate system. Their simultaneous deterioration demonstrates the scale of planetary energy imbalance and the conditions driving climate feedback activation and coupling.
Global Health Emergency: The Human Cost
2026 Lancet Countdown Report
The newly released 2026 Lancet Countdown report designated climate change a global health crisis.
The report links global warming to nearly 3 million heat-related deaths between 2016 and 2023. It also warns that 60% of the human population, including 1.1 billion children, faces overlapping threats from drought, flooding, and wildfire smoke.
Climate change is no longer an environmental issue separate from public health, food security, economic stability, and human survival.
These impacts are interconnected. Heat stress affects agricultural productivity and human health. Drought and flooding threaten food supplies and infrastructure. Wildfire smoke damages respiratory health. Coastal instability threatens communities, property, and economic systems.
The consequences extend across generations.
The First Tipping-Point Season: Feedback Coupling and Amplification
The critical question is not simply how much the planet warms. It is what happens as warming changes the climate system itself.
Understanding how climate feedbacks interact—and, more importantly, how they amplify one another—is at the forefront of climate science.
Earth’s climate is not a simple thermostat in which each additional degree produces a proportionally larger but otherwise predictable effect. It is a complex, nonlinear system capable of crossing thresholds, activating self-reinforcing feedbacks, and shifting into fundamentally different states.
The first tipping-point season demonstrates that we are no longer examining tipping points solely as isolated possibilities. We are observing the interaction and coupling of climate feedbacks across interconnected planetary systems.
The progression is:
Warming → Feedback Activation → Coupling → Amplification → Thresholds → Cascades
Once feedbacks become coupled, their combined influence changes the dynamics of the entire climate system. The resulting impacts extend beyond the original source of warming, creating additional pathways for energy redistribution, ice loss, ecological disruption, and further warming.
This is why the distinction between 2°C, 3°C, and 4–7°C cannot be understood through temperature projections alone. The behavior of the climate system, the activation of feedbacks, and the cascading consequences of destabilization matter just as much.
1.5°C: The Tripwire
The Paris Agreement’s 1.5°C threshold matters because it represents a boundary associated with increasing risks of irreversible climate-system changes.
The difference between 1.4°C and 1.5°C is not magical. The significance lies in the increasing probability of crossing thresholds that activate self-reinforcing processes.
The climate system is changing. Tipping points are becoming observable. Feedbacks are interacting. Their combined effects are accelerating climate disruption across planetary systems.
We are no longer simply approaching the tipping-point crisis. We are entering its cascading phase.
1.5°C is not a destination.
It is not merely a warning sign.
It is not an alarm.
It is a tripwire.
Sources and References
Climate Cascades Activated: 1.5°C Tripwire Triggered
The following sources support the planetary indicators, greenhouse gas measurements, climate tipping-point research, cascading feedbacks, and human health impacts.
1. Planetary Indicators and Climate Acceleration
- Copernicus Climate Change Service: Climate Indicators. Observational datasets tracking greenhouse gas concentrations, global temperatures, glacier loss, sea ice, ocean heat, and global sea-level changes.
- UNEP / International Cryosphere Climate Initiative (ICCI) — November 2, 2026: Overshoot and the Cryosphere: Averting Global Meltdown. Joint scientific assessment examining the consequences of exceeding 1.5°C, including polar ice-sheet destabilization, glacier loss, declining sea ice, permafrost thaw, and changes in polar ocean systems.
- United Nations Environment Programme (UNEP): Limiting Overshoot: Navigating Exceedance of 1.5°C and Pathways Towards Return. Assessment of temperature overshoot, climate-system consequences, and pathways for returning global warming below 1.5°C.
- Oregon State University — October 14, 2026: 2026 State of the Climate Report: Earth’s Climate System Increasingly Unstable. Documents seven of 16 planetary climate indicators at record extremes, including atmospheric CO₂ exceeding 428 ppm, ocean heat accumulation, and losses of glaciers and Greenland ice.
- Ripple et al. (2026), BioScience: The 2026 State of the Climate Report: Challenges and Opportunities. Peer-reviewed research documenting planetary vital signs, record-breaking climate indicators, accelerating warming, and changes across Earth’s interconnected climate systems.
- Eos (2026): 2026 State of the Climate Report Shows a Planet Reaching Its Limits. Independent scientific reporting examining the seven planetary indicators at record extremes and their implications for climate stability.
- NASA — Sea Level Change Portal: Global Sea-Level and Ice-Mass Measurements. Satellite observations and scientific data documenting global sea-level rise, Greenland and Antarctic ice loss, and ocean contributions to rising seas.
2. Climate Tipping Points and Cascading Feedbacks
- Boers et al. (2025), Nature Geoscience: Destabilization of Earth System Tipping Elements. Observation-based evidence of declining stability in Greenland, Atlantic Meridional Overturning Circulation (AMOC), the Amazon, and South American monsoon systems.
- Armstrong McKay et al. (2022), Science: Exceeding 1.5°C Global Warming Could Trigger Multiple Climate Tipping Points. Scientific assessment of tipping thresholds, risks, and potential cascading effects across interconnected Earth systems.
- Global Tipping Points Report (2023): Earth System Tipping Points. Comprehensive assessment of cryosphere, biosphere, and ocean-atmosphere tipping systems and their interactions.
- Organisation for Economic Co-operation and Development (OECD): Climate Tipping Points: A Critical Moment for Action. Assessment of tipping thresholds, interactions, socioeconomic consequences, and cascading climate risks.
- Nature Reviews Physics (October 2026): Tipping Points in Complex Ecological Systems. Research examining nonlinear dynamics, ecological destabilization, and cascading transitions in complex systems.
- Daniel Brouse and Sidd Mukherjee (September 2026): Tipping Point Season: Climate Change Hunting Manual. Observational framework examining nine climate tipping-point systems and their interactions, coupling, and amplification.
3. Global Health Emergency
- The Lancet Countdown (2026): 2026 Global Report: A Decade of Escalating Health Harms. Global climate-health indicators documenting escalating threats to human health and the call to recognize climate change as a global health emergency.
- World Health Organization (October 28, 2026): Climate Change Is a Growing Health Emergency. Summary of the 2026 Lancet Countdown findings and the growing public-health consequences of climate change.
- University of Sydney (November 6, 2026): Experts Call for Climate Change to Be Declared a Global Health Emergency. Reports nearly three million heat-related deaths attributable to climate change between 2016 and 2023.
- Lancet Countdown — Data Explorer: Heat-Related Mortality. Underlying mortality estimates, research methodology, and attribution of heat-related deaths to human-caused climate change.
4. Additional Climate Science Resources
- Indicators of Global Climate Change (2025 Update): Earth System Science Data (2026). Scientific assessment of global greenhouse gas concentrations, human influence on the climate system, and the Earth’s changing energy balance.
- NASA — Global Climate Change: Vital Signs of the Planet. Climate measurements, satellite observations, and scientific explanations of global warming, greenhouse gases, sea-level rise, ice loss, and Earth’s changing climate.
- European Commission — Polar and Ocean Research: Climate Tipping Points. Research resources examining polar and ocean systems, ice-sheet destabilization, and interconnected climate processes.